Transferir como PDF, PPTX

![collections - Vetores
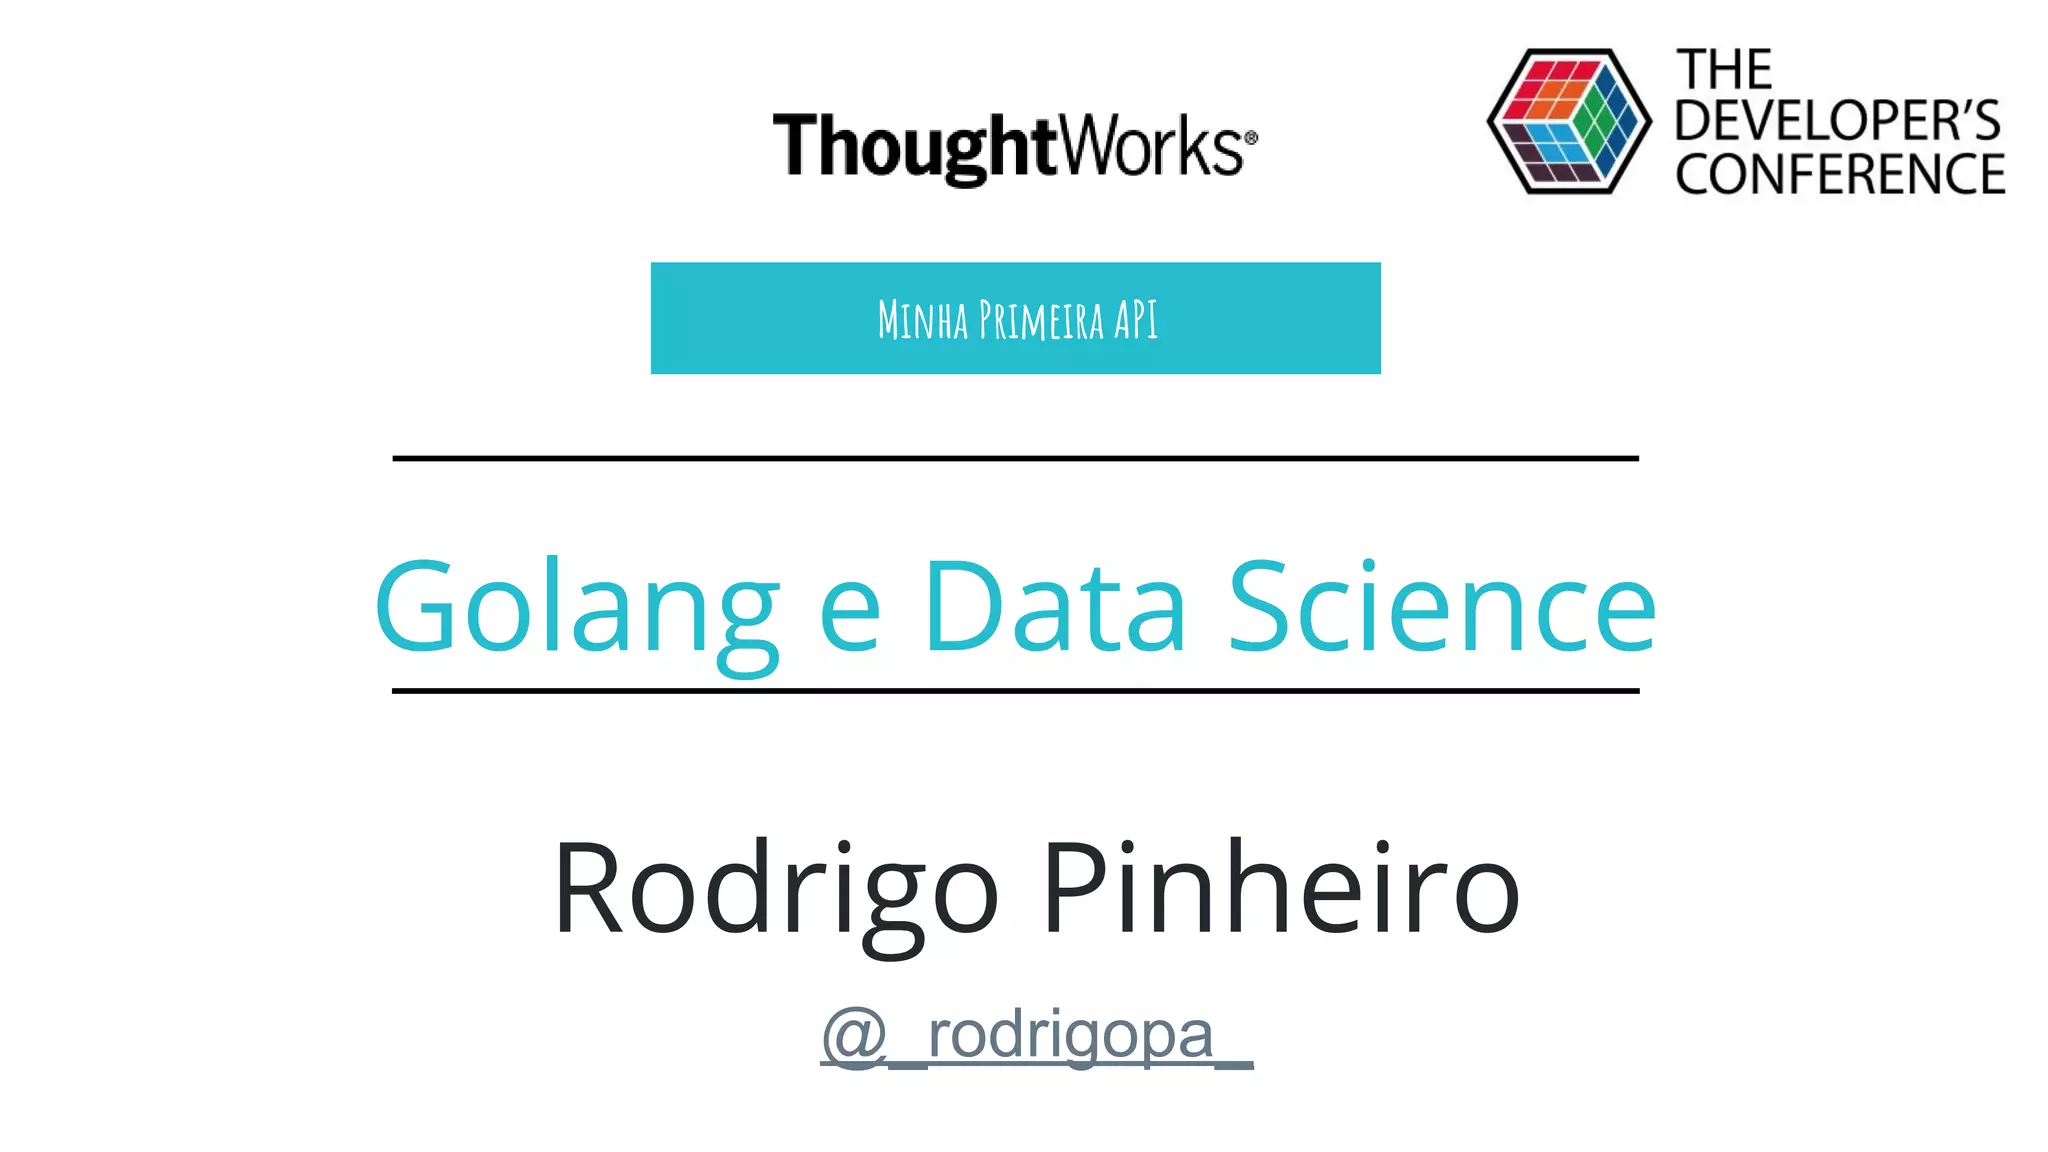
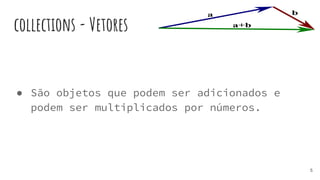
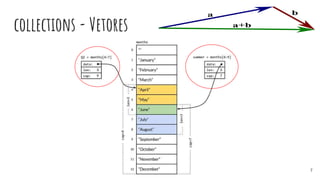
collections.Vector
type Vector []float64
func (v Vector) Len() int
func (v Vector) Less(i, j int) bool
func (v Vector) Swap(i, j int)
func (v Vector) Max() float64
func (v Vector) Min() float64
Arrays ou Slices?
6](https://image.slidesharecdn.com/golangedatascience-oficialv1-170722162942/85/Golang-e-data-science-oficial-v1-6-320.jpg)
![linalg
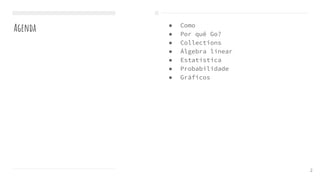
func TestAdd(t *testing.T) {
cases := []struct {
x, y, want collections.Vector
}{
{collections.Vector{1.0, 1.0}, collections.Vector{0.0, 0.0}, collections.Vector{1.0,1.0}},
...
{collections.Vector{}, collections.Vector{2.0}, collections.Vector{}},}
for _, c := range cases {
got := Add(c.x, c.y)
if !reflect.DeepEqual(got, c.want)
t.Errorf("Add(%v, %v) want: %v; got: %v",c.x, c.y, c.want, got)
...
9](https://image.slidesharecdn.com/golangedatascience-oficialv1-170722162942/85/Golang-e-data-science-oficial-v1-9-320.jpg)
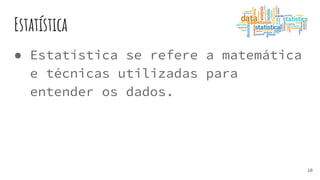
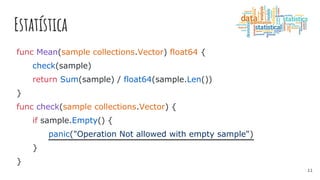
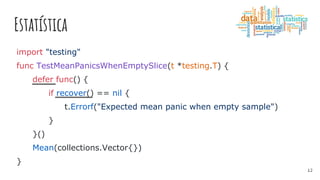
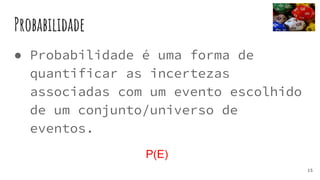
![Estatística
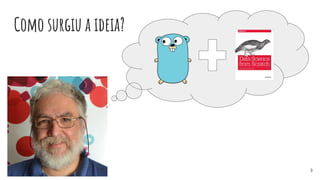
func Median(sample collections.Vector) float64 {
check(sample)
sort.Float64s(sample)
half := sample.Len() / 2
if oddSize(sample) {
return sample[half]
}
return Mean(collections.Vector{sample[half-1], sample[half]})
}
13](https://image.slidesharecdn.com/golangedatascience-oficialv1-170722162942/85/Golang-e-data-science-oficial-v1-13-320.jpg)
![Estatística - Interface Sort
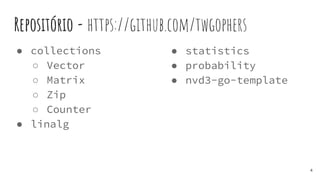
package sort
type Interface interfacet {
Len() float64
Less(i, j int) bool
Swap(i, j int)
}
type Vector []float64
func (v Vector) Len() int {
return len(v)
}
func (v Vector) Less(i, j int) bool {
return v[i] < v[j]
}
func (v Vector) Swap(i, j int) {
v[i], v[j] = v[j], v[i]
} 14](https://image.slidesharecdn.com/golangedatascience-oficialv1-170722162942/85/Golang-e-data-science-oficial-v1-14-320.jpg)
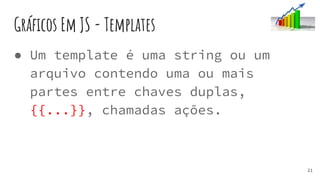
![Gráficos Em JS - Templates
function sinAndCos() {
var cos = [];
{{range .}}
cos.push({x: {{.X}}, y: {{.Y}}})
{{end}}
return ...
}
22](https://image.slidesharecdn.com/golangedatascience-oficialv1-170722162942/85/Golang-e-data-science-oficial-v1-22-320.jpg)
![Gráficos Em JS - Templates
func init() {
t = template.Must(template.ParseFiles("templates/index.html",
"templates/js.tmpl"))
data = []Data_type{
Data_type{X: 1950, Y: 300.2},
...
Data_type{X: 2000, Y: 10289.7},
}
}
t.ExecuteTemplate(f, "index.html", data) 23](https://image.slidesharecdn.com/golangedatascience-oficialv1-170722162942/85/Golang-e-data-science-oficial-v1-23-320.jpg)


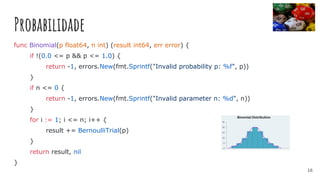
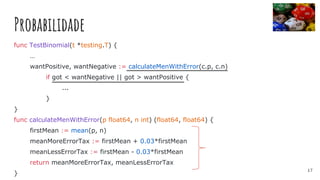
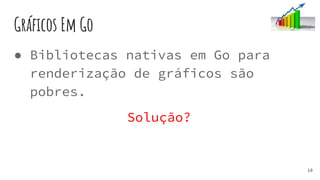
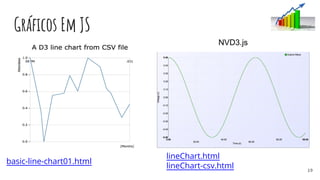
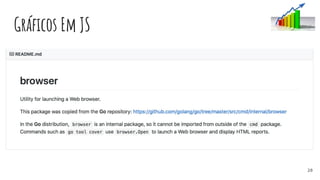
O documento discute a criação de uma biblioteca em Go para data science, incluindo coleções, álgebra linear, estatística, probabilidade e gráficos. A biblioteca contém funções para vetores, matrizes, operações matemáticas e estatísticas básicas, além de templates HTML/JS para renderização de gráficos. O objetivo é fornecer ferramentas para análise de dados e machine learning em Go.


![Matematica função.ppt [salvo automaticamente]](https://cdn.slidesharecdn.com/ss_thumbnails/matematica-funo-pptsalvoautomaticamente-101117110923-phpapp01-thumbnail.jpg?width=640&height=640&fit=bounds)


