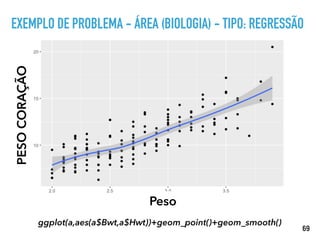
Transferir como PDF, PPTX


![DESMISTIFICANDO A CIÊNCIA DE DADOS
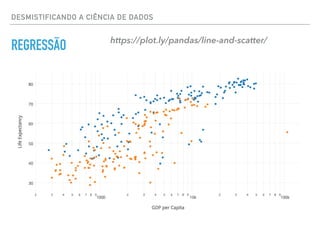
REGRESSÃO https://plot.ly ('Coefficients: n', array([ 0.00118801]))
Mean squared error: 9.71
Variance score: -2.38](https://image.slidesharecdn.com/datascience-161212040827/85/Data-science-23-320.jpg)


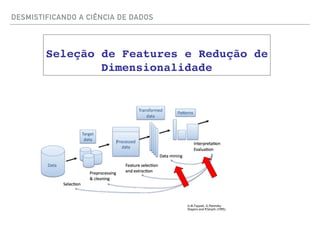
![DESMISTIFICANDO A CIÊNCIA DE DADOS
ANÁLISE DE SENTIMENTO
>>> docs_new = ['God is love', 'OpenGL on the GPU is fast']
>>> X_new_counts = count_vect.transform(docs_new)
>>> X_new_tfidf = tfidf_transformer.transform(X_new_counts)
>>> predicted = clf.predict(X_new_tfidf)
>>> for doc, category in zip(docs_new, predicted):
... print('%r => %s' % (doc, twenty_train.target_names[category]))
...
'God is love' => soc.religion.christian
'OpenGL on the GPU is fast' => comp.graphics](https://image.slidesharecdn.com/datascience-161212040827/85/Data-science-49-320.jpg)

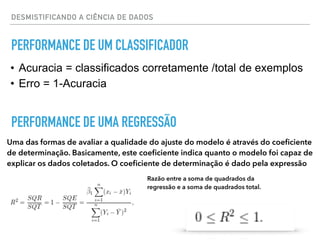

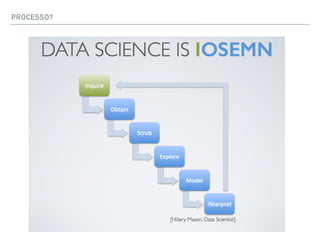
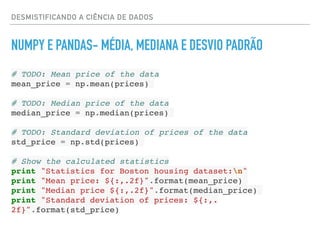
![DESMISTIFICANDO A CIÊNCIA DE DADOS
NUMPY E PANDAS- LENDO ARQUIVO CSV
import numpy as np
import pandas as pd
import visuals as vs # Supplementary code
from sklearn.cross_validation import ShuffleSplit
# Load the Boston housing dataset
data = pd.read_csv('housing.csv')
prices = data['MEDV']
features = data.drop('MEDV', axis = 1)](https://image.slidesharecdn.com/datascience-161212040827/85/Data-science-58-320.jpg)

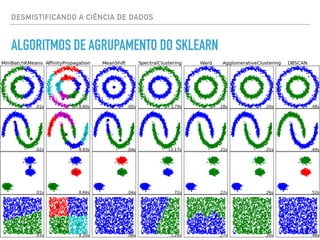
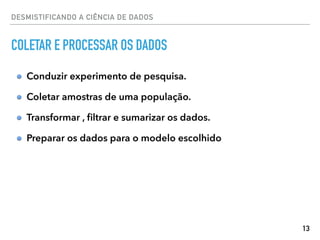
![CLASSIFICAÇÃO NO SKLEARN
# Create a classifier: a support vector classifier
classifier = svm.SVC(gamma=0.001)
# We learn the digits on the first half of the digits
classifier.fit(data[:n_samples / 2], digits.target[:n_samples /
2])
DESMISTIFICANDO A CIÊNCIA DE DADOS](https://image.slidesharecdn.com/datascience-161212040827/85/Data-science-62-320.jpg)
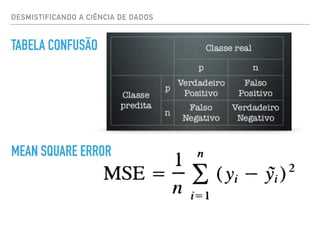
![CLASSIFICANDO EMAILS
DESMISTIFICANDO A CIÊNCIA DE DADOS
from sklearn.naive_bayes import MultinomialNB
classifier = MultinomialNB()
…
classifier.fit(counts, targets)
examples = ['Free Viagra call today!', "I'm going to
attend the Linux users group tomorrow."]
….
predictions = classifier.predict(example_counts)
predictions # [1, 0]](https://image.slidesharecdn.com/datascience-161212040827/85/Data-science-63-320.jpg)


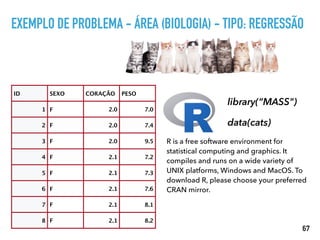
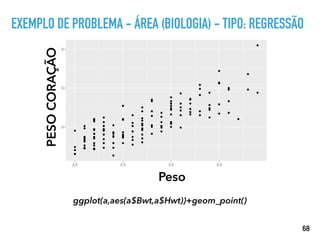

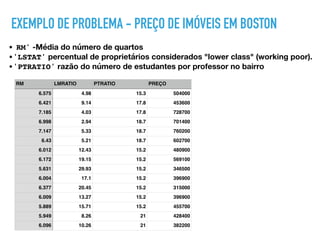
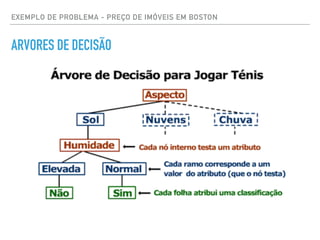
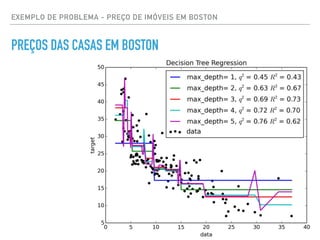
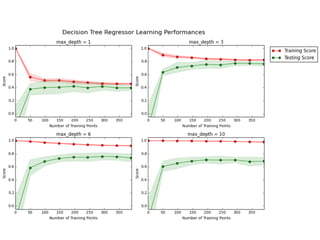
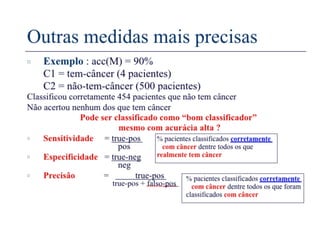
![EXEMPLO DE PROBLEMA - PREÇO DE IMÓVEIS EM BOSTON
CÓDIGO DE REGRESSÃO NO SKLEARN
regressor = DecisionTreeRegressor(random_state=42)
params = {"max_depth": [1,2,3,4,5,6,7,8,9,10]}
# TODO: Create the grid search object
grid = GridSearchCV(regressor,
param_grid=params, scoring =
scoring_fnc, cv = cv_sets)
# Fit the grid search object to the data to compute the optimal
model
grid = grid.fit(X, y)](https://image.slidesharecdn.com/datascience-161212040827/85/Data-science-76-320.jpg)
![EXEMPLO DE PROBLEMA - PREÇO DE IMÓVEIS EM BOSTON
PREDICTING
# Produce a matrix for client data
client_data = [[5, 17, 15], # Client 1
[4, 32, 22], # Client 2
[8, 3, 12]] # Client 3
# Show predictions
for i, price in
enumerate(reg.predict(client_data)):
Predicted selling price for Client 1's home: $414,473.68
Predicted selling price for Client 2's home: $214,302.44
Predicted selling price for Client 3's home: $910,700.00](https://image.slidesharecdn.com/datascience-161212040827/85/Data-science-77-320.jpg)

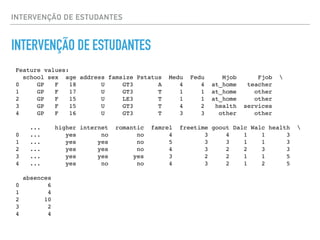
![INTERVENÇÃO DE ESTUDANTES
PREPARANDO OS DADOS
# If data type is non-numeric, replace all yes/no values with 1/0
if col_data.dtype == object:
col_data = col_data.replace(['yes', 'no'], [1, 0])
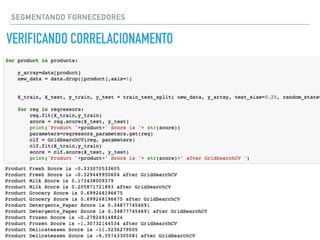
X_train, X_test, y_train, y_test = train_test_split(X_all, y_all,
stratify=y_all, train_size=train_size,test_size=0.24)
SEPARANDO DADOS DE TREINO E TESTE](https://image.slidesharecdn.com/datascience-161212040827/85/Data-science-80-320.jpg)
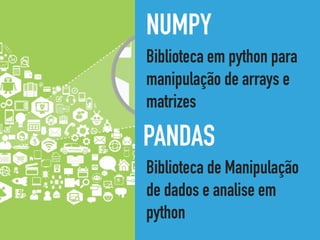
![Decision Trees Pros:
• Regras de decisão intuitivas
• Pode utilizar campos não lineares
Decision Trees Cons:
• Alto Bias [Random Forests pode ser a solução]
• Sem ranking score
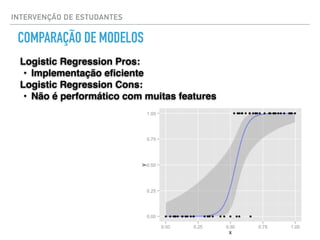
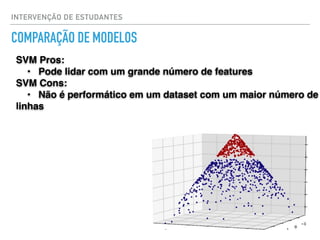
COMPARAÇÃO DE MODELOS
INTERVENÇÃO DE ESTUDANTES](https://image.slidesharecdn.com/datascience-161212040827/85/Data-science-83-320.jpg)

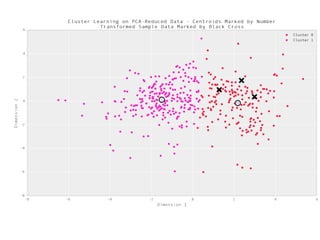


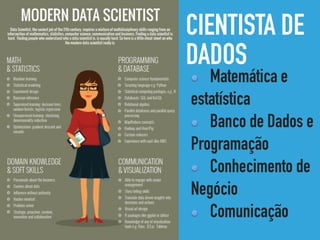
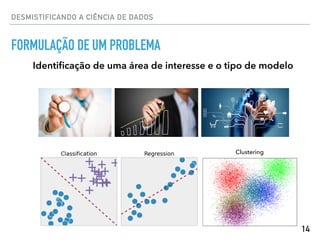
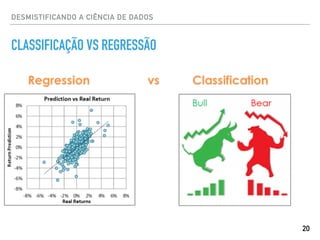
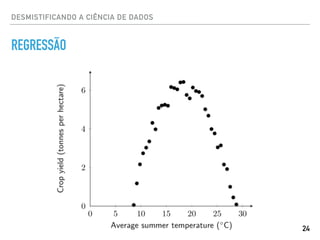
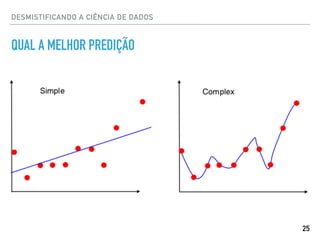
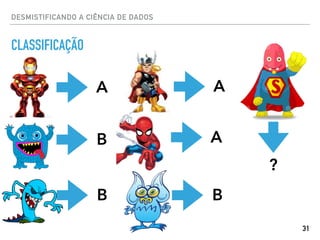
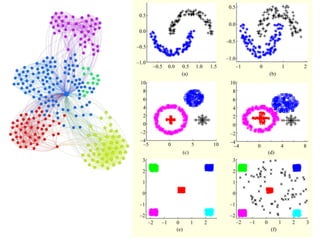
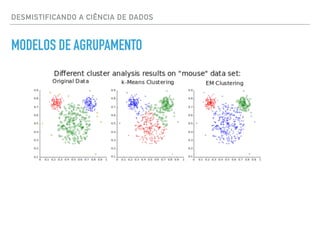
O documento apresenta uma palestra sobre ciência de dados, definindo o termo, discutindo os principais tipos de modelos como classificação, regressão e agrupamento, e fornecendo exemplos de aplicações como análise de sentimento e previsão de preços de imóveis.


![[José Ahirton Lopes] Ciência de Dados -](https://cdn.slidesharecdn.com/ss_thumbnails/cienciadedados-180420135621-thumbnail.jpg?width=640&height=640&fit=bounds)


