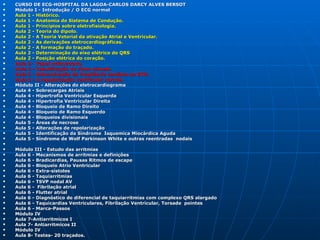
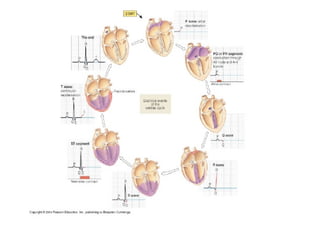
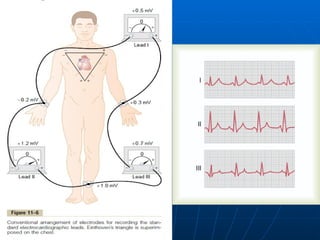
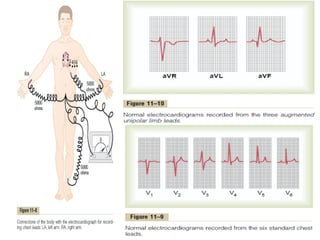
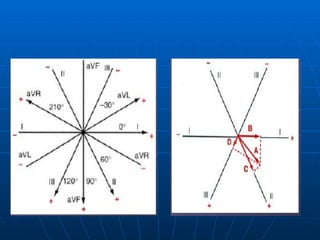
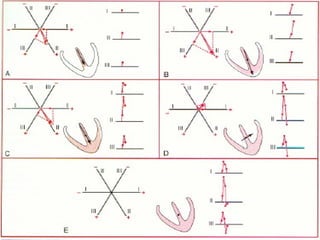
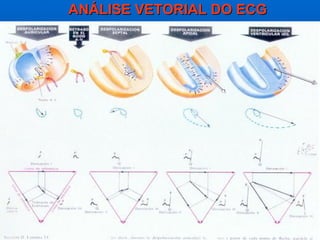
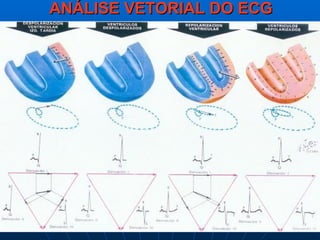
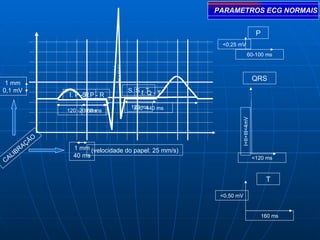
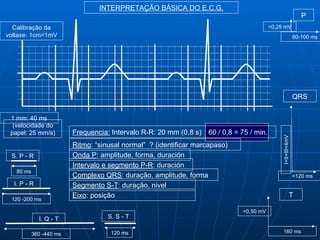
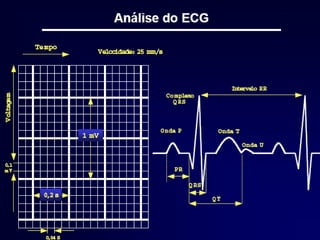
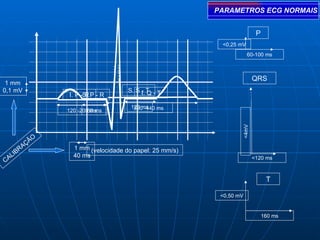
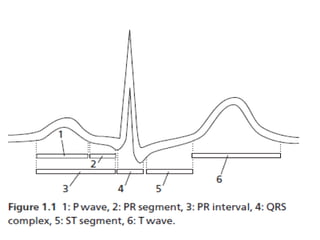
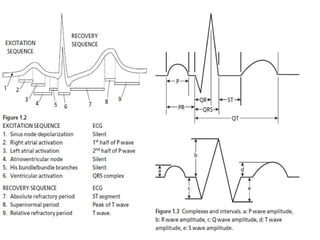
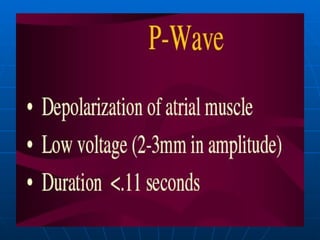
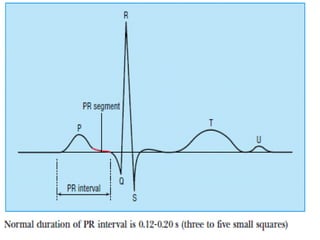
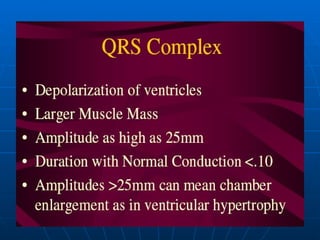
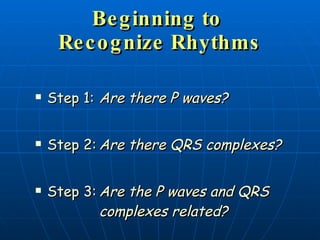
ECG MÓDULO I
   AULA 3
CARLOS DARCY ALVES
     BERSOT
   CURSO DE ECG-HOSPITAL DA LAGOA-CARLOS DARCY ALVES BERSOT
   Módulo I - Introdução / O ECG normal
   Aula 1 - Histórico.
   Aula 1 - Anatomia do Sistema de Condução.
   Aula 1 - Princípios sobre eletrofisiologia.
   Aula 2 - Teoria do dipolo.
   Aula 2 - A Teoria Vetorial da ativação Atrial e Ventricular.
   Aula 2 - As derivações eletrocardiográficas.
   Aula 2 - A formação do traçado.
   Aula 2 - Determinação do eixo elétrico do QRS
   Aula 2 - Posição elétrica do coração.
   Aula 3- Papel milimetrado.
   Aula 3 - Identificação do ritmo sinusal.
   Aula 3 - Determinação da freqüência cardíaca ao ECG.
   Aula 3 - A repolarização ventricular normal.
   Módulo II - Alterações do eletrocardiograma
   Aula 4 - Sobrecargas Atriais
   Aula 4 - Hipertrofia Ventricular Esquerda
   Aula 4 - Hipertrofia Ventricular Direita
   Aula 4 - Bloqueio de Ramo Direito
   Aula 4 - Bloqueio de Ramo Esquerdo
   Aula 4 - Bloqueios divisionais
   Aula 5 - Áreas de necrose
   Aula 5 - Alterações de repolarização
   Aula 5 - Identificação da Síndrome Isquemica Miocárdica Aguda
   Aula 5 - Síndrome de Wolf Parkinson White e outras reentradas nodais


   Módulo III - Estudo das arritmias
   Aula 6 - Mecanismos de arritmias e definições
   Aula 6 - Bradicardias, Pausas Ritmos de escape
   Aula 6 - Bloqueio Atrio Ventricular
   Aula 6 - Extra-sístoles
   Aula 6 - Taquiarritmias
   Aula 6 - TSVP nodal AV
   Aula 6 - Fibrilação atrial
   Aula 6 - Flutter atrial
   Aula 6 - Diagnóstico de diferencial de taquiarritmias com complexo QRS alargado
   Aula 6 - Taquicardias Ventriculares, Fibrilação Ventricular, Torsade pointes
   Aula 6 - Marca-Passos
   Módulo IV
   Aula 7-Antiarritmicos I
   Aula 7- Antiarritmicos II
   Módulo IV
   Aula 8- Testes- 20 traçados.
Review
Action Potentials = Change in membrane
potential occurring in nerve, muscle, heart and
other cells


The ECG is not an action potential but
reflects their cumulative effect at the
level of the skin where the recording
electrodes are located.
EKG Recorder


String Galvanometer Based
EKG Recorder. Patient with
hands submerged in strong
salt solution.
Recording depolarization
and repolarization waves
ANÁLISE VETORIAL DO ECG
PARAMETROS ECG NORMAIS


                                                                                         P
                                                                  <0,25 mV
                                                                                 60-100 ms


                                                                                        QRS
 1 mm
0,1 mV                                       S. S I. T - T
                                                  - Q
                         I. P -S. P - R
                                R
                                              120 ms ms
                                               360 -440
                         120 -20080 ms
                                  ms


                                                                         I+II+III<4mV
                 Ã   O
            R AÇ           1 mm (velocidade do papel: 25 mm/s)
        B
     LI                    40 ms
CA
                                                                                        <120 ms


                                                                                              T

                                                                  <0,50 mV


                                                                                             160 ms
INTERPRETAÇÃO BÁSICA DO E.C.G.
                                                                                                                P
  Calibração da                                                                          <0,25 mV
voltaxe: 1cm=1mV                                                                                             60-100 ms


                                                                                                             QRS


 1 mm: 40 ms
  (velocidade do
 papel: 25 mm/s)         Frequencia: Intervalo R-R: 20 mm (0,8 s) 60 / 0,8 = 75 / min.


                                                                                              I+II+III<4mV
                         Ritmo: “sinusal normal” ? (identificar marcapaso)
 S. P - R                Onda P: amplitude, forma, duración
                         Intervalo e segmento P-R: duración
   80 ms
                         Complexo QRS: duração, amplitude, forma                                             <120 ms
  I. P - R               Segmento S-T: duração, nivel
                         Eixo: posição                                                                   T
 120 -200 ms

                                                                              <0,50 mV
             I. Q - T               S. S - T

           360 -440 ms               120 ms                                                   160 ms
PARAMETROS ECG NORMAIS


                                                                                 P
                                                                  <0,25 mV
                                                                             60-100 ms


                                                                                QRS
 1 mm
0,1 mV                                       S. S I. T - T
                                                  - Q
                         I. P -S. P - R
                                R
                                              120 ms ms
                                               360 -440
                         120 -20080 ms
                                  ms


                                                                         <4mV
                 Ã   O
            R AÇ           1 mm (velocidade do papel: 25 mm/s)
        B
     LI                    40 ms
CA
                                                                                <120 ms


                                                                                      T

                                                                  <0,50 mV


                                                                                     160 ms
INTERPRETAÇÃO BÁSICA DO E.C.G.
                                                                                                        P
Calibração da                                                                           <0,25 mV
 voltagem:                                                                                           60-100 ms
 1cm=1mV


                                                                                                     QRS


1 mm: 40 ms
 (velocidade do
papel: 25 mm/s)         Frequencia: Intervalo R-R: 20 mm (0,8 s) 60 / 0,8 = 75 / min.
                        Ritmo: “sinusal normal” ? (identificar marcapaso)


                                                                                             I<4mV
S. P - R                Onda P: amplitude, forma, duración
                        Intervalo e segmento P-R: duração
  80 ms
                        Complexo QRS: duração, amplitude, forma                                      <120 ms
 I. P - R               Segmento S-T: duração, nivel
                        Eixo: posição                                                            T
120 -200 ms

                                                                             <0,50 mV
            I. Q - T               S. S - T

          360 -440 ms               120 ms                                                   160 ms
The Rule of 300
What is the heart rate?


    (300 / 6) = 50 bpm
What is the heart rate?


                            www.uptodate.com


   (300 / ~ 4) = ~ 75 bpm
What is the heart rate?


    (300 / 1.5) = 200 bpm
Be g inning to
     Re c o g nize Rhythms

   Step 1: Are there P waves?


   Step 2: Are there QRS complexes?


   Step 3: Are the P waves and QRS
            complexes related?
Example 1

   STEP 1.
         • Are there P waves?
Example 1 Continued
   Are there P waves?
    • Yes, P waves are easily identifiable
      and regular in rate.
Example 1 Continued
   STEP 2.
    • Are there QRS complexes?
Example 1 Continued
   STEP 2.
    • Yes there are normal, narrow, QRS
      complexes.
Example 1 Continued
   STEP 3
    • Are they related, 1:1?
Example 1 Continued
   STEP 3
    • Are they related, 1:1?
          Yes, there is one P wave for every QRS.


          This is called a sinus rhythm
Example 2

   Follow steps 1-3 as demonstrated in Ex. 1.
   This is also a sinus rhythm.
Example Three

   Following the same steps, this one
    doesn’t match up!?!?
Example 3 continued
   Step 1
    • Are there P waves?
          Yes,


    • Note: notice the dotted arrows indicate the
      location of P waves buried in the stronger
      electrical activity of the QRS complexes.
Example 3 Continued
   STEP 2
    • Are there QRS complexes?
        Yes, there are normal, narrow
         QRS complexes.
Example 3 Continued
   STEP 3.
    • Are they related?
          NO, they are both regular in shape and
           rate, but there is no relation between
           them.


    • This shows a Complete Heart Block, also called
      a 3rd degree block.
    • Can the Heart effectively pump blood if the
      Atria and Ventricles are not working together?
Ecg 3.0
Ecg 3.0
Ecg 3.0
Ecg 3.0
Ecg 3.0

Ecg 3.0

  • 1.
    ECG MÓDULO I AULA 3 CARLOS DARCY ALVES BERSOT
  • 2.
    CURSO DE ECG-HOSPITAL DA LAGOA-CARLOS DARCY ALVES BERSOT  Módulo I - Introdução / O ECG normal  Aula 1 - Histórico.  Aula 1 - Anatomia do Sistema de Condução.  Aula 1 - Princípios sobre eletrofisiologia.  Aula 2 - Teoria do dipolo.  Aula 2 - A Teoria Vetorial da ativação Atrial e Ventricular.  Aula 2 - As derivações eletrocardiográficas.  Aula 2 - A formação do traçado.  Aula 2 - Determinação do eixo elétrico do QRS  Aula 2 - Posição elétrica do coração.  Aula 3- Papel milimetrado.  Aula 3 - Identificação do ritmo sinusal.  Aula 3 - Determinação da freqüência cardíaca ao ECG.  Aula 3 - A repolarização ventricular normal.  Módulo II - Alterações do eletrocardiograma  Aula 4 - Sobrecargas Atriais  Aula 4 - Hipertrofia Ventricular Esquerda  Aula 4 - Hipertrofia Ventricular Direita  Aula 4 - Bloqueio de Ramo Direito  Aula 4 - Bloqueio de Ramo Esquerdo  Aula 4 - Bloqueios divisionais  Aula 5 - Áreas de necrose  Aula 5 - Alterações de repolarização  Aula 5 - Identificação da Síndrome Isquemica Miocárdica Aguda  Aula 5 - Síndrome de Wolf Parkinson White e outras reentradas nodais   Módulo III - Estudo das arritmias  Aula 6 - Mecanismos de arritmias e definições  Aula 6 - Bradicardias, Pausas Ritmos de escape  Aula 6 - Bloqueio Atrio Ventricular  Aula 6 - Extra-sístoles  Aula 6 - Taquiarritmias  Aula 6 - TSVP nodal AV  Aula 6 - Fibrilação atrial  Aula 6 - Flutter atrial  Aula 6 - Diagnóstico de diferencial de taquiarritmias com complexo QRS alargado  Aula 6 - Taquicardias Ventriculares, Fibrilação Ventricular, Torsade pointes  Aula 6 - Marca-Passos  Módulo IV  Aula 7-Antiarritmicos I  Aula 7- Antiarritmicos II  Módulo IV  Aula 8- Testes- 20 traçados.
  • 3.
  • 4.
    Action Potentials =Change in membrane potential occurring in nerve, muscle, heart and other cells The ECG is not an action potential but reflects their cumulative effect at the level of the skin where the recording electrodes are located.
  • 5.
    EKG Recorder String GalvanometerBased EKG Recorder. Patient with hands submerged in strong salt solution.
  • 6.
  • 12.
  • 13.
  • 14.
    PARAMETROS ECG NORMAIS P <0,25 mV 60-100 ms QRS 1 mm 0,1 mV S. S I. T - T - Q I. P -S. P - R R 120 ms ms 360 -440 120 -20080 ms ms I+II+III<4mV Ã O R AÇ 1 mm (velocidade do papel: 25 mm/s) B LI 40 ms CA <120 ms T <0,50 mV 160 ms
  • 15.
    INTERPRETAÇÃO BÁSICA DOE.C.G. P Calibração da <0,25 mV voltaxe: 1cm=1mV 60-100 ms QRS 1 mm: 40 ms (velocidade do papel: 25 mm/s) Frequencia: Intervalo R-R: 20 mm (0,8 s) 60 / 0,8 = 75 / min. I+II+III<4mV Ritmo: “sinusal normal” ? (identificar marcapaso) S. P - R Onda P: amplitude, forma, duración Intervalo e segmento P-R: duración 80 ms Complexo QRS: duração, amplitude, forma <120 ms I. P - R Segmento S-T: duração, nivel Eixo: posição T 120 -200 ms <0,50 mV I. Q - T S. S - T 360 -440 ms 120 ms 160 ms
  • 17.
    PARAMETROS ECG NORMAIS P <0,25 mV 60-100 ms QRS 1 mm 0,1 mV S. S I. T - T - Q I. P -S. P - R R 120 ms ms 360 -440 120 -20080 ms ms <4mV Ã O R AÇ 1 mm (velocidade do papel: 25 mm/s) B LI 40 ms CA <120 ms T <0,50 mV 160 ms
  • 18.
    INTERPRETAÇÃO BÁSICA DOE.C.G. P Calibração da <0,25 mV voltagem: 60-100 ms 1cm=1mV QRS 1 mm: 40 ms (velocidade do papel: 25 mm/s) Frequencia: Intervalo R-R: 20 mm (0,8 s) 60 / 0,8 = 75 / min. Ritmo: “sinusal normal” ? (identificar marcapaso) I<4mV S. P - R Onda P: amplitude, forma, duración Intervalo e segmento P-R: duração 80 ms Complexo QRS: duração, amplitude, forma <120 ms I. P - R Segmento S-T: duração, nivel Eixo: posição T 120 -200 ms <0,50 mV I. Q - T S. S - T 360 -440 ms 120 ms 160 ms
  • 28.
  • 32.
    What is theheart rate? (300 / 6) = 50 bpm
  • 33.
    What is theheart rate? www.uptodate.com (300 / ~ 4) = ~ 75 bpm
  • 34.
    What is theheart rate? (300 / 1.5) = 200 bpm
  • 35.
    Be g inningto Re c o g nize Rhythms  Step 1: Are there P waves?  Step 2: Are there QRS complexes?  Step 3: Are the P waves and QRS complexes related?
  • 36.
    Example 1  STEP 1. • Are there P waves?
  • 37.
    Example 1 Continued  Are there P waves? • Yes, P waves are easily identifiable and regular in rate.
  • 38.
    Example 1 Continued  STEP 2. • Are there QRS complexes?
  • 39.
    Example 1 Continued  STEP 2. • Yes there are normal, narrow, QRS complexes.
  • 40.
    Example 1 Continued  STEP 3 • Are they related, 1:1?
  • 41.
    Example 1 Continued  STEP 3 • Are they related, 1:1?  Yes, there is one P wave for every QRS.  This is called a sinus rhythm
  • 42.
    Example 2  Follow steps 1-3 as demonstrated in Ex. 1.  This is also a sinus rhythm.
  • 43.
    Example Three  Following the same steps, this one doesn’t match up!?!?
  • 44.
    Example 3 continued  Step 1 • Are there P waves?  Yes, • Note: notice the dotted arrows indicate the location of P waves buried in the stronger electrical activity of the QRS complexes.
  • 45.
    Example 3 Continued  STEP 2 • Are there QRS complexes?  Yes, there are normal, narrow QRS complexes.
  • 46.
    Example 3 Continued  STEP 3. • Are they related?  NO, they are both regular in shape and rate, but there is no relation between them. • This shows a Complete Heart Block, also called a 3rd degree block. • Can the Heart effectively pump blood if the Atria and Ventricles are not working together?