Baixado 35 vezes

![DAX (Data Analysis Expression)
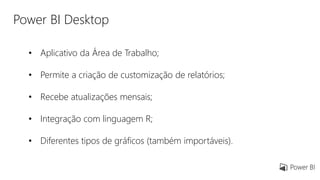
• Linguagem amplamente usada em PowerPivot/Power BI / SSAS;
• Usada para geração de formulas e criação de medidas e
colunas para analises de negócio.
Exemplos:
Genero = IF('UK-Bank-Customers'[Gender]="Male";"Homem";"Mulher")
SquaredBalance = 'UK-Bank-Customers'[Balance] * 'UK-Bank-Customers'[Balance]](https://image.slidesharecdn.com/powerbidesktopprimeirospassos-170729002609/85/PowerBI-Primeiros-Passos-12-320.jpg)


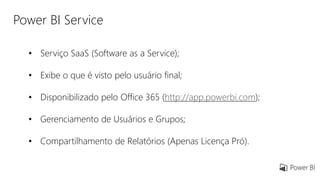
O documento apresenta uma introdução ao Power BI, definindo o que é Business Intelligence (BI) e Power BI, descrevendo as principais ferramentas do Power BI como Power BI Desktop, Power BI Service e a linguagem DAX. O documento também fornece referências adicionais para aprendizagem.


![[FM2S] Slides - Power BI da escola FM2S.pptx](https://cdn.slidesharecdn.com/ss_thumbnails/fm2sslides-powerbi-250610193503-2f7889cf-thumbnail.jpg?width=640&height=640&fit=bounds)