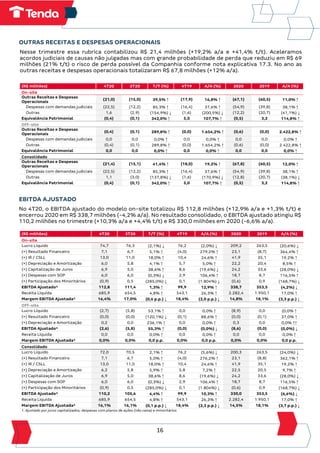
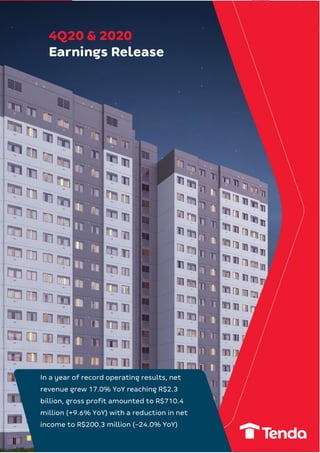
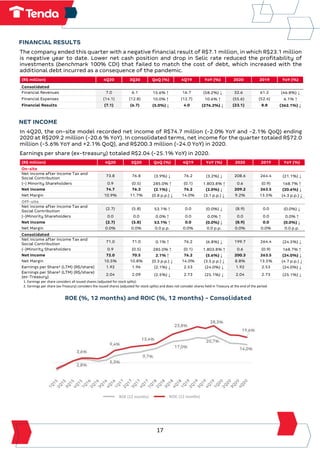
Em ano de recordes operacionais, receita
líquida cresceu 17,0% a/a atingindo R$ 2,3
bilhões, lucro bruto de R$ 710,4 milhões
(+9,6% a/a) com redução do lucro líquido
contabilizando R$ 200,3 milhões (-24,0% a/a)
2
São Paulo, 11 de março de 2021 – Construtora Tenda S.A. (“Companhia”, “Tenda”), uma das principais
construtoras e incorporadoras com foco em habitação popular no Brasil, anuncia hoje seus resultados
do 4º trimestre e ano de 2020.
DESTAQUES
FINANCEIROS
▪ ReceitalíquidadeR$2,3biem2020(+17,0%a/a).No4T20,contabilizouR$685,9milhões(+26,3%a/a);
▪ Margem bruta ajustada de 32,2% em 2020 (-2,8 p.p. a/a). No 4T20, o indicador registrou 31,5% (-1,9 p.p.
a/a);
o Margem REF encerrou 2020 em 35,2% (-4,0 p.p. a/a) impactada pela perda de produtividade
nas obras que sofreram paralizações no 1S20 por conta da pandemia e aumento no custo dos
materiais de obra;
▪ Lucro Líquido de R$ 200,3 milhões no ano (-24% a/a) registrando R$ 72,0 milhões no trimestre. O
modelo off-site totalizou no ano um prejuízo de R$ -8,9 milhões sendo R$ -2,7 milhões no trimestre;
▪ Geração de caixa operacional finalizou o ano no positivo em R$ 70,0 milhões (+223,9% a/a). No 4T20,
a Companhia acelerou a atividade de algumas obras para combater reajustes nos custos de materiais
consumindo R$ 54,3 milhões;
▪ Dívidalíquida/PLde-9,8%,desalavancagemreduzidapelasdistribuiçõeserecomprasaolongodoano;
OPERACIONAIS
▪ Lançamento de 20empreendimentos no 4T20comVGV de R$885,2milhões (+5,9% a/a e -10,1% t/t);
o Ano recorde em lançamentos atingindo o VGV de R$ 2,67 bilhões (+3,5% a/a);
▪ Vendas brutas recorde no trimestre de R$ 854,7 milhões (+27,7% a/a e +2,2% t/t) e VSO bruta de
35,0% (+4,5p.p. a/a e -1,3% t/t). Em ano recorde, foram registrados R$ 2,92 bilhões em VGV (+30,4%
a/a);
o Vendas líquidas recorde no trimestre de R$ 795,2 milhões no 4T20 (+29,1% a/a e +7,2% t/t) e
VSO líquida de 32,5% (+4,5 p.p. a/a e +0,2 p.p t/t). Em ano recorde, foram registrados R$ 2,55
bilhões em VGV (+25,2% a/a);
o Distratos de 7,0% (-1,0 p.p. a/a e -4,2 p.p. t/t) sobre vendas brutas no 4T20, encerrando o ano
com média de 12,6% (+3,7 p.p. a/a);
▪ VGV repassado de R$ 619,8 milhões nesse trimestre (+12,1% a/a e -1,0% t/t) totalizando no ano R$
2,14 bilhões (+30,7% a/a);
▪ Banco de terrenos atingiu R$ 10,97 bilhões em VGV ao final de 2020 (+3,3% a/a);
COVID-19
▪ Lançamento recorde no ano com recuperação no segundo semestre;
▪ Vendas em níveis recordes sinalizando resiliência da demanda e eficiência dos canais de venda própria
online e de terceiros;
▪ As obras e repasses foram normalizadas ao longo do 3T20;
3
MENSAGEM DA ADMINISTRAÇÃO
Mesmo em um ano desafiador marcado pela pandemia do Covid-19, a Tenda apresentou resultados
operacionais recordes em lançamentos, vendas e repasse atestando mais uma vez a resiliência do
mercado de habitação popular brasileiro, e se consolidando como a principal empresa exclusivamente
focada em projetos voltados para o grupo 2 do programa Casa Verde e Amarela.
Foram lançadas mais de 18mil unidades habitacionais em 2020 que representam um VGV de R$ 2,66
bilhões (+3,5% a/a) acompanhado por um aumento expressivo das vendas líquidas que atingiram o VGV
R$ 2,55 bilhões (+25,2% a/a) e VSO trimestral de 32,5% (+4,5 p.p. a/a). Cabe ressaltar que o desempenho
recorde de vendas ocorreu organicamente sem a necessidade de redução de preços ou aumento do
custo de vendas, muito em função da grande transformação digital que temos promovido em todo
processo de vendas, tanto para lojas próprias quanto no relacionamento com as empresas de vendas
parceiras, permitindo captura de eficiência mesmo em um cenário complexo de distanciamento social.
O bom desempenho operacional, principalmente no segundo semestre, reflete na melhora da receita
operacional. Tivemos níveis recordes de receita operacional líquida que registrou nesse ano R$ 2,29
bilhões (+17% a/a). Por outro lado, a margem bruta ajustada foi impactada negativamente pelos
efeitos da pandemia finalizando o ano em 32,2% (-2,8 p.p. a/a), com destaque para perda de
produtividade de algumas obras paralisadas no primeiro semestre (normalizadas 3T20). Em função das
pressões com aumento nos custos de materiais que o setor vem sofrendo, a margem de resultados a
apropriar também apresentou redução de -1,1 p.p. t/t e -4,0 p.p. a/a em virtude das novas safras de
obras que já refletem esse aumento.
Com isso, a Tenda entregou um lucro líquido de R$ 200,3 milhões, queda de 24,0% a/a, fechando o ano
com 14,0% de ROE (-6,7 p.p. a/a), 19,6% de ROIC (-8,7 p.p. a/a) e lucro de R$ 2,04 por ação (ex-
Tesouraria), queda de 25,1% a/a. Nesse último trimestre a Companhia consumiu R$ 54,3 milhões de
caixa operacional adotando a estratégia de acelerar atividades em algumas obras como saída para evitar
reajustes de preços em 2021, finalizando o ano com uma geração R$ 70,0 milhões de caixa operacional.
A Tenda reitera a sua opção por uma gestão financeira conservadora. A Companhia mantém uma
posição de caixa líquido (R$ 148,3 milhões no final de 2020), resultando em uma relação entre dívida
líquida e patrimônio líquido de -9,8%. A decisão estratégica é validada pela recorrência de eventos que
impactam a geração de caixa, como os atrasos nos repasses dentro do programa Casa Verde e Amarela.
Em 2020 realizamos avanços importantes no projeto off-site ganhando cada vez mais convicção de
que ele é a grande plataforma de crescimento da Companhia, com destaque para os pilotos executados
que comprovaram as teses iniciais de qualidade de produto e eficiência de produção, vinda anunciada no
trimestre passado do Marcelo Willer (ex-CEO Alphaville Urbanismo) como investidor minoritário do
projeto e o investimento que estamos realizando na montagem de uma fábrica com alta capacidade
produtiva de até 10 mil unidades ano prevista para iniciar as operações no segundo semestre de 2021. A
partir do ano de 2021, temos a ambição de formar landbank robusto para escalar a operação, buscando
operar em capacidade total da nova fábrica em 2026.
A Tenda ressalta que permanece orientada à geração de valor de longo prazo buscando construir
diferenciais competitivos através da industrialização da construção civil, almejando ser a empresa que
consistentemente entrega maior retorno aos seus acionistas.
4
GUIDANCE
Com o objetivo de gerar simetria de informações e dar previsibilidade ao mercado sobre os nossos
números, a Companhia optou em 2021 por divulgar projeções (guidance) do modelo on-site baseadas
em expectativas da Administração, bem como em estudos internos realizados e nas condições
econômico-financeiras do mercado de atuação.
• Em 2021, para a Margem Bruta Ajustada, entendida como a razão entre o resultado bruto (deduzido
dos encargos financeiros presentes na nota explicativa 11 das demonstrações financeiras) e a receita
líquida consolidada do exercício, estima-se uma oscilação entre o mínimo de 30,0% e o máximo de
32,0%.
• Em 2021, para as Vendas Líquidas, definidas como o resultado da subtração entre as vendas brutas
(em R$ milhões) e os distratos (em R$ milhões) realizados do exercício, ajustados todos os valores à
participação societária da Tenda, estima-se uma oscilação entre o mínimo de R$2.800 milhões e o
máximo de R$ 3.000 milhões.
Guidance 2021 Limite Inferior Limite Superior
Margem Bruta Ajustada (%) 30,0% 32,0%
Vendas Líquidas (R$ MM) 2.800,0 3.000,0
ABERTURA ENTRE AS OPERAÇÕES TENDA ON-SITE E OFF-SITE
Seguindo com o nosso compromisso
iniciamos a partir deste trimestre a
apresentação dos dados segregados
entre as operações on-site e off-site.
On-site: Modelo em que a companhia
opera desde 2013 caracterizado pela
construção no canteiro de obra de
apartamentos usando o método
construtivo parede de concreto com
forma de alumínio, em regiões
metropolitanas com demanda mínima
produtiva de 1.000 unidades/ano.
Off-site: Modelo caracterizado pelo
desenvolvimento de casas produzidas em
uma fábrica usando a tecnologia
construtiva woodframe e montadas no
canteiro de obra. Esse modelo não exige
uma demanda mínima local abrindo a
possibilidade da companhia explorar
mercados menores atuando em
pequenas e médias cidades do país.
Consolidado: Resultado agregado das
duas operações.
Off-site
No Tenda Day, evento realizado para investidores no dia 16 de dezembro de 2020, anunciamos o
investimento que estamos realizando na montagem de uma fábrica de alta produção. Além disso,
divulgamos as imagens das primeiras casas prontas do projeto piloto que consiste em um condomínio
com 49 casas localizado em Mogi das Cruzes em um terreno que já fazia parte do nosso landbank. O
projeto off-site, nesse primeiro momento, visa explorar a demanda das cidades médias do interior de
São Paulo.
Nova Fábrica: A nova fábrica será inaugurada no 2º semestre de 2021 na cidade de Jaguariúna, interior
de São Paulo. São mais de 18mil m² com alta capacidade produtiva de 10 mil unidades ano que a
companhia almeja atingir em 2026. Os novos maquinários estão a caminho do Brasil com a chegada
prevista para o segundo trimestre. Estamos iniciando a desmobilização do nosso centro de inovação
incorporando à nova fábrica o maquinário existente.
Estágio DATEC: DATEC é o documento de avaliação técnica que credencia os materiais utilizados e
processos adotados para um determinado sistema construtivo. Obter a certificação DATEC para o novo
sistema construtivo do off-site nos qualifica em operar no mesmo modelo da Tenda on-site realizando
o repasse do cliente com a CEF ao longo da obra. O processo de certificação está em andamento com
previsão de publicação no primeiro semestre de 2021.
Parceria Tecverde: A Tecverde é pioneira em construções woodframe no Brasil, são mais de 10 anos de
experiência e mais de 4,5mil unidades construídas. Com objetivo de acelerar nossa curva de
aprendizado no sistema construtivo, a Tenda firmou no 4T20 parceria com a Tecverde que está
construindo 50 casas no interior de São Paulo.
6
Indicadores a serem monitorados: Na construção off-site há uma facilidade maior de traduzir e
implementar os conceitos de engenharia de produção para engenharia civil. As casas são produzidas em
um ambiente controlado livre de intempéries climáticas, há possibilidade no ganho de produtividade
operando no limite em 3 turnos e melhoria de eficiência através da automação.
Produzir as casas em uma fábrica realizando somente a montagem no canteiro de obra permite a
companhia operar em mercados de baixa escala local.
A possibilidade de operar em uma baixa escala local aumenta substancialmente a quantidade de
mercados endereçáveis aumentando a escala global a ser explorada.
A alta escala global permite que a empresa tenha custos competitivos através do desenvolvimento da
cadeia de suprimentos, traduzindo em melhores produtos ofertados (localização, área, preço e
urbanismo) que implica em uma alta velocidade de vendas reforçando o ganho de escala. Quanto mais
rápido gira o flywheel maior é o diferencial competitivo da Companhia no longo prazo.
O sucesso do projeto off-site depende do ganho de escala, acompanhar os indicadores de compra de
terreno e lançamentos são um balizador para monitorar a velocidade de execução do projeto.
Encerramos 2020 com dois projetos pilotos e reforçamos que 2021 e 2022 continuam sendo anos de
aprendizados escalando o volume de lançamentos a partir de 2023.
Baixa
Escala
Local
7
ESG
A Companhia no 3T20 apresentou um ponto de partida no tema com os principais elementos de impacto
ESG, tomando por base os temas materiais propostos pelo SASB (Sustainability Accounting Standards
Board) e pelo S&P SAM CSA (Corporate Sustainability Assessment) para o setor, além de outros aspectos
materiais derivados da atuação da Tenda no segmento de habitação popular.
Os principais elementos de impacto ESG da Tenda podem ser agrupados em três pilares:
Inclusão social
Produtos ao alcance das famílias de baixa renda em empreendimentos que trazem bem-estar,
saneamento e infraestrutura para as comunidades
Na Tenda, empresa na B3 integralmente dedicada à produção de unidades residenciais populares, todos
os empreendimentos se enquadram no grupo 2 do Programa Casa Verde e Amarela. A Companhia oferece
apartamentos com preços 19% inferiores à média praticada pelos principais concorrentes (de acordo
com informações de vendas do 4T20), permitindo acesso ao imóvel próprio a famílias que nunca tiveram
essa alternativa. Em 2020, a Tenda atingiu famílias com renda média familiar mensal de R$ 2.473, valor
mais próximo do piso do que do teto do grupo 2 do PCVA (faixa de renda familiar mensal entre R$ 2.000
e R$ 4.000).
Preço Médio de Vendas (R$ mil) 4T20 3T20 T/T (%) 4T19 A/A (%)
Tenda (R$ / unid) 142 143 (0,7%) ↓ 139 2,2% ↑
PCVA¹ (R$ / unid) 175 171 2,3% ↑ 165 6,1% ↑
% Preço Médio de Vendas (Tenda / PCVA) 81,1% 83,6% (3,0%) ↓ 84,2% (3,7%) ↓
¹ Preço médio ponderado entre MRV (apenas MRV) e Direcional (apenas Direcional)
¹ com base nas vendas brutas realizadas entre jan/20 e dez/20
² preço médio ponderado entre MRV (100%) e Direcional (apenas PCVA 2 e 3)
8
Respeito ao cliente e ao colaborador
Produtos de qualidade, entregues no prazo e feitos de forma segura por profissionais diretamente
contratados e com oportunidades de crescimento
Todos os empreendimentos lançados a partir de 2013, ano que marca o início do atual modelo de
negócios, foram entregues dentro do prazo contratual, um dos principais compromissos firmados pela
Administração com seus clientes. A Companhia tem voltado esforços para a satisfação do cliente e, em
2020, o Net Promoting Score (NPS), uma das principais métricas globais de satisfação, passou a fazer
parte das metas dos principais executivos.
Na Tenda, praticamente todos os colaboradores envolvidos na construção dos edifícios são empregados
diretamente pela Companhia, e não terceirizados, como costuma ser a prática no setor. Além de permitir
a implementação da abordagem industrial à construção, o principal diferencial competitivo da Tenda, a
iniciativa traz mais segurança e estabilidade para os funcionários. A Tenda adota práticas de segurança
e saúde ocupacional rigorosas, monitorando riscos e indicadores de forma contínua.
Indicadores 4T20 3T20 T/T (%) 4T19 A/A (%)
Entregas dentro do prazo (%)¹ 100% 100% 0,0% ↑ 100% 0,0% ↑
Número de colaboradores diretos² 3.757 3.682 2,0% ↑ 3.558 5,6% ↑
Número de colaboradores indiretos 1.620 1.900 (14,7%) ↓ 1.762 (8,1%) ↓
Total de colaboradores 5.377 5.582 (3,7%) ↓ 5.320 1,1% ↑
% colaboradores diretos / total 70% 66% 5,9% ↑ 67% 4,5% ↑
¹ Empreendimentos lançados a partir de 2013, marco inicial do atual modelo de negócios
² Funcionários diretamente contratados pela Companhia
9
Compromisso com a ética e a governança
Rigor e atuação responsável em todas as etapas da viabilização dos empreendimentos, com gestão
alinhada às melhores práticas corporativas
O comportamento ético faz parte da cultura da Tenda e está no centro das decisões da Companhia,
desde os processos de prospecção e legalização dos futuros empreendimentos até as melhores práticas
junto aos colaboradores e fornecedores. A empresa mantém um Comitê de Ética coordenado pelo
diretor-presidente, códigos de ética e conduta voltados para colaboradores e fornecedores, e canais de
denúncia independentes.
Empresa do Novo Mercado, o mais alto nível de Governança Corporativa da B3, a Tenda atende a 90%
das melhores práticas estabelecidas pelo IBGC no Código Brasileiro de Governança. Todos os
conselheiros são independentes e todos os diretores são estatutários, com 37% da remuneração total
vinculada a incentivos de longo prazo.
³ Com base nas respostas do formulário CVM 586 da Tenda
4
Conforme proposta da administração aprovada em AGO para o ano de 2020
Para mais informações ESG, entre em contato com a equipe de RI da Tenda em ri@tenda.com
10
DESTAQUES OPERACIONAIS E FINANCEIROS
Ainda não constam valores para operação off-site
Destaques Financeiros (R$
milhões)
4T20 3T20 T/T (%) 4T19 A/A (%) 2020 2019 A/A (%)
On-site
Receita Líquida 685,9 654,5 4,8% ↑ 543,1 26,3% ↑ 2.282,4 1.950,1 17,0% ↑
Lucro Bruto Ajustado¹ 216,4 216,3 0,1% ↑ 181,7 19,1% ↑ 734,6 681,7 7,8% ↑
Margem Bruta Ajustada¹ (%) 31,5% 33,0% (1,5 p.p.) ↓ 33,4% (1,9 p.p.) ↓ 32,2% 35,0% (2,8 p.p.) ↓
EBITDA Ajustado² 112,8 111,4 1,3% ↑ 99,9 12,9% ↑ 338,7 353,5 (4,2%) ↓
Margem EBITDA Ajustada² (%) 16,4% 17,0% (0,6 p.p.) ↓ 18,4% (2,0 p.p.) ↓ 14,8% 18,1% (3,3 p.p.) ↓
Lucro Líquido (Prejuízo)³ 74,7 76,3 (2,1%) ↓ 76,2 (2,0%) ↓ 209,2 263,5 (20,6%) ↓
Margem Líquida (%) 10,9% 11,7% (0,8 p.p.) ↓ 14,0% (3,1 p.p.) ↓ 9,2% 13,5% (4,3 p.p.) ↓
Receitas a Apropriar 949,5 745,3 27,4% ↑ 555,2 71,0% ↑ 949,5 555,2 71,0% ↑
Margem Resultados a Apropriar
(%)
35,2% 36,3% (1,1 p.p.) ↓ 39,2% (4,0 p.p.) ↓ 35,2% 39,2% (4,0 p.p.) ↓
Geração de Caixa Operacional⁴ (44,7) 119,3 (137,4%) ↓ (11,3) (296,8%) ↓ 97,7 24,5 299,6% ↑
Off-site
Receita Líquida 0,0 0,0 0,0% ↑ 0,0 0,0% ↑ 0,0 0,0 0,0% ↑
EBITDA Ajustado² (2,6) (5,8) 55,3% ↑ (0,0) 0,0% ↑ (8,6) (0,0) 0,0% ↑
Margem EBITDA Ajustada² (%) 0,0% 0,0% 0,0 p.p. 0,0% 0,0 p.p. 0,0% 0,0% 0,0 p.p.
Lucro Líquido (Prejuízo)³ (2,7) (5,8) 53,1% ↑ 0,0 0,0% ↑ (8,9) 0,0 0,0% ↑
Margem Líquida (%) 0,0% 0,0% 0,0 p.p. 0,0% 0,0 p.p. 0,0% 0,0% 0,0 p.p.
Geração de Caixa Operacional⁴ (9,6) (7,8) (23,3%) ↓ (1,3) (645,5%) ↓ (27,7) (2,8) (874,8%) ↓
Consolidado
Receita Líquida 685,9 654,5 4,8% ↑ 543,1 26,3% ↑ 2.282,4 1.950,1 17,0% ↑
Lucro Bruto Ajustado¹ 216,4 216,3 0,1% ↑ 181,7 19,1% ↑ 734,6 681,7 7,8% ↑
Margem Bruta Ajustada¹ (%) 31,5% 33,0% (1,5 p.p.) ↓ 33,4% (1,9 p.p.) ↓ 32,2% 35,0% (2,8 p.p.) ↓
EBITDA Ajustado² 110,2 105,6 4,4% ↑ 99,9 10,3% ↑ 330,0 353,5 (6,6%) ↓
Margem EBITDA Ajustada² (%) 16,1% 16,1% (0,1 p.p.) ↓ 18,4% (2,3 p.p.) ↓ 14,5% 18,1% (3,7 p.p.) ↓
Lucro Líquido (Prejuízo)³ 72,0 70,5 2,1% ↑ 76,2 (5,6%) ↓ 200,3 263,5 (24,0%) ↓
Margem Líquida (%) 10,5% 10,8% (0,3 p.p.) ↓ 14,0% (3,5 p.p.) ↓ 8,8% 13,5% (4,7 p.p.) ↓
Receitas a Apropriar 949,5 745,3 27,4% ↑ 555,2 71,0% ↑ 949,5 555,2 71,0% ↑
Margem Resultados a Apropriar
(%)
35,2% 36,3% (1,1 p.p.) ↓ 39,2% (4,0 p.p.) ↓ 35,2% 39,2% (4,0 p.p.) ↓
Dívida Líquida /
(PL+Minoritários) (%)
(9,8%) (16,9%) 7,2 p.p. ↑ (14,8%) 5,0 p.p. ↑ (9,8%) (14,8%) 5,0 p.p. ↑
Geração de Caixa Operacional⁴ (54,3) 111,5 (148,7%) ↓ (12,5) (332,5%) ↓ 70,0 21,6 223,9% ↑
ROE⁵ (12 meses) 14,0% 14,7% (0,7 p.p.) ↓ 20,7% (6,7 p.p.) ↓ 14,0% 20,7% (6,7 p.p.) ↓
ROIC⁶ (12 meses) 19,6% 21,1% (1,5 p.p.) ↓ 28,3% (8,7 p.p.) ↓ 19,6% 28,3% (8,7 p.p.) ↓
Lucro por Ação⁷ (12 meses)
(R$/ação) (ex-Tesouraria)
2,04 2,09 (2,5%) ↓ 2,73 (25,1%) ↓ 2,04 2,73 (25,1%) ↓
1. Ajustado por juros capitalizados.
2. Ajustado por juros capitalizados, despesas com planos de ações (não caixa) e minoritários.
3. Ajustado por minoritários
4. A Geração de Caixa Operacional é resultado de um cálculo gerencial interno da companhia que não reflete ou compara-se aos números presentes nas DFs
5. ROE é calculado pelo lucro líquido dos últimos 12 meses ajustado por minoritários divididos pela média do patrimônio líquido. Média referente à posição de abertura
e fechamento dos últimos 12 meses.
6. ROIC é calculado pelo NOPAT dos últimos 12 meses divididos pela média do capital empregado. Média referente à posição de abertura e fechamento dos últimos 12
meses.
7. Lucro por ação (ex-Tesouraria) considera as ações emitidas (ajustadas em casos de desdobramento de ações) e desconsidera as ações mantidas em Tesouraria ao
final do período.
Destaques Operacionais (R$
milhões, VGV)
4T20 3T20 T/T (%) 4T19 A/A (%) 2020 2019 A/A (%)
On-site
Lançamentos 885,2 984,2 (10,1%) ↓ 835,8 5,9% ↑ 2.665,2 2.575,1 3,5% ↑
Vendas Líquidas 795,2 742,1 7,2% ↑ 615,9 29,1% ↑ 2.553,5 2.039,6 25,2% ↑
VSO Líquida (%) 32,5% 32,3% 0,2 p.p. ↑ 28,0% 4,5 p.p. ↑ 60,8% 56,3% 4,5 p.p. ↑
VGV Repassado 619,8 626,2 (1,0%) ↓ 553,1 12,1% ↑ 2.144,8 1.641,1 30,7% ↑
Unidades Entregues (#) 2.728,0 2.163,0 26,1% ↑ 1.752,0 55,7% ↑ 9.246,0 10.368,0 (10,8%) ↓
Banco de Terrenos 10.974,5 10.802,8 1,6% ↑ 10.619,4 3,3% ↑ 10.974,5 10.619,4 3,3% ↑
11
RESULTADOS OPERACIONAIS
LANÇAMENTOS
No 4T20, a Tenda lançou 20 empreendimentos, totalizando R$ 885,2 milhões em VGV (+5,9% a/a e
-10,1% t/t). Recorde em 2020 os lançamentos atingiram o VGV de R$2,67 bilhões, aumento de 3,5% na
comparação anual.
Nesse ano, a região metropolitana (“RM”) de São Paulo passou a representar 37,1% do VGV lançado
(versus 35,7% em 2019) com 5.898 unidades lançadas (+6,5% a/a). A RM de Salvador representou 19,2%
do VGV lançado (versus 15,7% em 2019) com 3.668 unidades lançadas (+22,8% a/a).
O incremento de 2,2% a/a no preço médio por unidade lançada é explicado pelo crescimento de
representatividade das regionais SP e BA no VGV total lançado, locais em que já lançamos os
empreendimentos com elevadores concentrados mais próximos das regiões centrais.
Ainda não constam valores para operação off-site
VENDAS BRUTAS
As vendas brutas totalizaram R$ 854,7 milhões no 4T20 (+27,7% a/a e +2,2% t/t). Trata-se do melhor
trimestre em vendas brutas na história da Tenda. Na comparação com 2019, o ano de 2020 encerrou
com um aumento de 30,4% no VGV de vendas brutas.
Nesse ano, tivemos incremento no número de unidades vendidas (+26,6% a/a) e no preço médio por
unidade vendida (+3,0% a/a) explicado pela maior participação de São Paulo no mix de vendas brutas
(37,8% em 2020 versus 35,4% em 2019). A VSO bruta atingiu 35,0% no 4T20, decréscimo de 1,3 p.p. em
relação ao 3T20.
Vendas Brutas 4T20 3T20 T/T (%) 4T19 A/A (%) 2020 2019 A/A (%)
On-site
VGV (R$ milhões) 854,7 836,1 2,2% ↑ 669,4 27,7% ↑ 2.921,0 2.239,4 30,4% ↑
Número de unidades 6.042 5.860 3,1% ↑ 4.831 25,1% ↑ 20.761 16.397 26,6% ↑
Preço médio por unidade (R$ mil) 141,5 142,7 (0,9%) ↓ 138,6 2,1% ↑ 140,7 136,6 3,0% ↑
VSO Bruta 35,0% 36,3% (1,3 p.p.) ↓ 30,5% 4,5 p.p. ↑ 69,5% 61,8% 7,7 p.p. ↑
Ainda não constam valores para operação off-site
Vendas Brutas (VGV, R$ milhões) e VSO Bruta (%) On-site
Lançamentos 4T20 3T20 T/T (%) 4T19 A/A (%) 2020 2019 A/A (%)
On-site
Número de Empreendimentos 20 17 17,6% ↑ 22 (9,1%) ↓ 55 63 (12,7%) ↓
VGV (R$ milhões) 885,2 984,2 (10,1%) ↓ 835,8 5,9% ↑ 2.665,2 2.575,1 3,5% ↑
Número de unidades 6.136 6.325 (3,0%) ↓ 5.972 2,7% ↑ 18.120 17.894 1,3% ↑
Preço médio por unidade (R$ mil) 144,3 155,6 (7,3%) ↓ 140,0 3,1% ↑ 147,1 143,9 2,2% ↑
Tamanho médio dos lançamentos
(em unidades)
306,8 372,1 (17,5%) ↓ 271,5 13,0% ↑ 329,5 284,0 16,0% ↑
313
383
319
403 424 463 443 478 471
528 543 504
443
537
590
669
541
689
836 855
28%
31%
25%
29% 30% 31%
28% 30%
32%
37% 35%
31% 30% 32% 31% 30% 31%
36% 36% 35%
1T16 2T16 3T16 4T16 1T17 2T17 3T17 4T17 1T18 2T18 3T18 4T18 1T19 2T19 3T19 4T19 1T20 2T20 3T20 4T20
Vendas Brutas VSO Bruta
12
DISTRATOS E VENDAS LÍQUIDAS
As vendas líquidas totalizaram R$ 795,2 milhões no 4T20 (+29,1% a/a e +7,2% t/t). Trata-se do melhor
trimestre em vendas líquidas na história da Tenda. Encerramos 2020 com R$ 2,55 bilhões, um aumento
de 25,2% na comparação anual.
A velocidade sobre a oferta (“VSO líquida”) atingiu 32,5% nesse trimestre (+4,5 p.p. a/a e +0,2 p.p. t/t).
A média trimestral da VSO Líquida nesse ano contabilizou 30,2%, incremento de 2,1 p.p. frente aos
28,1% de 2019.
A relação distratos sobre vendas brutas de 7,0% no 4T20 reduziu 4,2 p.p frente ao 3T20. Endereçamos
um alto nível de distratos nos primeiros nove meses do ano em função da pandemia tendo uma queda
significativa nesse trimestre. Em 2020 o índice ficou em 12,6% (+3,7 p.p. a/a) e a expectativa é que em
2021 esse indicador continue convergindo para os patamares histórico de 2019.
(VGV, R$ milhões) 4T20 3T20 T/T (%) 4T19 A/A (%) 2020 2019 A/A (%)
On-site
Vendas Brutas 854,7 836,1 2,2% ↑ 669,4 27,7% ↑ 2.921,0 2.239,4 30,4% ↑
Distratos 59,5 94,0 (36,7%) ↓ 53,5 11,2% ↑ 367,5 199,8 83,9% ↑
Vendas Líquidas 795,2 742,1 7,2% ↑ 615,9 29,1% ↑ 2.553,5 2.039,6 25,2% ↑
% Lançamentos¹ 79,6% 54,4% 25,2 p.p. ↑ 83,3% (3,7 p.p.) ↓ 48,0% 51,5% (3,5 p.p.) ↓
% Estoque 20,4% 45,6% (25,2 p.p.) ↓ 16,7% 3,7 p.p. ↑ 52,0% 48,5% 3,5 p.p. ↑
Distratos / Vendas Brutas 7,0% 11,2% (4,2 p.p.) ↓ 8,0% (1,0 p.p.) ↓ 12,6% 8,9% 3,7 p.p. ↑
VSO Líquida 32,5% 32,3% 0,2 p.p. ↑ 28,0% 4,5 p.p. ↑ 60,8% 56,3% 4,5 p.p. ↑
(em unidades) 4T20 3T20 T/T (%) 4T19 A/A (%) 2020 2019 A/A (%)
On-site
Unidades Vendidas Brutas 6.042 5.860 3,1% ↑ 4.831 25,1% ↑ 20.761 16.397 26,6% ↑
Unidades Distratadas 431 681 (36,7%) ↓ 383 12,5% ↑ 2.671 1.490 79,3% ↑
Unidades Vendidas Líquidas 5.611 5.179 8,3% ↑ 4.448 26,1% ↑ 18.090 14.907 21,4% ↑
Distratos / Vendas Brutas 7,1% 11,6% (4,5 p.p.) ↓ 7,9% (0,8 p.p.) ↓ 12,9% 9,1% 3,8 p.p. ↑
1. Lançamentos do ano corrente.
Ainda não constam valores para operação off-site
Vendas Líquidas (VGV, R$ milhões) e VSO Líquida (%) On-site
266
325
239
311 339
388 385
433 424
481 490 459
407
480
537
616
440
576
742
795
24%
26%
19%
22%
24%
26% 25%
27%
29%
33%
32%
29% 27% 29% 28% 28%
25%
30%
32% 33%
1T16 2T16 3T16 4T16 1T17 2T17 3T17 4T17 1T18 2T18 3T18 4T18 1T19 2T19 3T19 4T19 1T20 2T20 3T20 4T20
Vendas Líquidas VSO Líquida
13
UNIDADES REPASSADAS, ENTREGUES E OBRAS EM ANDAMENTO
O VGV repassado totalizou R$ 619,8 milhões no 4T20 (+12,1% a/a e -1,0% t/t). O bom desempenho deve-
se à normalização dos financiamentos no decorrer do segundo semestre, dado que a Caixa Econômica
Federal (“CEF”) adaptou seus procedimentos para superar os desafios operacionais verificados no início
da pandemia. Em 2020, o VGV repassado contabilizou R$ 2,1 bilhões, crescimento anual de 30,7%.
Foram entregues 2.728 unidades no 4T20 totalizando 9.246 unidades ao longo de 2020. Encerramos o
ano com 91 obras em andamento, crescimento de 33,8% em relação à 2019. Com a retomada do setor
imobiliário em 2020 e o consequente aumento dos custos de construção, a Tenda antecipou o início de
algumas das obras como estratégia para mitigar o impacto de reajustes que devem continuar presentes
ao longo de 2021.
Repasses, Entregas e Andamento 4T20 3T20 T/T (%) 4T19 A/A (%) 2020 2019 A/A (%)
On-site
VGV Repassado (em R$ milhões) 619,8 626,2 (1,0%) ↓ 553,1 12,1% ↑ 2.144,8 1.641,1 30,7% ↑
Unidades Repassadas 4.846 5.085 (4,7%) ↓ 4.771 1,6% ↑ 17.215 13.951 23,4% ↑
Unidades Entregues 2.728 2.163 26,1% ↑ 1.752 55,7% ↑ 9.246 10.368 (10,8%) ↓
Obras em andamento 91 82 11,0% ↑ 68 33,8% ↑ 91 68 33,8% ↑
Ainda não constam valores para operação off-site
ESTOQUE A VALOR DE MERCADO
Nesse trimestre o estoque a valor de mercado totalizou R$ 1,65 bilhão em VGV (+4,3% a/a e +5,8% t/t).
O estoque pronto contabilizou R$ 38,8 milhões representando 2,4% do total. O giro do estoque (estoque
a valor de mercado dividido pelas vendas líquidas dos últimos doze meses) em 2020 atingiu 7,8 meses
apresentando melhora em relação aos 8,2 meses de patamar médio do ano anterior.
Estoque a Valor de Mercado 4T20 3T20 T/T (%) 4T19 A/A (%) 2020 2019 A/A (%)
On-site
VGV (R$ milhões) 1.649,2 1.558,8 5,8% ↑ 1.581,6 4,3% ↑ 1.649,2 1.581,6 4,3% ↑
Número de unidades 10.878 10.416 4,4% ↑ 10.963,0 (0,8%) ↓ 10.878 10.963,0 (0,8%) ↓
Preço médio por unidade (R$ mil) 151,6 149,7 1,3% ↑ 144,3 5,1% ↑ 151,6 144,3 5,1% ↑
Status de Obra - VGV (R$ milhões) 4T20
Não
Iniciadas
Até 30%
Concluído
30% a
70%
Concluído
Mais de
70%
Concluído
Concluído
On-site 1.649,2 747,7 447,9 385,2 29,6 38,8
Ainda não constam valores para operação off-site
BANCO DE TERRENOS
A companhia finalizou 2020 com um VGV de R$ 10,97 bilhões (+3,3% a/a e +1,6% t/t ) em seu banco de
terreno, sustentando o mesmo patamar de 2019.
Em função da pandemia passamos boa parte do ano renegociando terrenos que já adquiridos. Nossa
avaliação é que o desempenho na compra de terreno foi saudável em 2020 mas abaixo das nossas
expectativas. O projeto off-site encerrou 2020 com dois projetos pilotos em andamento.
Banco de Terrenos¹ 4T20 3T20 T/T (%) 4T19 A/A (%) 2020 2019 A/A (%)
On-site
Número de Empreendimentos 291 291 0,0% ↑ 292 (0,3%) ↓ 291 292 (0,3%) ↓
VGV (em R$ milhões) 10.974,5 10.802,8 1,6% ↑ 10.619,4 3,3% ↑ 10.974,5 10.619,4 3,3% ↑
Aquisições/Ajustes (em R$ milhões) 1.057,0 1.096,5 (3,6%) ↓ 1.585,5 (33,3%) ↓ 3.020,4 4.300,9 (29,8%) ↓
Número de unidades 73.339 73.266 0,1% ↑ 72.159 1,6% ↑ 73.339 72.159 1,6% ↑
Preço médio por unidade (em R$ mil) 149,6 147,4 1,5% ↑ 147,2 1,7% ↑ 149,6 147,2 1,7% ↑
% Permuta Total 38,5% 37,9% 0,6 p.p. ↑ 34,6% 3,9 p.p. ↑ 38,5% 34,6% 3,9 p.p. ↑
% Permuta Unidades 8,6% 8,8% (0,2 p.p.) ↓ 8,4% 0,2 p.p. ↑ 8,6% 8,4% 0,2 p.p. ↑
% Permuta Financeiro 30,0% 29,2% 0,8 p.p. ↑ 26,2% 3,8 p.p. ↑ 30,0% 26,2% 3,8 p.p. ↑
1. Tenda detém 100% de participação societária de seu Banco de Terrenos.
Ainda não constam valores para operação off-site
14
RESULTADOS FINANCEIROS
RECEITA OPERACIONAL LÍQUIDA
A receita operacional líquida totalizou R$ 685,9 milhões no 4T20 (+ 26,3% a/a e 4,8% t/t) finalizando o
ano em R$ 2,28 bilhões. Nesse ano reclassificamos R$ 46,8 milhões entre as provisões de distrato e
créditos de liquidação duvidosa (“PCLD”), desconsiderando esse efeito a provisão de distrato registrou
uma constituição de R$ 30,2 milhões (-1,3% a/a) e a PCLD contabilizou uma constituição de R$ 9,3
milhões frente uma reversão de R$ 12 milhões no ano passado.
(R$ milhões) 4T20 3T20 T/T (%) 4T19 A/A (%) 2020 2019 A/A (%)
On-site
Receita Operacional Bruta 706,8 651,7 8,4% ↑ 566,5 24,8% ↑ 2.358,9 2.005,3 17,6% ↑
Provisão para perdas estimadas em
créditos de liquidação duvidosa
(13,0) (31,9) 59,3% ↑ 4,0 (423,4%) ↓ (56,2) 12,3 (558,0%) ↓
Provisão para distratos (0,7) 47,3 (101,4%) ↓ (18,5) 96,3% ↑ 16,5 (30,6) 154,0% ↑
Imposto sobre vendas de imóveis e
serviços
(7,2) (12,5) (42,7%) ↓ (8,9) (19,0%) ↓ (36,9) (36,9) 0,1% ↑
Receita Operacional Líquida 685,9 654,5 4,8% ↑ 543,1 26,3% ↑ 2.282,4 1.950,1 17,0% ↑
Ainda não constam valores para operação off-site
LUCRO BRUTO
Nesse trimestre o lucro bruto ajustado contabilizou R$ 216,4 milhões (+19,1% a/a e +0,1% t/t), a
margem bruta ajustada atingiu 31,5% (-1,9 p.p. a/a e -1,5 p.p) sofrendo um impacto não recorrente de
R$ 11 milhões com destaque para obra de reforço de fundação realizada em um projeto de São Paulo. A
margem bruta ajustada sem esse efeito teria ficado em 33,2% no 4T20, mantendo-se estável em relação
ao trimestre passado.
A margem bruta ajustada do ano também foi impactada negativamente pelos efeitos da pandemia
registrando 32,2% (-2,8 p.p. a/a), com destaque para perda de produtividade de algumas obras
paralisadas no primeiro semestre e normalizadas no 3T20.
(R$ milhões) 4T20 3T20 T/T (%) 4T19 A/A (%) 2020 2019 A/A (%)
On-site
Receita Líquida 685,9 654,5 4,8% ↑ 543,1 26,3% ↑ 2.282,4 1.950,1 17,0% ↑
Lucro Bruto 209,5 211,3 (0,8%) ↓ 173,1 21,0% ↑ 710,4 648,1 9,6% ↑
Margem Bruta 30,5% 32,3% (1,7 p.p.) ↓ 31,9% (1,3 p.p.) ↓ 31,1% 33,2% (2,1 p.p.) ↓
(-) Custos Financeiros 6,9 5,0 38,6% ↑ 8,6 (19,6%) ↓ 24,2 33,6 (28,0%) ↓
Lucro Bruto Ajustado¹ 216,4 216,3 0,1% ↑ 181,7 19,1% ↑ 734,6 681,7 7,8% ↑
Margem Bruta Ajustada 31,5% 33,0% (1,5 p.p.) ↓ 33,4% (1,9 p.p.) ↓ 32,2% 35,0% (2,8 p.p.) ↓
1. Ajustado por juros capitalizados.
Ainda não constam valores para operação off-site
15
DESPESAS COM VENDAS, GERAIS E ADMINISTRATIVAS (SG&A)
Despesas com vendas
No 4T20 as despesas com vendas totalizaram R$ 52,1 milhões (+14,7% a/a e -6,3% t/t), representando
6,1% das vendas brutas. O indicador manteve-se resiliente aos patamares históricos com recorde de
vendas impulsionado pela boa performance das vendas online. Em 2020 as despesas com vendas
contabilizaram R$ 200,6 milhões sendo 6,9% das vendas brutas, redução -0,4p.p. frente aos 7,3% de
2019.
Despesas gerais e administrativas (G&A)
Nesse trimestre, as despesas gerais e administrativas (G&A) do modelo on-site totalizaram R$ 36,1
milhões (+37,4% a/a e -10,1% t/t) e do modelo off-site R$ 2,1 milhões. No consolidado encerramos o
4T20 com R$ 38,3 milhões (+45,6% a/a e -16,5% t/t) finalizando o ano em R$ 154,4 milhões (+31,9%
a/a) que representa uma relação de 5,8% dos lançamentos (+1,2p.p. a/a).
(R$ milhões) 4T20 3T20 T/T (%) 4T19 A/A (%) 2020 2019 A/A (%)
On-site
Despesas com Vendas (52,1) (55,6) (6,3%) ↓ (45,5) 14,7% ↑ (200,6) (162,5) 23,4% ↑
Despesas Gerais e Administrativas (G&A) (36,1) (40,2) (10,1%) ↓ (26,3) 37,4% ↑ (146,4) (117,1) 25,0% ↑
Total de Despesas SG&A (88,3) (95,8) (7,9%) ↓ (71,7) 23,0% ↑ (347,0) (279,6) 24,1% ↑
Vendas Brutas 854,7 836,1 2,2% ↑ 669,4 27,7% ↑ 2.921,0 2.239,4 30,4% ↑
Lançamentos 885,2 984,2 (10,1%) ↓ 835,8 5,9% ↑ 2.665,2 2.575,1 3,5% ↑
Receita Operacional Líquida 685,9 654,5 4,8% ↑ 543,1 26,3% ↑ 2.282,4 1.950,1 17,0% ↑
Despesas com Vendas / Vendas Brutas 6,1% 6,7% (0,6 p.p.) ↓ 6,8% (0,7 p.p.) ↓ 6,9% 7,3% (0,4 p.p.) ↓
G&A / Lançamentos 4,1% 4,1% (0,0 p.p.) ↓ 3,1% 0,9 p.p. ↑ 5,5% 4,5% 0,9 p.p. ↑
G&A / Receita Operacional Líquida 5,3% 6,1% (0,9 p.p.) ↓ 4,8% 0,4 p.p. ↑ 6,4% 6,0% 0,4 p.p. ↑
Off-site
Despesas com Vendas (0,0) 0,0 0,0% ↑ 0,0 0,0% ↑ (0,0) 0,0 0,0% ↑
Despesas Gerais e Administrativas (G&A) (2,1) (5,7) (62,3%) ↓ (0,0) 0,0% ↑ (8,0) (0,0) 0,0% ↑
Total de Despesas SG&A (2,1) (5,7) (62,2%) ↓ (0,0) 0,0% ↑ (8,0) (0,0) 0,0% ↑
Consolidado
Despesas com Vendas (52,1) (55,6) (6,3%) ↓ (45,5) 14,7% ↑ (200,6) (162,5) 23,4% ↑
Despesas Gerais e Administrativas (G&A) (38,3) (45,8) (16,5%) ↓ (26,3) 45,6% ↑ (154,4) (117,1) 31,9% ↑
Total de Despesas SG&A (90,4) (101,5) (10,9%) ↓ (71,8) 26,0% ↑ (355,0) (279,6) 27,0% ↑
Vendas Brutas 854,7 836,1 2,2% ↑ 669,4 27,7% ↑ 2.921,0 2.239,4 30,4% ↑
Lançamentos 885,2 984,2 (10,1%) ↓ 835,8 5,9% ↑ 2.665,2 2.575,1 3,5% ↑
Receita Operacional Líquida 685,9 654,5 4,8% ↑ 543,1 26,3% ↑ 2.282,4 1.950,1 17,0% ↑
Despesas com Vendas / Vendas Brutas 6,1% 6,7% (0,6 p.p.) ↓ 6,8% (0,7 p.p.) ↓ 6,9% 7,3% (0,4 p.p.) ↓
G&A / Lançamentos 4,3% 4,7% (0,3 p.p.) ↓ 3,1% 1,2 p.p. ↑ 5,8% 4,5% 1,2 p.p. ↑
G&A / Receita Operacional Líquida 5,6% 7,0% (1,4 p.p.) ↓ 4,8% 0,7 p.p. ↑ 6,8% 6,0% 0,8 p.p. ↑
16
OUTRAS RECEITAS E DESPESAS OPERACIONAIS
Nesse trimestre essa rubrica contabilizou R$ 21,4 milhões (+19,2% a/a e +41,4% t/t). Aceleramos
acordos judiciais de causas não julgadas mas com grande probabilidade de perda que reduziu em R$ 69
milhões (21% t/t) o risco de perda possível da Companhia conforme nota explicativa 17.3. No ano as
outras receitas e despesas operacionais totalizaram R$ 67,8 milhões (+12% a/a).
(R$ milhões) 4T20 3T20 T/T (%) 4T19 A/A (%) 2020 2019 A/A (%)
On-site
Outras Receitas e Despesas
Operacionais
(21,0) (15,0) 39,5% ↑ (17,9) 16,8% ↑ (67,1) (60,5) 11,0% ↑
Despesas com demandas judiciais (22,5) (12,2) 85,3% ↑ (16,4) 37,6% ↑ (54,9) (39,8) 38,1% ↑
Outras 1,6 (2,9) (154,9%) ↓ (1,6) (200,5%) ↓ (12,2) (20,7) (41,1%) ↓
Equivalência Patrimonial (0,4) (0,1) 342,0% ↑ 5,0 107,7% ↑ (0,5) 3,2 114,8% ↑
Off-site
Outras Receitas e Despesas
Operacionais
(0,4) (0,1) 289,8% ↑ (0,0) 1.654,2% ↑ (0,6) (0,0) 2.422,8% ↑
Despesas com demandas judiciais 0,0 0,0 0,0% ↑ 0,0 0,0% ↑ 0,0 0,0 0,0% ↑
Outras (0,4) (0,1) 289,8% ↑ (0,0) 1.654,2% ↑ (0,6) (0,0) 2.422,8% ↑
Equivalência Patrimonial 0,0 0,0 0,0% ↑ 0,0 0,0% ↑ 0,0 0,0 0,0% ↑
Consolidado
Outras Receitas e Despesas
Operacionais
(21,4) (15,1) 41,4% ↑ (18,0) 19,2% ↑ (67,8) (60,5) 12,0% ↑
Despesas com demandas judiciais (22,5) (12,2) 85,3% ↑ (16,4) 37,6% ↑ (54,9) (39,8) 38,1% ↑
Outras 1,1 (3,0) (137,8%) ↓ (1,6) (170,9%) ↓ (12,8) (20,7) (38,1%) ↓
Equivalência Patrimonial (0,4) (0,1) 342,0% ↑ 5,0 107,7% ↑ (0,5) 3,2 114,8% ↑
EBITDA AJUSTADO
No 4T20, o EBITDA ajustado do modelo on-site totalizou R$ 112,8 milhões (+12,9% a/a e +1,3% t/t) e
encerrou 2020 em R$ 338,7 milhões (-4,2% a/a). No resultado consolidado, o EBITDA ajustado atingiu R$
110,2 milhões no trimestre (+10,3% a/a e +4,4% t/t) e R$ 330,0 milhões em 2020 (-6,6% a/a).
(R$ milhões) 4T20 3T20 T/T (%) 4T19 A/A (%) 2020 2019 A/A (%)
On-site
Lucro Líquido 74,7 76,3 (2,1%) ↓ 76,2 (2,0%) ↓ 209,2 263,5 (20,6%) ↓
(+) Resultado Financeiro 7,1 6,7 5,1% ↑ (4,0) 279,2% ↑ 23,1 (8,7) 364,4% ↑
(+) IR / CSLL 13,0 11,0 18,0% ↑ 10,4 24,6% ↑ 41,9 35,1 19,2% ↑
(+) Depreciação e Amortização 6,0 5,8 4,1% ↑ 5,7 5,0% ↑ 22,2 20,4 8,5% ↑
(+) Capitalização de Juros 6,9 5,0 38,6% ↑ 8,6 (19,6%) ↓ 24,2 33,6 (28,0%) ↓
(+) Despesas com SOP 6,0 6,0 (0,3%) ↓ 2,9 106,4% ↑ 18,7 8,7 116,5% ↑
(+) Participação dos Minoritários (0,9) 0,5 (285,0%) ↓ 0,1 (1.804%) ↓ (0,6) 0,9 (168,7%) ↓
EBITDA Ajustado¹ 112,8 111,4 1,3% ↑ 99,9 12,9% ↑ 338,7 353,5 (4,2%) ↓
Receita Líquida 685,9 654,5 4,8% ↑ 543,1 26,3% ↑ 2.282,4 1.950,1 17,0% ↑
Margem EBITDA Ajustada¹ 16,4% 17,0% (0,6 p.p.) ↓ 18,4% (2,0 p.p.) ↓ 14,8% 18,1% (3,3 p.p.) ↓
Off-site
Lucro Líquido (2,7) (5,8) 53,1% ↑ 0,0 0,0% ↑ (8,9) 0,0 (0,0% ↑
(+) Resultado Financeiro (0,0) (0,0) (120,1%) ↓ (0,1) 88,6% ↑ (0,0) (0,1) 37,0% ↑
(+) Depreciação e Amortização 0,2 0,0 236,1% ↑ 0,0 0,0% ↑ 0,3 0,0 0,0% ↑↑
EBITDA Ajustado¹ (2,6) (5,8) 55,3% ↑ (0,0) (0,0%) ↓ (8,6) (0,0) (0,0%) ↓
Receita Líquida 0,0 0,0 0,0% ↑ 0,0 0,0% ↑ 0,0 0,0 0,0% ↑
Margem EBITDA Ajustada¹ 0,0% 0,0% 0,0 p.p. 0,0% 0,0 p.p. 0,0% 0,0% 0,0 p.p.
Consolidado
Lucro Líquido 72,0 70,5 2,1% ↑ 76,2 (5,6%) ↓ 200,3 263,5 (24,0%) ↓
(+) Resultado Financeiro 7,1 6,7 5,0% ↑ (4,0) 276,2% ↑ 23,1 (8,8) 362,1% ↑
(+) IR / CSLL 13,0 11,0 18,0% ↑ 10,4 24,6% ↑ 41,9 35,1 19,2% ↑
(+) Depreciação e Amortização 6,2 5,8 5,9% ↑ 5,8 7,2% ↑ 22,5 20,5 9,7% ↑
(+) Capitalização de Juros 6,9 5,0 38,6% ↑ 8,6 (19,6%) ↓ 24,2 33,6 (28,0%) ↓
(+) Despesas com SOP 6,0 6,0 (0,3%) ↓ 2,9 106,4% ↑ 18,7 8,7 116,5% ↑
(+) Participação dos Minoritários (0,9) 0,5 (285,0%) ↓ 0,1 (1.804%) ↓ (0,6) 0,9 (168,7%) ↓
EBITDA Ajustado¹ 110,2 105,6 4,4% ↑ 99,9 10,3% ↑ 330,0 353,5 (6,6%) ↓
Receita Líquida 685,9 654,5 4,8% ↑ 543,1 26,3% ↑ 2.282,4 1.950,1 17,0% ↑
Margem EBITDA Ajustada¹ 16,1% 16,1% (0,1 p.p.) ↓ 18,4% (2,3 p.p.) ↓ 14,5% 18,1% (3,7 p.p.) ↓
1. Ajustado por juros capitalizados, despesas com planos de ações (não caixa) e minoritários
17
RESULTADO FINANCEIRO
A companhia finalizou esse trimestre com um resultado financeiro negativo de R$ 7,1 milhões e R$ 23,1
milhões negativos no acumulado do ano. Posição de caixa líquido menor e queda da Selic reduziram a
rentabilidade das aplicações (benchmark 100% CDI) que não conseguiram fazer frente ao custo de dívida,
que aumentou com a captação de dívidas adicionais em meio à pandemia.
(R$ milhões) 4T20 3T20 T/T (%) 4T19 A/A (%) 2020 2019 A/A (%)
Consolidado
Receitas Financeiras 7,0 6,1 15,6% ↑ 16,7 (58,2%) ↓ 32,6 61,2 (46,8%) ↓
Despesas Financeiras (14,1) (12,8) 10,0% ↑ (12,7) 10,6% ↑ (55,6) (52,4) 6,1% ↑
Resultado Financeiro (7,1) (6,7) (5,0%) ↓ 4,0 (276,2%) ↓ (23,1) 8,8 (362,1%) ↓
LUCRO LÍQUIDO
No 4T20, o modelo on-site registrou lucro líquido de R$ 74,7 milhões (-2,0% a/a e -2,1% t/t) encerrando
2020 em R$ 209,2 milhões (-20,6% a/a). No consolidado o lucro líquido do trimestre totalizou R$ 72,0
milhões (-5,6% a/a e +2,1% t/t) sendo R$ 200,3 milhões (-24,0% a/a) em 2020.
O lucro por ação desconsiderando as em tesouraria contabilizou R$ 2,04 (-25,1% a/a) em 2020.
(R$ milhões) 4T20 3T20 T/T (%) 4T19 A/A (%) 2020 2019 A/A (%)
On-site
Resultado Líquido após IR & CSLL 73,8 76,8 (3,9%) ↓ 76,2 (3,2%) ↓ 208,6 264,4 (21,1%) ↓
(-) Participação Minoritários 0,9 (0,5) 285,0% ↑ (0,1) 1.803,8% ↑ 0,6 (0,9) 168,7% ↑
Lucro Líquido 74,7 76,3 (2,1%) ↓ 76,2 (2,0%) ↓ 209,2 263,5 (20,6%) ↓
Margem Líquida 10,9% 11,7% (0,8 p.p.) ↓ 14,0% (3,1 p.p.) ↓ 9,2% 13,5% (4,3 p.p.) ↓
Off-site
Resultado Líquido após IR & CSLL (2,7) (5,8) 53,1% ↑ 0,0 (0,0%) ↓ (8,9) 0,0 (0,0%) ↓
(-) Participação Minoritários 0,0 0,0 0,0% ↑ 0,0 0,0% ↑ 0,0 0,0 0,0% ↑
Lucro Líquido (2,7) (5,8) 53,1% ↑ 0,0 (0,0%) ↓ (8,9) 0,0 (0,0%) ↓
Margem Líquida 0,0% 0,0% 0,0 p.p. 0,0% 0,0 p.p. 0,0% 0,0% 0,0 p.p.
Consolidado
Resultado Líquido após IR & CSLL 71,0 71,0 0,1% ↑ 76,2 (6,8%) ↓ 199,7 264,4 (24,5%) ↓
(-) Participação Minoritários 0,9 (0,5) 285,0% ↑ (0,1) 1.803,8% ↑ 0,6 (0,9) 168,7% ↑
Lucro Líquido 72,0 70,5 2,1% ↑ 76,2 (5,6%) ↓ 200,3 263,5 (24,0%) ↓
Margem Líquida 10,5% 10,8% (0,3 p.p.) ↓ 14,0% (3,5 p.p.) ↓ 8,8% 13,5% (4,7 p.p.) ↓
Lucro por Ação¹ (12 meses)
(R$/ação)
1,92 1,96 (2,1%) ↓ 2,53 (24,0%) ↓ 1,92 2,53 (24,0%) ↓
Lucro por Ação² (12 meses)
(R$/ação) (ex-tesouraria)
2,04 2,09 (2,5%) ↓ 2,73 (25,1%) ↓ 2,04 2,73 (25,1%) ↓
1. Lucro por ação considera todas as ações emitidas (ajustadas em casos de desdobramento de ações).
2. Lucro por ação (ex-Tesouraria) considera ações emitidas (ajustadas em casos de desdobramento de ações) e desconsidera as mantidas em Tesouraria.
ROE (%, 12 meses) e ROIC (%, 12 meses) Consolidado
2,8%
5,3%
9,7%
17,0%
20,7%
14,0%
3,6%
9,4%
13,4%
23,8%
28,3%
19,6%
1T15
2T15
3T15
4T15
1T16
2T16
3T16
4T16
1T17
2T17
3T17
4T17
1T18
2T18
3T18
4T18
1T19
2T19
3T19
4T19
1T20
2T20
3T20
4T20
ROE (12 meses) ROIC (12 meses)
18
RESULTADO A APROPRIAR
Encerramos 2020 com uma margem REF de 35,2%, queda -4,0 p.p. a/a e -1,1 p.p. t/t. Além da perda de
produtividade nas obras que sofreram paralizações no primeiro semestre por conta da pandemia, o setor
também vem sofrendo pressões com aumento nos custos de materiais refletidos nas novas safras de
obras.
(R$ milhões) Dezembro 20 Setembro 20 T/T (%) Dezembro 19 A/A (%)
On-site
Receitas a Apropriar 949,5 745,3 27,4% ↑ 555,2 71,0% ↑
Custo das Unidades Vendidas a
Apropriar
(615,6) (474,9) 29,6% ↑ (337,6) 82,3% ↑
Resultado a Apropriar¹ 333,9 270,4 23,5% ↑ 217,7 53,4% ↑
Margem a Apropriar 35,2% 36,3% (1,1 p.p.) ↓ 39,2% (4,0 p.p.) ↓
1. Contempla os empreendimentos que estão sob restrição por cláusula suspensiva.
Ainda não constam valores para operação off-site
CAIXA E APLICAÇÕES FINANCEIRAS
(R$ milhões) Dezembro 20 Setembro 20 T/T (%) Dezembro 19 A/A (%)
Consolidado
Caixa e equivalentes de caixa 69,7 25,1 177,5% ↑ 48,4 44,2% ↑
Aplicações financeiras 1.235,7 1.377,7 (10,3%) ↓ 1.022,1 20,9% ↑
Caixa Total 1.305,5 1.402,8 (6,9%) ↓ 1.070,5 22,0% ↑
CONTAS A RECEBER
A Companhia totalizou R$ 911,8 milhões em contas a receber ao final de 2020, alta de 45,9% a/a e 14,3%
t/t em função do recorde de vendas.
(R$ milhões) Dezembro 20 Setembro 20 T/T (%) Dezembro 19 A/A (%)
On-site
Até 2020¹ 84,8 748,3 (88,7%) ↓ 530,4 (84,0%) ↓
2021 622,5 110,6 462,7% ↑ 155,6 300,0% ↑
2022 300,5 55,4 442,3% ↑ 61,9 385,4% ↑
2023 42,9 33,5 28,3% ↑ 22,5 90,9% ↑
2024 32,4 44,4 (27,0%) ↓ 26,0 24,6% ↑
2025 em diante 37,3 0,0 0,0% ↑ 0,0 0,0% ↑
Contas a Receber Total 1.120,6 992,3 12,9% ↑ 796,5 40,7% ↑
(-) Ajuste a valor presente (5,2) (4,5) (15,5%) ↓ (7,4) 29,9% ↑
(-) Provisão para créditos de liquidação duvidosa (174,4) (161,4) (8,1%) ↓ (118,2) (47,5%) ↓
(-) Provisão para distrato (29,2) (28,5) (2,4%) ↓ (45,7) 36,2% ↑
Contas a Receber 911,8 797,9 14,3% ↑ 625,1 45,9% ↑
Dias de Contas a Receber 146 136 7,1% ↑ 117 24,6% ↑
1. Vencidos e a vencer.
Ainda não constam valores para operação off-site
19
RECEBÍVEIS TENDA
A carteira de Recebíveis Tenda (on e off balance, risco Tenda) líquida de provisão cresceu 17,1% t/t e
54,3% a/a, reflexo da boa performance nas vendas.
Diversas iniciativas na atividade de Cobrança levaram a uma melhora dos indicadores de adimplência que
permitiu uma redução no índice de cobertura de provisão da carteira pós-chaves, que passou de 24,7%
no 3T20 para 22,9% no 4T20.
Recebíveis Tenda¹ (R$ milhões) 4T20 3T20 T/T (%) 4T19 A/A (%)
Carteira Bruta 560,2 489,3 14,5% ↑ 389,3 43,9% ↑
Antes da entrega de chaves (pré-chaves) 86,2 70,8 21,7% ↑ 62,7 37,4% ↑
Após a entrega de chaves (pós-chaves) 474,0 418,5 13,3% ↑ 326,6 45,1% ↑
Carteira Líquida de Provisão 451,0 385,1 17,1% ↑ 292,3 54,3% ↑
Antes da entrega de chaves (pré-chaves) 85,4 70,2 21,7% ↑ 62,2 37,2% ↑
Após a entrega de chaves (pós-chaves) 365,6 314,9 16,1% ↑ 230,0 59,0% ↑
Recebíveis Tenda¹ (por aging, pós-chaves) 4T20 3T20 T/T (%) 4T19 A/A (%)
Carteira Líquida de Provisão (R$ milhões) 365,6 314,9 16,1% ↑ 230,0 59,0% ↑
Não entregue² 175,6 133,6 31,4% ↑ 65,2 169,3% ↑
Entregue, adimplente 133,9 133,5 0,3% ↑ 123,5 8,4% ↑
Entregue, inadimplente <90d 40,6 34,0 19,3% ↑ 30,6 32,6% ↑
Entregue, inadimplente >90d 15,6 13,9 12,3% ↑ 10,7 45,3% ↑
Índice de Cobertura de Provisão (%) 22,9% 24,7% (1,9 p.p.) ↓ 29,6% (6,7 p.p.) ↓
Não entregue² 11,7% 13,4% (1,7 p.p.) ↓ 17,8% (6,1 p.p.) ↓
Entregue, adimplente 0,9% 1,0% (0,1 p.p.) ↓ 1,6% (0,7 p.p.) ↓
Entregue, inadimplente <90d 9,6% 10,1% (0,5 p.p.) ↓ 16,8% (7,2 p.p.) ↓
Entregue, inadimplente >90d 83,6% 84,9% (1,2 p.p.) ↓ 87,4% (3,8 p.p.) ↓
1. Valores a receber, on e off balance, parcelados diretamente com a Companhia, uma vez que os financiamentos bancários não absorvem 100% do valor do imóvel.
2. Empreendimentos não entregues têm fluxos de financiamento pré-chaves e pós-chaves. O índice de cobertura de provisão diz respeito apenas ao fluxo pós-chaves.
20
ENDIVIDAMENTO
Encerramos o ano com uma dívida total de R$ 1,157 bilhão, em linha com o trimestre anterior. São 16,5
meses de duration com custo médio nominal de 4,0% a.a.
Cronograma de Vencimento da Dívida (R$ milhões) 4T20
Financiamento
Bancário
Dívida
Corporativa
Financiamento
a Construção
(SFH)
Consolidado
2021 599,7 175,6 424,1 0,0
2022 218,4 118,9 99,5 0,0
2023 210,3 35,8 174,5 0,0
2024 128,7 4,2 124,6 0,0
2025 em diante 0,0 0,0 0,0 0,0
Dívida Total 1.157,1 334,5 822,6 0,0
Duration (em meses) 16,5
Detalhamento da dívida (R$ milhões) Vencimento Taxas (a.a.)
Saldo Devedor
Dezembro 20
Saldo Devedor
Setembro 20
Consolidado
Dívida Total 1.157,1 1.152,9
Financiamento Bancário até 03/2024 CDI + 3,15% 334,5 334,3
Dívida Corporativa 822,6 818,5
CRI Tenda até 01/2021 CDI + 0,90% 321,2 318,1
DEB TEND14 até 09/2023 CDI + 1,75% 151,7 150,3
DEB TEND15 até 03/2024 CDI + 1,40% 150,9 149,7
DEB TEND16 até 12/2024 CDI + 1,30% 198,8 200,5
Custo Médio Ponderado da Dívida (R$ milhões)
Saldo Devedor
Dezembro 20
Saldo Devedor /
Total Dívida
Custo Médio (a.a.)
Consolidado
CDI 1.157,1 100,0% CDI + 1,8%
TR 0,0 0,0% TR + 8,3%
Total 1.157,1 100% 4,0%
RATING
A Standard & Poor’s (“S&P”) mantém o rating de crédito corporativo da Tenda em brAA+ com
perspectiva positiva.
21
DÍVIDA LÍQUIDA
A relação dívida líquida sobre patrimônio líquido fechou o ano negativa em 9,8%, dentro do limite de
-10% a +10% estipulado pela companhia.
(R$ milhões) Dezembro 20 Setembro 20 T/T (%) Dezembro 19 A/A (%)
Consolidado
Dívida Bruta 1.157,1 1.152,1 0,4% ↑ 870,4 32,9% ↑
(-) Caixa e equivalentes de caixa e
Aplicações financeiras
(1.305,5) (1.402,8) (6,9%) ↓ (1.070,5) 22,0% ↑
Dívida Líquida (148,3) (250,7) 40,8% ↑ (200,0) 25,8% ↑
Patrimônio Líquido + Minoritários 1.518,1 1.480,5 2,5% ↑ 1.351,7 12,3% ↑
Dívida Líquida / (Patrimônio Líquido
+ Minoritários)
(9,8%) (16,9%) 7,2 p.p. ↑ (14,8%) 5,0 p.p. ↑
EBITDA Ajustado (12 meses) 330,0 319,8 3,2% ↑ 353,5 (6,6%) ↓
GERAÇÃO DE CAIXA E DISTRIBUIÇÃO DE CAPITAL
Em 2020, a Tenda totalizou uma geração de caixa operacional de R$ 70 milhões. A Companhia acelerou a
atividade de algumas obras para combater reajustes nos custos de materiais consumindo R$ 54,3
milhões nesse trimestre.
No 4T20, abrimos um novo plano de recompra de ações que totalizou R$ 5,3 milhões. Ao longo de 2020,
a Tenda distribuiu para seus acionistas R$ 53,9 milhões entre dividendos pagos e recompra de ações, o
equivalente a um payout de 26,9%.
(R$ milhões) 4T20 3T20 T/T (%) 4T19 A/A (%)
Consolidado
Recompra de ações 5,3 0,0 0,0% ↑ (0,3) 2.065,4% ↑
Dividendos pagos 30,5 18,1 68,5% ↑ 15,4 98,4% ↑
Distribuição de Capital 35,8 18,1 97,7% ↑ 15,1 137,0% ↑
(R$ milhões, últimos 12 meses) 4T20 3T20 T/T (%) 4T19 A/A (%)
Consolidado
Recompra de ações 5,3 (0,3) 2.065,4% ↑ 62,2 (91,5%) ↓
Dividendos pagos 48,6 33,5 45,2% ↑ 57,8 (15,9%) ↓
Distribuição de Capital 53,9 33,2 62,3% ↑ 120,0 (55,1%) ↓
(R$ milhões) Dezembro 20 Setembro 20 T/T (%) Dezembro 19 A/A (%)
Consolidado
Variação do Caixa Disponível (97,4) (132,1) 26,3% ↑ 94,1 (203,4%) ↓
(-) Variação da Dívida Bruta 5,0 (195,1) 102,5% ↑ 125,6 (96,0%) ↓
(+) Distribuição de Capital 35,8 18,1 97,7% ↑ 15,1 137,0% ↑
Geração de Caixa¹ (66,6) 81,1 (182,1%) ↓ (16,4) (305,9%) ↓
Geração de Caixa Operacional² (54,3) 111,5 (148,7%) ↓ (12,5) (332,5%) ↓
On-site (44,7) 119,3 (137,4%) ↓ (11,3) (296,8%) ↓
Off-site (9,6) (7,8) (23,3%) ↓ (1,3) (645,5%) ↓
(R$ milhões) 2020 2019 T/T (%)
Consolidado
Variação do Caixa Disponível 235,0 214,9 9,4% ↑
(-) Variação da Dívida Bruta 286,7 327,9 (12,6%) ↓
(+) Distribuição de Capital 53,9 120,0 (55,1%) ↓
Geração de Caixa¹ 2,2 6,9 (68,4%) ↓
Geração de Caixa Operacional² 70,0 21,6 223,9% ↑
On-site 97,7 24,5 299,6% ↑
Off-site (27,7) (2,8) (874,8%) ↓
1. A Geração de Caixa: Diferença entre a variação do Caixa Disponível e a variação da Dívida Bruta, ajustada a valores de Recompra, Dividendos, Redução de Capital e efeitos não
operacionais.
2. A Geração de Caixa Operacional: Gerencial interno da companhia que não reflete ou compara-se aos números presentes nas demonstrações financeiras
22
DEMONSTRATIVO DE RESULTADOS
(R$ milhões) 4T20 3T20 T/T (%) 4T19 A/A (%) 2020 2019 A/A (%)
On-site
Receita Líquida 685,9 654,5 4,8% ↑ 543,1 26,3% ↑ 2.282,4 1.950,1 17,0% ↑
Custos Operacionais (476,4) (443,2) 7,5% ↑ (370,1) 28,7% ↑ (1.572,0) (1.302,0) 20,7% ↑
Lucro Bruto 209,5 211,3 (0,8%) ↓ 173,1 21,0% ↑ 710,4 648,1 9,6% ↑
Margem Bruta 30,5% 32,3% (1,7 p.p.) ↓ 31,9% (1,3 p.p.) ↓ 31,1% 33,2% (2,1 p.p.) ↓
Despesas Operacionais (115,6) (116,7) (0,9%) ↓ (90,4) 27,9% ↑ (436,8) (357,3) 22,3% ↑
Despesas com Vendas (52,1) (55,6) (6,3%) ↓ (45,5) 14,7% ↑ (200,6) (162,5) 23,4% ↑
Desp. Gerais e Administrativas (36,1) (40,2) (10,1%) ↓ (26,3) 37,4% ↑ (146,4) (117,1) 25,0% ↑
Outras Desp. e Rec. Operacionais (21,0) (15,0) 39,5% ↑ (17,9) 16,8% ↑ (67,1) (60,5) 11,0% ↑
Depreciação e Amortização (6,0) (5,8) 4,1% ↑ (5,7) 5,0% ↑ (22,2) (20,4) 8,5% ↑
Equivalência Patrimonial (0,4) (0,1) (342,0%) ↓ 5,0 (107,7%) ↓ (0,5) 3,2 (114,8%) ↓
Lucro Operacional 93,8 94,6 (0,7%) ↓ 82,7 13,5% ↑ 273,6 290,8 (5,9%) ↓
Receita Financeira 7,0 6,0 15,5% ↑ 16,7 (58,3%) ↓ 32,5 61,2 (46,9%) ↓
Despesa Financeira (14,1) (12,8) 10,0% ↑ (12,8) 10,1% ↑ (55,6) (52,5) 6,0% ↑
Lucro Líquido antes de IR & CSLL 86,8 87,8 (1,2%) ↓ 86,6 0,1% ↑ 250,4 299,5 (16,4%) ↓
Impostos Diferidos (2,4) 0,6 (496,9%) ↓ (0,6) (308,2%) ↓ (4,6) (3,9) (19,7%) ↓
IR & CSLL (10,5) (11,6) (9,2%) ↓ (9,8) 7,4% ↑ (37,2) (31,3) 19,1% ↑
Lucro Líquido após IR & CSLL 73,8 76,8 (3,9%) ↓ 76,2 (3,2%) ↓ 208,6 264,4 (21,1%) ↓
(-) Participações Minoritárias 0,9 (0,5) 285,0% ↑ (0,1) 1.803,8% ↑ 0,6 (0,9) 168,7% ↑
Lucro Líquido 74,7 76,3 (2,1%) ↓ 76,2 (2,0%) ↓ 209,2 263,5 (20,6%) ↓
Off-site
Receita Líquida 0,0 0,0 0,0% ↑ 0,0 0,0% ↑ 0,0 0,0 0,0% ↑
Custos Operacionais 0,0 0,0 0,0% ↑ 0,0 0,0% ↑ 0,0 0,0 0,0% ↑
Lucro Bruto 0,0 0,0 0,0% ↑ 0,0 0,0% ↑ 0,0 0,0 0,0% ↑
Margem Bruta 0,0% 0,0% 0,0 p.p. 0,0% 0,0 p.p. 0,0% 0,0% 0,0 p.p.
Despesas Operacionais (2,7) (5,8) (53,0%) ↓ (0,1) 0,0% ↑ (8,9) (0,1) 0,0% ↑
Despesas com Vendas (0,0) 0,0 0,0% ↑ 0,0 0,0% ↑ (0,0) 0,0 0,0% ↑
Desp. Gerais e Administrativas (2,1) (5,7) (62,3%) ↓ (0,0) 0,0% ↑ (8,0) (0,0) 0,0% ↑
Outras Desp. e Rec. Operacionais (0,4) (0,1) 289,8% ↑ (0,0) 0,0% ↑ (0,6) (0,0) 0,0% ↑
Depreciação e Amortização (0,2) (0,0) 236,1% ↑ (0,0) 0,0% ↑ (0,3) (0,0) 0,0% ↑
Equivalência Patrimonial 0,0 0,0 0,0% ↑ 0,0 0,0% ↑ 0,0 0,0 0,0% ↑
Lucro Operacional (2,7) (5,8) 53,0% ↑ (0,1) 0,0% ↑ (8,9) (0,1) 0,0% ↑
Receita Financeira 0,0 0,0 63,6% ↑ 0,0 0,0% ↑ 0,0 0,0 0,0% ↑
Despesa Financeira (0,0) (0,0) 6,7% ↑ 0,1 105,7% ↑ (0,0) 0,1 0,0% ↑
Lucro Líquido antes de IR & CSLL (2,7) (5,8) 53,1% ↑ 0,0 0,0% ↑ (8,9) 0,0 0,0% ↑
Impostos Diferidos 0,0 0,0 0,0% ↑ 0,0 0,0% ↑ 0,0 0,0 0,0% ↑
IR & CSLL 0,0 0,0 0,0% ↑ 0,0 0,0% ↑ 0,0 0,0 0,0% ↑
Lucro Líquido após IR & CSLL (2,7) (5,8) 53,1% ↑ 0,0 0,0% ↑ (8,9) 0,0 0,0% ↑
(-) Participações Minoritárias 0,0 0,0 0,0% ↑ 0,0 0,0% ↑ 0,0 0,0 0,0% ↑
Lucro Líquido (2,7) (5,8) 53,1% ↑ 0,0 0,0% ↑ (8,9) 0,0 0,0% ↑
Consolidado
Receita Líquida 685,9 654,5 4,8% ↑ 543,1 26,3% ↑ 2.282,4 1.950,1 17,0% ↑
Custos Operacionais (476,4) (443,2) 7,5% ↑ (370,1) 28,7% ↑ (1.572,0) (1.302,0) 20,7% ↑
Lucro Bruto 209,5 211,3 (0,8%) ↓ 173,1 21,0% ↑ 710,4 648,1 9,6% ↑
Margem Bruta 30,5% 32,3% (1,7 p.p.) ↓ 31,9% (1,3 p.p.) ↓ 31,1% 33,2% (2,1 p.p.) ↓
Despesas Operacionais (118,4) (122,6) (3,4%) ↓ (90,4) 30,9% ↑ (445,7) (357,3) 24,7% ↑
Despesas com Vendas (52,1) (55,6) (6,3%) ↓ (45,5) 14,7% ↑ (200,6) (162,5) 23,4% ↑
Desp. Gerais e Administrativas (38,3) (45,8) (16,5%) ↓ (26,3) 45,6% ↑ (154,4) (117,1) 31,9% ↑
Outras Desp. e Rec. Operacionais (21,4) (15,1) 41,4% ↑ (18,0) 19,2% ↑ (67,8) (60,5) 12,0% ↑
Depreciação e Amortização (6,2) (5,8) 5,9% ↑ (5,8) 7,2% ↑ (22,5) (20,5) 9,7% ↑
Equivalência Patrimonial (0,4) (0,1) (342,0%) ↓ 5,0 (107,7%) ↓ (0,5) 3,2 (114,8%) ↓
Lucro Operacional 91,1 88,7 2,7% ↑ 82,6 10,2% ↑ 264,6 290,7 (9,0%) ↓
Receita Financeira 7,0 6,1 15,6% ↑ 16,7 (58,2%) ↓ 32,6 61,2 (46,8%) ↓
Despesa Financeira (14,1) (12,8) 10,0% ↑ (12,7) 10,6% ↑ (55,6) (52,4) 6,1% ↑
Lucro Líquido antes de IR & CSLL 84,0 82,0 2,5% ↑ 86,7 (3,0%) ↓ 241,6 299,5 (19,3%) ↓
Impostos Diferidos (2,4) 0,6 (496,9%) ↓ (0,6) (308,2%) ↓ (4,6) (3,9) (19,7%) ↓
IR & CSLL (10,5) (11,6) (9,2%) ↓ (9,8) 7,4% ↑ (37,2) (31,3) 19,1% ↑
Lucro Líquido após IR & CSLL 71,0 71,0 0,1% ↑ 76,2 (6,8%) ↓ 199,7 264,4 (24,5%) ↓
(-) Participações Minoritárias 0,9 (0,5) 285,0% ↑ (0,1) 1.803,8% ↑ 0,6 (0,9) 168,7% ↑
Lucro Líquido 72,0 70,5 2,1% ↑ 76,2 (5,6%) ↓ 200,3 263,5 (24,0%) ↓
23
BALANÇO PATRIMONIAL
(R$ milhões) Dezembro 20 Setembro 20 T/T (%) Dezembro 19 A/A (%)
Consolidado
Ativo Circulante 2.758,9 3.053,2 (9,6%) ↓ 2.506,4 10,1% ↑
Caixa e Equivalentes de Caixa 69,7 25,1 177,5% ↑ 48,4 44,2% ↑
Títulos e Valores Imobiliários 1.235,7 1.377,7 (10,3%) ↓ 1.022,1 20,9% ↑
Recebíveis de Clientes 563,0 539,9 4,3% ↑ 406,6 38,5% ↑
Imóveis a Comercializar 777,7 1.015,5 (23,4%) ↓ 955,6 (18,6%) ↓
Outros Contas a Receber 112,8 95,0 18,6% ↑ 73,7 52,9% ↑
Ativo Não-Circulante 1.292,6 906,6 42,6% ↑ 827,6 56,2% ↑
Recebíveis de Clientes 348,8 258,0 35,2% ↑ 218,5 59,6% ↑
Imóveis a Comercializar 875,2 580,9 50,7% ↑ 537,0 63,0% ↑
Outros 68,6 67,7 1,2% ↑ 72,1 (4,9%) ↓
Intangível e Imobilizado 143,2 107,1 33,8% ↑ 101,9 40,6% ↑
Investimentos 42,0 42,5 (1,2%) ↓ 42,6 (1,4%) ↓
Ativo Total 4.236,7 4.109,4 3,1% ↑ 3.478,5 21,8% ↑
Passivo Circulante 1.216,4 1.043,5 16,6% ↑ 579,0 110,1% ↑
Empréstimos e Financiamentos 175,6 108,4 62,0% ↑ 8,5 1.961,9% ↑
Debêntures 424,1 370,1 14,6% ↑ 5,6 7.475,0% ↑
Obrig. com Terrenos e Adiant. de Clientes 370,8 267,9 38,4% ↑ 340,9 8,8% ↑
Fornecedores e Materiais 38,2 84,9 (55,1%) ↓ 38,9 (2,0%) ↓
Impostos e Contribuições 23,6 29,3 (19,6%) ↓ 30,0 (21,6%) ↓
Outros 184,2 182,8 0,7% ↑ 155,0 18,8% ↑
Passivo Não-Circulante 1.502,2 1.585,4 (5,2%) ↓ 1.547,8 (2,9%) ↓
Empréstimos e Financiamentos 158,9 225,2 (29,4%) ↓ 51,5 208,6% ↑
Debêntures 398,5 448,4 (11,1%) ↓ 804,8 (50,5%) ↓
Obrig. com Terrenos e Adiant. de Clientes 806,6 824,8 (2,2%) ↓ 602,4 33,9% ↑
Impostos Diferidos 15,7 14,0 12,0% ↑ 11,8 32,7% ↑
Provisão para Contingências 32,3 27,6 17,0% ↑ 28,7 12,7% ↑
Outros credores 0,0 0,0 0,0% ↑ 0,0 0,0% ↑
Outros 90,2 45,4 98,7% ↑ 48,6 85,5% ↑
Patrimônio Líquido Total 1.518,1 1.480,5 2,5% ↑ 1.351,7 12,3% ↑
Patrimônio Líquido 1.517,6 1.479,1 2,6% ↑ 1.350,6 12,4% ↑
Participação dos Minoritários 0,5 1,4 (64,8%) ↓ 1,1 (54,9%) ↓
Total do Passivo e Patrimônio Líquido 4.236,7 4.109,4 3,1% ↑ 3.478,5 21,8% ↑
24
FLUXO DE CAIXA
(R$ milhões) 4T20 3T20 T/T (%) 4T19 A/A (%) 2020 2019 A/A (%)
Consolidado
Caixa líquido gerado (aplicado) -
operacional
(48,6) 94,2 (151,6%) ↓ (0,1)
(78.325,8%)
↓
94,0 68,8 36,6% ↑
Lucro Líquido (Prejuízo) antes dos
impostos
84,0 82,0 2,5% ↑ 86,7 (3,0%) ↓ 241,6 299,5 (19,3%) ↓
Despesas/receitas que não
impactam capital de giro
0,0 0,0 0,0% ↑ 0,0 0,0% ↑ 0,0 0,0 0,0% ↑
Depreciações e Amortizações 3,2 9,6 (66,5%) ↓ 9,0 (64,1%) ↓ 30,1 31,7 (5,0%) ↓
Provisão (reversão) para créditos
de liquidação duvidosa e distratos
15,0 (6,3) 337,8% ↑ 8,7 71,5% ↑ 41,5 11,3 265,7% ↑
Ajuste a valor presente 0,7 (1,6) 143,6% ↑ 0,9 (22,4%) ↓ (2,2) (2,6) 14,7% ↑
Impairment 2,0 (2,6) 180,2% ↑ (3,1) 166,8% ↑ (1,0) (6,0) 82,6% ↑
Equivalência Patrimonial 0,4 0,1 342,0% ↑ (5,0) 107,7% ↑ 0,5 (3,2) 114,8% ↑
Provisão por contingências 10,2 (3,7) 375,2% ↑ 3,5 191,4% ↑ 9,5 (4,9) 294,4% ↑
Juros e encargos não realizados,
líquidos
(1,2) 9,5 (112,7%) ↓ 4,6 (126,5%) ↓ 32,9 16,8 96,0% ↑
Provisão para garantia 18,7 1,6 1.077,5% ↑ 4,4 326,6% ↑ 21,4 6,5 232,1% ↑
Provisão para distribuição de
lucros
(1,0) 1,9 (153,3%) ↓ 1,8 (154,6%) ↓ 12,3 15,0 (17,7%) ↓
Despesas com plano de opções 6,0 6,0 (0,3%) ↓ 2,9 106,4% ↑ 18,7 8,7 116,5% ↑
Baixa de Imobilizado e intangível
líquido
8,7 (3,2) 370,9% ↑ 0,0 0,0% ↑ 5,5 0,0 0,0% ↑
Outras provisões (2,5) (0,7) (255,7%) ↓ (0,5) (356,9%) ↓ (3,4) (1,6) (105,4%) ↓
Arrendamento mercantil 0,0 (4,5) 100,0% ↑ 0,0 0,0% ↑ 0,0 0,0 0,0% ↑
Impostos diferidos (11,6) (1,3) (760,2%) ↓ (0,3)
(4.227,0%)
↓
(9,7) 0,8
(1.394,0%)
↓
Clientes (128,3) (39,8) (222,1%) ↓ (15,7) (717,4%) ↓ (324,1) (165,2) (96,2%) ↓
Imóveis a venda (66,5) (31,5) (111,1%) ↓ (179,5) 63,0% ↑ (139,0) (422,4) 67,1% ↑
Outras contas a receber (13,0) (4,6) (183,1%) ↓ (27,6) 52,8% ↑ (29,2) (49,1) 40,6% ↑
Fornecedores (46,8) 31,1 (250,4%) ↓ (21,0) (122,7%) ↓ (0,8) 17,5 (104,4%) ↓
Impostos e contribuições 0,2 (10,3) 102,3% ↑ 1,4 (83,4%) ↓ (2,4) 2,2 (208,6%) ↓
Salários, encargos sociais e
participações
(16,9) 9,8 (272,9%) ↓ (7,1) (136,4%) ↓ (5,7) (10,8) 47,2% ↑
Obrigações por aquisição de
imóveis
86,1 65,5 31,5% ↑ 140,7 (38,8%) ↓ 212,6 353,3 (39,8%) ↓
Outras contas a pagar 14,8 5,9 151,6% ↑ 4,0 267,6% ↑ 21,9 1,0 2.054,3% ↑
Operações de conta corrente (0,0) 0,4 (112,8%) ↓ (0,2) 76,2% ↑ 0,6 0,7 (25,1%) ↓
Impostos Pagos (11,0) (18,9) 41,8% ↑ (8,6) (27,6%) ↓ (37,7) (30,3) (24,5%) ↓
Caixa líquido gerado (aplicado) -
investimento
138,6 121,0 14,6% ↑ (110,9) 225,0% ↑ (249,8) (209,2) (19,4%) ↓
Atividades de Investimento 0,0 0,0 0,0% ↑ 0,0 0,0% ↑ 0,0 0,0 0,0% ↑
Aquisição de propriedades e
equipamentos
(17,0) (12,7) (33,7%) ↓ (12,0) (42,4%) ↓ (55,2) (44,8) (23,2%) ↓
Aplicação / resgate de títulos e
valores mobiliários
155,8 133,7 16,5% ↑ (98,9) 257,4% ↑ (194,4) (164,3) (18,3%) ↓
Aumento de Investimentos (0,1) 0,0 0,0% ↑ 0,0 0,0% ↑ (0,1) 0,0 0,0% ↑
Dividendos Recebidos 0,0 0,0 0,0% ↑ 0,0 0,0% ↑ 0,0 0,0 0,0% ↑
Caixa líquido gerado (aplicado) -
financiamento
(45,4) (216,2) 79,0% ↑ 100,4 (145,2%) ↓ 177,2 154,4 14,8% ↑
Recompra de ações (5,3) 0,0 0,0% ↑ 0,3
(2.065,4%)
↓
(5,3) (62,2) 91,5% ↑
Aumento de Capital 0,0 0,0 0,0% ↑ 0,0 0,0% ↑ 0,0 0,0 0,0% ↑
Aumento de Reserva de Capital (0,3) 9,1 (103,0%) ↓ 1,4 (119,9%) ↓ 0,8 5,5 (85,3%) ↓
Dividendos Pagos (30,5) (18,1) (68,5%) ↓ (15,4) (98,4%) ↓ (48,6) (57,8) 15,9% ↑
Aumento empréstimos e
financiamentos
0,8 57,8 (98,7%) ↓ 202,1 (99,6%) ↓ 648,7 693,5 (6,5%) ↓
Amortização de empréstimo e
financiamento
(7,8) (263,9) 97,0% ↑ (86,6) 91,0% ↑ (413,0) (418,0) 1,2% ↑
Pagamento de arrendamento (2,1) (0,9) (125,7%) ↓ (0,9) (127,7%) ↓ (4,8) (3,8) (28,1%) ↓
Operações de mútuo (0,2) (0,2) 3,3% ↑ (0,5) 56,8% ↑ (0,6) (2,9) 78,6% ↑
Aumento (redução) de caixa e
equivalentes
44,6 (0,9) 4.800,5% ↑ (10,6) 522,8% ↑ 21,4 14,1 52,0% ↑
Saldo no início do período 25,1 26,1 (3,6%) ↓ 58,9 (57,3%) ↓ 48,4 34,3 41,0% ↑
Saldo no fim do período 69,7 25,1 177,5% ↑ 48,4 44,2% ↑ 69,7 48,4 44,2% ↑
25
RELAÇÕES COM INVESTIDORES
Renan Barbosa Sanches
CFO e Diretor Executivo de Relações com Investidores
Alvaro Kaue
Gerente de Relações com Investidores
Bruno Souza
Especialista de Relações com Investidores
Relações com Investidores
Tel.: +55 (11) 3111-9909
E-mail: ri@tenda.com
Website: ri.tenda.com
ASSESSORIA DE IMPRENSA
NOVAPR
Marilia Paiotti
Tel.: +55 (11) 5180-9079
E-mail: marilia.paiotti@novapr.com.br
SOBRE A TENDA
A Tenda (B3: TEND3) é uma das principais
construtoras do Brasil e está listada no Novo
Mercado, o mais alto nível de governança
corporativa da B3. Com foco em habitação
popular, atua em nove regiões
metropolitanas do país com
empreendimentos voltados para o grupo 2 do
programa Casa Verde e Amarela (“PCVA”).
In a year of record operating results, net
revenue grew 17.0% YoY reaching R$2.3
billion, gross profit amounted to R$710.4
million (+9.6% YoY) with a reduction in net
income to R$200.3 million (-24.0% YoY)
2
São Paulo, March 11, 2021 - Construtora Tenda S.A. (“Company”, “Tenda”), a leading Brazilian
homebuilder and real estate developer focused on affordable housing, announces today its results for
the fourth quarter and the full year of 2020.
HIGHLIGHTS
FINANCIALS
▪ NetRevenueofR$2.3billionin2020(+17.0%YoY).In4Q20,itaccountedforR$685.9million(+26.3%YoY);
▪ Adjustedgrossmarginof32.2%in2020(-2.8p.p.YoY).In4Q20,theindicatorrecorded31.5%(-1.9p.p.YoY);
o Backlog margin ended 2020 at 35.2% (-4.0 p.p. YoY) impacted by the loss of productivity in the
construction sites that were paralyzed in 1H20 due to the pandemic and an increase in the
construction materials costs;
▪ Net Income of R$200.3 million in the year (-24% YoY), totaling R$72.0 million in the quarter. The off-
site model amounted to a loss of R$-8.9 million in the year, of which R$-2.7 million was recorded for
the quarter;
▪ OperatingcashgenerationendedtheyearonapositivenoteatR$70.0million(+223.9%YoY).In4Q20,
the Company accelerated the activity of some construction sites to off-set readjustments in material
costs, consuming R$54.3 million;
▪ Net debt/Equity -9.8%, de-leveraging reduced due to dividend distribution and and stock buyback
throughout the year;
OPERATIONS
▪ 20 projects launched in 4Q20 with PSV of R$885.2 million (+5.9% YoY and -10.1% QoQ);
o Record year for launches reaching PSV of R$2.67 billion (+3.5% YoY);
▪ Recordquarterlygrosssales ofR$854.7million(+27.7%YoYand+2.2%QoQ)andgrossSoSof35.0%
(+4.5 p.p. YoY and -1.3% QoQ). In a record year, R$2.92 billion was recorded in PSV (+30.4% YoY);
o Record quarterly net sales of R$795.2 million in 4Q20 (+29.1% YoY and +7.2% QoQ) and net
VSO of 32.5% (+4.5 p.p. YoY and +0.2 p.p. QoQ). In a record year, R$2.92 billion was recorded in
PSV (+30.4% YoY);
o Cancellations at 7.0% (-1.0 p.p. YoY and -4.2 p.p. QoQ) on gross sales in 4Q20, ending the year
recording an average of 12.6% (+3.7 p.p. YoY) ;
▪ PSV transferred of R$619.8 million this quarter (+12.1% YoY and -1.0% QoQ) totaling R$2.14 billion
for the year (+30.7% YoY);
▪ Landbank reached R$10.97 billion in PSV in the end of 2020 (+3.3% YoY)
COVID-19
▪ Record launches for 2020 with a recovery in the second half of the year;
▪ Sales at record-high levels signaling demand resilience and efficiency of both online and third-party
sales channels.
▪ Construction sites transfers were normalized throughout 4Q20.
3
MESSAGE FROM THE MANAGEMENT
Even in a challenging year marked by the Covid-19 pandemic, Tenda posted record operating results
for launches, sales, and transfers, once again attesting to the resilience of the Brazilian affordable
housing market and consolidating itself as the main company exclusively focused on projects aimed at
bracket 2 of the Programa Casa Verde e Amarela.
More than 18,000 housing units were launched in 2020, accounting for a PSV of R$2.66 billion (+3.5%
YoY) in line with a significant increase in net sales, which reached a PSV of R$2.55 billion (+25.2% YoY)
and quarterly SoS of 32.5% (+4.5 p.p. YoY). It should be noted that the record performance in sales
occurred organically without the need to reduce prices or increase selling expenses, largely due to
the major digital transformation that we have brought about to the entire sales process, both at our
own stores and in the relationship with partner sales companies, allowing for enhanced efficiency even
within the complex scenario of social distance.
The positive operating performance, especially in the second half of 2020, is reflected in the
improvement in the net operational revenue. We posted record levels in net operating revenues which
totaled R$2.29 billion this year (+17% YoY). On the other hand, adjusted gross margin was adversely
impacted by the effects of the pandemic ending the year at 32.2% (-2.8 p.p. YoY) with emphasis on the
loss of productivity of some construction sites that were paralyzed in the first half (normalized 3Q20).
Due to pressures with an increase in material costs that the sector has been suffering, the profit margin
to be appropriated also decreased by -1.1 p.p. q/q and -4.0 p.p. YoY due to the new harvests of
construction sites that already reflect this increase.
With that, Tenda delivered a net profit of R$200.3 million, down 24.0% YoY, closing the year with 14.0%
of ROE (-6.7 p.p. YoY), 19.6% of ROIC (-8.7 p.p. YoY) and earnings of R$2.04 per share (ex -Treasury), a
drop of 25.1% YoY. In this last quarter, the Company consumed R$54.3 million in operating cash, by
adopting the strategy of accelerating activities of some construction sites as means to prevent price
adjustments in 2021, ending the year with a generation of R$70.0 million in operating cash.
Tenda reiterates its option for a conservative financial management. The Company maintains a net
cash position (R$148.3 million at the end of 2020) resulting in a net debt-to-equity ratio of -9.8%. The
strategic decision is validated by the recurrence of events that impact cash generation, such as delays
in transfers within the Programa Casa Verde and Amarela.
In 2020 we made important progress in the off-site project and became ever more convinced that it
is the major growth platform of the Company, with highlights on the completed pilot projects which
proved the initial theses of product quality and production efficiency, on Marcelo Willer (ex-CEO of
Alphaville Urbanismo), who joined the company as a minority investor in the project as announced last
quarter, and the investment we are making in setting up a factory with a high production capacity of up
to 10,000 units per year and whose operations are scheduled to start in the second half of 2021. As of
the year 2021, we have the ambition to form a robust land bank to scale up the operation, seeking to
operate at full capacity of the new plant in 2026.
Tenda points out that it remains focused on long term value generation seeking to build competitive
differentials through civil construction industrialization, aiming to be the company which
consistently delivers the highest return to its shareholders.
4
GUIDANCE
In order to offer aligned information and provide predictability about our figures to the market, in
2021 the Company chose to disclose its projections (guidance) of the on-site model based on the
expectations of the management, on internal studies carried out, and on the economic and financial
outlook of the market we operate.
• In 2021, for the Adjusted Gross Margin, referred to as the ratio between the gross result (less the
financial charges described in explanatory note 11 of the financial statements) and the consolidated
net revenue for the year, it is estimated a fluctuation between a minimum of 30.0% and a maximum
of 32,0%.
• In 2021, for the Net Sales, referred to as the result of the deduction between gross sales (R$ million)
and cancellations (R$ million) recorded in the year, all values adjusted to Tenda's equity, a variation is
estimated between the minimum of R$2,800 million and a maximum of R$3,000 million.
Guidance 2021 Lower Limit Upper Limit
Adjusted Gross Margin (%) 30.0% 32.0%
Net Sales (R$ MM) 2,800.0 3,000.0
TENDA'S ON-SITE AND OFF-SITE OPERATIONS BREAKDOWN
In compliance with the commitment
assumed, from this quarter onwards, we
will present the data of our on-site and
off-site operations separately.
On-site: Model in which the company has
been operating since 2013, characterized
by the construction of apartments in
construction sites using the construction
method of concrete wall with aluminum
form, in metropolitan areas, with a
minimum production demand of 1,000
units/year.
Off-site Model characterized by the
development of houses produced in a
factory using the woodframe
construction technology and assembled
at the construction site. Since this model
does not require a minimum local
demand, it opens up the possibility for
the company to explore smaller markets
operating in small- and medium-sized
cities in the country.
Consolidated: Aggregate result of the
two operations.
5
Off-site
On Tenda Day, an event held for investors on December 16, 2020, we announced the investment we are
making in setting up a high production plant. In addition, we published the images of the first finished
houses of the pilot project, which consists of a gated community with 49 houses located in Mogi das
Cruzes on a land that was already part of our landbank. In this initial phase, the purpose of the off-site
project is to explore the demand of medium-sized cities in the interior of São Paulo.
New Factory: The new plant will be opened in the second half of 2021 in the city of Jaguariúna, in the
interior of São Paulo. It has more than 18,000 m² and a high production capacity of 10 thousand units
per year is expected to be achieved by 2016. The new machinery is on its way and is scheduled to reach
Brazil in the second quarter this year. We are starting to demobilize our innovation center to incorporate
the existing machinery into the new plant.
DATEC Step: DATEC is the technical evaluation document that accredits the materials used and
processes adopted for a given construction system. Obtaining DATEC certification for the new off-site
construction system qualifies us to operate on the same model as Tenda on-site, allowing transfers with
CEF during the construction sites. The certification process is underway and is expected to be issued in
the first half of 2021.
Tecverde Partnership: Tecverde is a pioneer in woodframe constructions in Brazil, with more than 10
years of experience and more than 4,500 units built. In order to accelerate our learning curve in the
construction system, in 4Q20 Tenda entered into a partnership with Tecverde , which is building 50
houses in the interior of São Paulo.
6
Indicators to be monitored: In off-site construction, the process of implementing and converting the
concepts of production engineering into civil engineering is facilitated. The houses are produced in a
controlled environment, protected from weathering, with the possiblity of productivity gains by
operating at full capacity in 3 shifts and improved efficiency through automation.
The production of houses in a factory and the use of the construction site only for assemblying them
allows the company to operate in low-scale local markets.
The possibility of operating at a low local scale substantially increases the number of addressable
markets, increasing the global scale to be explored.
The high global scale allows the company to have competitive costs through the development of the
supply chain, which can be translated into better products offered (location, area, price, and urbanism)
and higher speed of sales, thus reinforcing the gain of scale. The faster the flywheel spins, the greater
the Company's competitive advantage in the long run.
The success of the off-site project depends on the gain of scale, the land purchase monitoring, and the
launch indicators, which are a beacon to monitor the speed the projects are implemented. We ended
2020 with two pilot projects and reinforced that 2021 and 2022 continue to be years of learning by
scaling up the volume of launches after 2023.
High
SoS
High
global
sacle
Unimaginable
product
Cost
reduction
Operations
in a large
number of
markets
Low
local
scale
High
Global
Scale
7
ESG
In 3Q20 the company presented a starting point with the main elements of ESG impact based on the
material topics proposed by the SASB (Sustainability Accounting Standards Board) and S&P SAM CSA
(Corporate Sustainability Assessment) for the sector, in addition to other material aspects associated
with Tenda's performance in the affordable housing segment.
Tenda's main elements with ESG impact can be grouped together into three pillars:
Social Inclusion
Products available to low-income families through projects that contribute to enhanced well-being,
sanitation, and infrastructure of communities.
At Tenda, a B3 company fully dedicated to building affordable housing units, all the projects fall into
bracket 2 of the Programa Casa Verde e Amarela. The Company offers apartments with prices 19% lower
than the average charged by the main competitors (according to sales information for 4Q20), providing
families which never had this alternative with access to their own properties. In 2020, Tenda reached
families with an average monthly family income of R$2,473, which is closer to the floor value than to
the ceiling value of PCVA bracket 2 (range of monthly family income between R$2,000 and R$4,000).
Average Sales Prices (R$ mil) 4Q20 3Q20 QoQ (%) 4Q19 YoY (%)
Tenda (R$ / unit) 142 143 (0.7%) ↓ 139 2.2% ↑
PCVA¹ (R$ / unit) 175 171 2.3% ↑ 165 6.1% ↑
% Average Sales Prices (Tenda / PCVA) 81.1% 83.6% (3.0%) ↓ 84.2% (3.7%) ↓
¹ Weighted average price between MRV (only MRV) and Direcional (only Direcional)
¹Based on gross sales between Jan/20 and Dec
² Weighted average price between MRV (100%) and Direcional (PCVA 2 and 3 only)
Closer to the floor
value than bracket
2 of PCVA
Social inclusion
AVERAGE MONTHLY
FAMILY INCOME
(R$, Jan to Dec/20¹)
2.473
142
175
Tenda PCVA
AVERAGE PRICE
PER UNIT SOLD
(R$ thous, 4Q20²)
2.000 4.000
B3 COMPANY FULLY DEDICATED TO
PROJECTS IN CASA VERDE E AMARELA
PROGRAM
Properties affordable by
low-income families
8
Respect for customers and employees
Quality products, delivered on-schedule and made safely by directly hired professionals and with
growth opportunities.
All projects launched since 2013, the year that marks the beginning of the current business model, were
delivered within the contractual term, one of the main commitments assumed by Management with its
customers. The Company has turned its efforts towards customer satisfaction and, in 2020, the Net
Promoting Score (NPS), one of the main global metrics of satisfaction, became part of the goals of its
main officers.
At Tenda, nearly all employees involved in the construction of the buildings are employed directly by
the Company, and not outsourced, as is usually the practice in the sector. In addition to enabling the
implementation of the industrial approach to construction, which is Tenda's main competitive
differential, the initiative brings more security and stability to employees. Tenda adopts strict
occupational health and safety practices, continuously monitoring risks and indicators.
Indicators 4Q20 3Q20 QoQ (%) 4Q19 YoY (%)
On-schedule deliveries (%)¹ 100% 100% 0.0% ↑ 100% 0.0% ↑
Number of direct employees ² 3,757 3,682 2.0% ↑ 3,558 5.6% ↑
Number of indirect employees 1,620 1,900 (14.7%) ↓ 1,762 (8.1%) ↓
Total employees 5,377 5,582 (3.7%) ↓ 5,320 1.1% ↑
% direct employees/total 70% 66% 5.9% ↑ 67% 4.5% ↑
¹ Projects launched since 2013, the starting point of the current business model
² Employees directly hired by the Company
Respect for
clients and
employees 5.377
EMPLOYEES
70%
ARE DIRECTLY HIRED BY
TENDA
Clients receive the
housing units within
schedule
100%OF PROJECTS LAUNCHED
AFTER 2013
WERE DELIVERED
WITHIN SCHEDULE
Most employees directed
hired
SAFE ENVIRONMENT:
INDUSTRIAL RISK MONITORING STANDARDS
Own employees in ~
100% of the tower's
activities
9
Commitment to Ethics and Governance
Rigor and responsible performance in all stages of the viability of the projects, with management in
line with the best corporate practices
Ethical behavior is part of Tenda's culture and is at the heart of the Company's decisions, from the
prospecting and legalization processes for future projects to the best practices towards employees and
suppliers. The company maintains an Ethics Committee coordinated by the CEO, codes of ethics and
conduct for employees and suppliers, and independent reporting channels.
A Novo Mercado company, B3's highest Corporate Governance level, Tenda meets 90% of the best
practices established by Brazilian Institute of Corporate Governance (IBGC) under the Brazilian
Governance Code. All Board Members are independent, and all directors are statutory officers, with 37%
of their total compensation linked to long-term incentives.
³ Based on answers to Tenda's CVM 586(Brazilian Securities Exchange Commission) form
4
According to the management proposal approved at the Annual Shareholders' Meeting for the year 2020
For more ESG-related information, contact Tenda's IR team at ri@tenda.com
Commitment to
ethics and
governance
Culture focused on
ethical conduct
Reference Governance
✓ Ethics Committee
coordinated by the CEO
✓ Ethics Code for employees
and suppliers
✓ Preliminary Assessment og
suppliers
✓ Independent Reporting
Hotline
90% COMPLIANT WITH
IBGC’S BEST
PRACTICES IN 2019?³
✓ A Novo Mercado Company
✓ All board members are
independent
✓ All the directors are
statutory officers, with
37% of compensation linked
to long term incentives4
10
OPERATIONAL AND FINANCIAL HIGHLIGHTS
Off-site operation values are not provided yet,
Financial Highlights (R$
million)
4Q20 3Q20 QoQ (%) 4Q19 YoY (%) 2020 2019 YoY (%)
On-site
Net Revenue 685.9 654.5 4.8% ↑ 543.1 26.3% ↑ 2,282.4 1,950.1 17.0% ↑
Adjusted Gross Profit¹ 216.4 216.3 0.1% ↑ 181.7 19.1% ↑ 734.6 681.7 7.8% ↑
Adjusted Gross Margin¹ (%) 31.5% 33.0% (1.5 p.p.) ↓ 33.4% (1.9 p.p.) ↓ 32.2% 35.0% (2.8 p.p.) ↓
Adjusted EBITDA² 112.8 111.4 1.3% ↑ 99.9 12.9% ↑ 338.7 353.5 (4.2%) ↓
Adjusted EBITDA Margin² (%) 16.4% 17.0% (0.6 p.p.) ↓ 18.4% (2.0 p.p.) ↓ 14.8% 18.1% (3.3 p.p.) ↓
Net Income (Loss)³ 74.7 76.3 (2.1%) ↓ 76.2 (2.0%) ↓ 209.2 263.5 (20.6%) ↓
Net Margin (%) 10.9% 11.7% (0.8 p.p.) ↓ 14.0% (3.1 p.p.) ↓ 9.2% 13.5% (4.3 p.p.) ↓
Backlog Revenues 949.5 745.3 27.4% ↑ 555.2 71.0% ↑ 949.5 555.2 71.0% ↑
Backlog Margin (%) 35.2% 36.3% (1.1 p.p.) ↓ 39.2% (4.0 p.p.) ↓ 35.2% 39.2% (4.0 p.p.) ↓
Operating Cash Generation⁴ (44.7) 119.3 (137.4%) ↓ (11.3) (296.8%) ↓ 97.7 24.5 299.6% ↑
Off-site
Net Revenue 0.0 0.0 0.0% ↑ 0.0 0.0% ↑ 0.0 0.0 0.0% ↑
Adjusted EBITDA² (2.6) (5.8) 55.3% ↑ (0.0) (0.0% ↑ (8.6) (0.0) 0.0% ↑
Adjusted EBITDA Margin² (%) 0.0% 0.0% 0.0 p.p. 0.0% 0.0 p.p. 0.0% 0.0% 0.0 p.p.
Net Income (Loss)³ (2.7) (5.8) 53.1% ↑ 0.0 0.0% ↑ (8.9) 0.0 0.0% ↑
Net Margin (%) 0.0% 0.0% 0.0 p.p. 0.0% 0.0 p.p. 0.0% 0.0% 0.0 p.p.
Operating Cash Generation⁴ (9.6) (7,8) (23.3%) ↓ (1.3) (645.5%)↑ (27.7) (2.8) (874.8%) ↑
Consolidated
Net Revenue 685.9 654.5 4.8% ↑ 543.1 26.3% ↑ 2,282.4 1,950.1 17.0% ↑
Adjusted Gross Profit¹ 216.4 216.3 0.1% ↑ 181.7 19.1% ↑ 734.6 681.7 7.8% ↑
Adjusted Gross Margin¹ (%) 31.5% 33.0% (1.5 p.p.) ↓ 33.4% (1.9 p.p.) ↓ 32.2% 35.0% (2.8 p.p.) ↓
Adjusted EBITDA² 110.2 105.6 4.4% ↑ 99.9 10.3% ↑ 330.0 353.5 (6.6%) ↓
Adjusted EBITDA Margin² (%) 16.1% 16.1% (0.1 p.p.) ↓ 18.4% (2.3 p.p.) ↓ 14.5% 18.1% (3.7 p.p.) ↓
Net Income (Loss)³ 72.0 70.5 2.1% ↑ 76.2 (5.6%) ↓ 200.3 263.5 (24.0%) ↓
Net Margin (%) 10.5% 10.8% (0.3 p.p.) ↓ 14.0% (3.5 p.p.) ↓ 8.8% 13.5% (4.7 p.p.) ↓
Backlog Revenues 949.5 745.3 27.4% ↑ 555.2 71.0% ↑ 949.5 555.2 71.0% ↑
Backlog Margin (%) 35.2% 36.3% (1.1 p.p.) ↓ 39.2% (4.0 p.p.) ↓ 35.2% 39.2% (4.0 p.p.) ↓
Net Debt / (Shareholders’
Equity + Minority
Shareholders) (%)
(9.8%) (16.9%) 7.2 p.p. ↑ (14.8%) 5.0 p.p. ↑ (9.8%) (14.8%) 5.0 p.p. ↑
Operating Cash Generation⁴ (54.3) 111.5 (148.7%) ↓ (12.5) (332.5%) ↓ 70.0 21.6 223.9% ↑
ROE⁵ (LTM) 14.0% 14.7% (0.7 p.p.) ↓ 20.7% (6.7 p.p.) ↓ 14.0% 20.7% (6.7 p.p.) ↓
ROIC⁶ (LTM) 19.6% 21.1% (1.5 p.p.) ↓ 28.3% (8.7 p.p.) ↓ 19.6% 28.3% (8.7 p.p.) ↓
Earnings per Share⁷ (LTM)
(R$/share) (ex-Treasury)
2.04 2.09 (2.5%) ↓ 2.73 (25.1%) ↓ 2.04 2.73 (25.1%) ↓
1. Adjusted by capitalized interests.
2. Adjusted by capitalized interests, expenses with stock option plans (non-cash) and minority shareholders.
3. Adjusted by minority shareholders.
4. Operating Cash Generation is the results of the company’s calculation that does not reflect or compare to the numbers in the financial statments
5. ROE is calculated by net income of the last 12 months adjusted by minority shareholders divided by the average shareholders’ equity. Average referring to the
opening and closing position in the last 12 months.
6. ROIC is calculated by NOPAT of the last 12 months divided by average capital employed. Average referring to the opening and closing position in the last 12 months.
7. Earnings per share (ex-Treasury) considers the issued shares (adjusted for stock splits) and does not consider shares held in Treasury at the end of the period.
Operational Highlights (R$
million, PSV)
4Q20 3Q20 QoQ (%) 4Q19 YoY (%) 2020 2019 YoY (%)
On-site
Launches 885.2 984.2 (10.1%) ↓ 835.8 5.9% ↑ 2,665.2 2,575.1 3.5% ↑
Net Sales 795.2 742.1 7.2% ↑ 615.9 29.1% ↑ 2,553.5 2,039.6 25.2% ↑
Net SoS (%) 32.5% 32.3% 0.2 p.p. ↑ 28.0% 4.5 p.p. ↑ 60.8% 56.3% 4.5 p.p. ↑
PSV Transferred 619.8 626.2 (1.0%) ↓ 553.1 12.1% ↑ 2,144.8 1,641.1 30.7% ↑
Delivered Units (#) 2,728.0 2,163.0 26.1% ↑ 1,752.0 55.7% ↑ 9,246.0 10,368.0 (10.8%) ↓
Land Bank 10,974.5 10,802.8 1.6% ↑ 10,619.4 3.3% ↑ 10,974.5 10,619.4 3.3% ↑
11
OPERATIONAL RESULTS
LAUNCHES
In 4Q20, Tenda launched 20 projects, reaching R$ 885,2 million in PSV (+5.9% YoY and -10,1% QoQ).
Record in 2020 launches reached PSV of R$2.67 billion, an increase of 3.5% in the annual comparison.
This, the metropolitan area (“RM”) of São Paulo started to represent 37.1% of the PSV launched (versus
35.7% in 2019) with 5,898 units launched (+6.5% YoY). Salvador's RM accounted for 19.2% of the PSV
launched (versus 15.7% in 2019) with 3,668 units launched (+22.8% YoY).
The increase of 2.2% YoY in the average price per unit launched was driven by the increase in the
representativeness of the regions of SP and BA in the total PSV launched, where we have already
launched projects with elevators that are concentrated closer to the central areas.
Off-site operation values are not provided yet.
GROSS SALES
Gross sales amounted to R$854.7 million in 4Q20, (+27.7% YoY and +2.2% QoQ). This is a record-high
quarter in gross sales in Tenda's history. Compared to 2019, 2020 ended with a 30.4% increase in PSV
of gross sales.
This year we posted an increase in the number of units sold (+26.6% YoY) and in the average price per
unit sold (+3.0% YoY) driven by the greater share of São Paulo in the gross sales mix (37.8% in 2020
versus 35.4% in 2019). Gross SoS reached 35.0% in 4Q20, a decrease of 1.3 p.p. compared to 3Q20.
Gross sales 4Q20 3Q20 QoQ (%) 4Q19 YoY (%) 2020 2019 YoY (%)
On-site
PSV (R$ million) 854.7 836.1 2.2% ↑ 669.4 27.7% ↑ 2,921.0 2,239.4 30.4% ↑
Number of units 6,042 5,860 3.1% ↑ 4,831 25.1% ↑ 20,761 16,397 26.6% ↑
Average price per unit (R$ mil) 141.5 142.7 (0.9%) ↓ 138.6 2.1% ↑ 140.7 136.6 3.0% ↑
Gross SoS 35.0% 36.3% (1.3 p.p.) ↓ 30.5% 4.5 p.p. ↑ 69.5% 61.8% 7.7 p.p. ↑
Off-site operation values are not provided yet.
Gross Sales (PSV, R$ million) and Gross SoS (%) On-site
Launches 4Q20 3Q20 QoQ (%) 4Q19 YoY (%) 2020 2019 YoY (%)
On-site
Number of launches 20 17 17.6% ↑ 22 (9.1%) ↓ 55 63 (12.7%) ↓
PSV (R$ million) 885.2 984.2 (10.1%) ↓ 835.8 5.9% ↑ 2,665.2 2,575.1 3.5% ↑
Number of units 6,136 6,325 (3.0%) ↓ 5,972 2.7% ↑ 18,120 17,894 1.3% ↑
Average price per unit (R$ mil) 144.3 155.6 (7.3%) ↓ 140.0 3.1% ↑ 147.1 143.9 2.2% ↑
Average size of launches (in units) 306.8 372.1 (17.5%) ↓ 271.5 13.0% ↑ 329.5 284.0 16.0% ↑
12
CANCELLATIONS AND NET PRE-SALES
Net sales amounted to R$795.2 million in 4Q20, (+29.1% YoY and +7.2% QoQ). This is a record-high
quarter in net sales in Tenda's history. We ended 2020 with R$2.55 billion, an increase of 25.2% in the
annual comparison.
Speed over Supply (“net SoS”) reached 32.5% this quarter (+4.5 p.p. YoY and +0.2 p.p. QoQ). The
quarterly average of Net SoS this year accounted for 30.2%, an increase of 2.1 p.p. compared to 28.1%
in 2019.
The ratio of cancellations to gross sales of 7.0% in 4Q20 decreased 4.2 p.p. compared to 3Q20. We
recorded a high level of cancellations in the first nine months of the year due to the pandemic, with a
significant reduction this quarter. In 2020, it at 12.6% (+3.7 p.p. YoY) and the expectation is that in 2021
this indicator will continue to converge to the historic levels of 2019.
(PSV, R$ million) 4Q20 3Q20 QoQ (%) 4Q19 YoY (%) 2020 2019 YoY (%)
On-site
Gross sales 854.7 836.1 2.2% ↑ 669.4 27.7% ↑ 2,921.0 2,239.4 30.4% ↑
Cancellations 59.5 94.0 (36.7%) ↓ 53.5 11.2% ↑ 367.5 199.8 83.9% ↑
Net Sales 795.2 742.1 7.2% ↑ 615.9 29.1% ↑ 2,553.5 2,039.6 25.2% ↑
% Launches¹ 79.6% 54.4% 25.2 p.p. ↑ 83.3% (3.7 p.p.) ↓ 48.0% 51.5% (3.5 p.p.) ↓
% Inventory 20.4% 45.6% (25.2 p.p.) ↓ 16.7% 3.7 p.p. ↑ 52.0% 48.5% 3.5 p.p. ↑
Cancellations / Gross Sales 7.0% 11.2% (4.2 p.p.) ↓ 8.0% (1.0 p.p.) ↓ 12.6% 8.9% 3.7 p.p. ↑
Net SoS 32.5% 32.3% 0.2 p.p. ↑ 28.0% 4.5 p.p. ↑ 60.8% 56.3% 4.5 p.p. ↑
(in units) 4Q20 3Q20 QoQ (%) 4Q19 YoY (%) 2020 2019 YoY (%)
On-site
Gross Units Sold 6,042 5,860 3.1% ↑ 4,831 25.1% ↑ 20,761 16,397 26.6% ↑
Canceled Units 431 681 (36.7%) ↓ 383 12.5% ↑ 2,671 1,490 79.3% ↑
Net Units Sold 5,611 5,179 8.3% ↑ 4,448 26.1% ↑ 18,090 14,907 21.4% ↑
Cancellations / Gross Sales 7.1% 11.6% (4.5 p.p.) ↓ 7.9% (0.8 p.p.) ↓ 12.9% 9.1% 3.8 p.p. ↑
1. Current year launches.
Off-site operation values are not provided yet.
Net Sales (PSV, R$ million) and Net SoS (%) - On-site
13
UNITS TRANSFERRED, DELIVERED AND CONSTRUCTION SITES UNDERWAY
The PSV transferred totaled R$619.8 million in 4Q20 (+12.1% YoY and -1.0% QoQ). The good
performance was driven by the normalization of financing during the second semester, given that Caixa
Econômica Federal (“CEF”) adapted its procedures to overcome the operational challenges identified at
the beginning of the pandemic. In 2020, the PSV transferred accounted for R$2.1 billion, an annual
growth of 30.7%.
2,728 units were delivered in 4Q20, totaling 9,246 units throughout 2020. We ended the year with 91
sites in progress, an increase of 33.8% compared to 2019. With the recovery of the real estate sector in
2020 and the associated increase in construction costs, Tenda brought forward the beginning of some
of its constructions sites as a strategy to mitigate the impact of the readjustments that are likely to
continue to be imposed throughout 2021.
Transfers, Deliveries and
Construction Sites
4Q20 3Q20 QoQ (%) 4Q19 YoY (%) 2020 2019 YoY (%)
On-site
PSV Transferred (R$ million) 619.8 626.2 (1.0%) ↓ 553.1 12.1% ↑ 2,144.8 1,641.1 30.7% ↑
Transferred Units 4,846 5,085 (4.7%) ↓ 4,771 1.6% ↑ 17,215 13,951 23.4% ↑
Delivered Units 2,728 2,163 26.1% ↑ 1,752 55.7% ↑ 9,246 10,368 (10.8%) ↓
Construction Sites 91 82 11.0% ↑ 68 33.8% ↑ 91 68 33.8% ↑
Off-site operation values are not provided yet.
INVENTORY AT MARKET VALUE
This quarter inventories at market value totaled R$1.65 billion in PSV (+4.3% YoY and + 5.8% QoQ). The
finished inventory accounted for R$38.8 million, representing 2.4% of the total. The inventory turnover
(inventory at market value divided by net sales in the last twelve months) in 2020 reached 7.8 months,
showing an improvement in relation to the 8.2 months of the average level of the previous year.
Inventory at Market Value 4Q20 3Q20 QoQ (%) 4Q19 YoY (%) 2020 2019 YoY (%)
On-site
PSV (R$ million) 1,649.2 1,558.8 5.8% ↑ 1,581.6 4.3% ↑ 1,649.2 1,581.6 4.3% ↑
Number of units 10,878 10,416 4.4% ↑ 10,963.0 (0.8%) ↓ 10,878 10,963.0 (0.8%) ↓
Average price per unit (R$ mil) 151.6 149.7 1.3% ↑ 144.3 5.1% ↑ 151.6 144.3 5.1% ↑
Status of Construction - PSV (R$ million) 4Q20
Not
started
Up to 30%
Built
30% to
70%
Built
More than
70%
Built
Finished
Units
On-site 1,649.2 747.7 447.9 385.2 29.6 38.8
Off-site operation values are not provided yet.
LANDBANK
The company ended 2020 with a PSV of R$10.97 billion (+3.3% YoY and +1.6% QoQ) in its landbank,
maintaining the same level as in 2019.
Due to the pandemic, we spent a significant part of the year renegotiating land that we had already
acquired. Our assessment is that the performance in the purchase of land was healthy in 2020 but below
our expectations. The off-site project ended 2020 with two pilot projects in progress.
Land Bank¹ 4Q20 3Q20 QoQ (%) 4Q19 YoY (%) 2020 2019 YoY (%)
On-site
Number of projects 291 291 0.0% ↑ 292 (0.3%) ↓ 291 292 (0.3%) ↓
PSV (R$ million) 10,974.5 10,802.8 1.6% ↑ 10,619.4 3.3% ↑ 10,974.5 10,619.4 3.3% ↑
Acquisitions/Adjustments (R$
million)
1,057.0 1,096.5 (3.6%) ↓ 1,585.5 (33.3%) ↓ 3,020.4 4,300.9 (29.8%) ↓
Number of units 73,339 73,266 0.1% ↑ 72,159 1.6% ↑ 73,339 72,159 1.6% ↑
Average price per unit (R$ thousand) 149.6 147.4 1.5% ↑ 147.2 1.7% ↑ 149.6 147.2 1.7% ↑
% Swap Total 38.5% 37.9% 0.6 p.p. ↑ 34.6% 3.9 p.p. ↑ 38.5% 34.6% 3.9 p.p. ↑
% Swap Units 8.6% 8.8% (0.2 p.p.) ↓ 8.4% 0.2 p.p. ↑ 8.6% 8.4% 0.2 p.p. ↑
% Swap Financial 30.0% 29.2% 0.8 p.p. ↑ 26.2% 3.8 p.p. ↑ 30.0% 26.2% 3.8 p.p. ↑
1, Tenda holds 100% of equity interest of its Land Bank.
Off-site operation values are not provided yet.
14
FINANCIAL RESULTS
NET OPERATIONAL REVENUE
Net operational revenue totaled R$685.9 million in 4Q20 (+26.3% YoY and 4.8% QoQ) ending the year at
R$2.28 billion. In this year, we had a reclassification of R$ 46.8 million between the provisions for
cancellation and provision for estimated losses on doubtful accounts, so discounting this effect, the
provision for cancellation recorded a constitution of R$ 30.2 million (-1.3% YoY) and the PCLD recorded
a constitution of R$ 9.3 million against a reversal of R$ 12 million last year.
(R$ million) 4Q20 3Q20 QoQ (%) 4Q19 YoY (%) 2020 2019 YoY (%)
On-site
Gross Operating Revenue 706.8 651.7 8.4% ↑ 566.5 24.8% ↑ 2,358.9 2,005.3 17.6% ↑
Provision for estimated losses on
doubtful accounts
(13.0) (31.9) 59.3% ↑ 4.0 (423.4%) ↓ (56.2) 12.3 (558.0%) ↓
Provision for cancellations (0.7) 47.3 (101.4%) ↓ (18.5) 96.3% ↑ 16.5 (30.6) 154.0% ↑
Tax on sales of properties and
services
(7.2) (12.5) (42.7%) ↓ (8.9) (19.0%) ↓ (36.9) (36.9) 0.1% ↑
Net Operating Revenue 685.9 654.5 4.8% ↑ 543.1 26.3% ↑ 2,282.4 1,950.1 17.0% ↑
Off-site operation values are not provided yet.
GROSS PROFIT
This quarter adjusted gross profit reached R$216.4 million (+19.1% YoY and + 0.1% QoQ), adjusted gross
margin reached 31.5% (-1.9 p.p. YoY and -1.5 p.p.) suffering a non-recurring impact of R$ 11 million,
with emphasis on the foundation reinforcement construction site carried out in a project in São Paulo.
The adjusted gross margin without this effect would have been 33.2% in 4Q20, remaining stable to the
previous quarter.
The adjusted gross margin for the year was also negatively impacted by the effects of the pandemic,
reaching 32.2% (-2.8 p.p. YoY), with emphasis on the loss of productivity of some construction sites that
were paralyzed in the first half and normalized in 3Q20.
(R$ million) 4Q20 3Q20 QoQ (%) 4Q19 YoY (%) 2020 2019 YoY (%)
On-site
Net Revenue 685.9 654.5 4.8% ↑ 543.1 26.3% ↑ 2,282.4 1,950.1 17.0% ↑
Gross Profit 209.5 211.3 (0.8%) ↓ 173.1 21.0% ↑ 710.4 648.1 9.6% ↑
Gross Margin 30.5% 32.3% (1.7 p.p.) ↓ 31.9% (1.3 p.p.) ↓ 31.1% 33.2% (2.1 p.p.) ↓
(-) Financial Costs 6.9 5.0 38.6% ↑ 8.6 (19.6%) ↓ 24.2 33.6 (28.0%) ↓
Adjusted Gross Profit¹ 216.4 216.3 0.1% ↑ 181.7 19.1% ↑ 734.6 681.7 7.8% ↑
Adjusted Gross Margin 31.5% 33.0% (1.5 p.p.) ↓ 33.4% (1.9 p.p.) ↓ 32.2% 35.0% (2.8 p.p.) ↓
1. Adjusted by capitalized interests.
Off-site operation values are not provided yet.
15
SALES, GENERAL AND ADMINISTRATIVE EXPENSES (SG&A)
Selling Expenses
In 4Q20, selling expenses totaled R$52.1 million (+14.7% YoY and -6.3% QoQ), representing 6.1% of
gross sales. The indicator remained consistent with historical levels with record sales driven by the
positive performance of online sales. In 2020, selling expenses were R$200.6 million, 6.9% of gross sales,
down -0.4 p.p. compared to 7.3% in 2019.
General and Administrative Expenses (G&A)
This quarter general and administrative expenses (G&A) for the on-site model totaled R$36.1 million
(+37.4% YoY and -10.1% QoQ) and for the off-site model, R$2.1 million. In consolidated terms, we closed
4Q20 at R$38.3 million, ending the year at R$154.4 million (+31.9% YoY), which represents 5.8% of the
launches (+1.2 p.p. YoY).
(R$ million) 4Q20 3Q20 QoQ (%) 4Q19 YoY (%) 2020 2019 YoY (%)
On-site
Selling Expenses (52.1) (55.6) (6.3%) ↓ (45.5) 14.7% ↑ (200.6) (162.5) 23.4% ↑
General and Administrative Expenses
(G&A)
(36.1) (40.2) (10.1%) ↓ (26.3) 37.4% ↑ (146.4) (117.1) 25.0% ↑
Total SG&A Expenses (88.3) (95.8) (7.9%) ↓ (71.7) 23.0% ↑ (347.0) (279.6) 24.1% ↑
Gross sales 854.7 836.1 2.2% ↑ 669.4 27.7% ↑ 2,921.0 2,239.4 30.4% ↑
Launches 885.2 984.2 (10.1%) ↓ 835.8 5.9% ↑ 2,665.2 2,575.1 3.5% ↑
Net Operating Revenue 685.9 654.5 4.8% ↑ 543.1 26.3% ↑ 2,282.4 1,950.1 17.0% ↑
Selling Expenses / Gross Sales 6.1% 6.7% (0.6 p.p.) ↓ 6.8% (0.7 p.p.) ↓ 6.9% 7.3% (0.4 p.p.) ↓
G&A / Launches 4.1% 4.1% (0.0 p.p.) ↓ 3.1% 0.9 p.p. ↑ 5.5% 4.5% 0.9 p.p. ↑
G&A / Net Operating Revenue 5.3% 6.1% (0.9 p.p.) ↓ 4.8% 0.4 p.p. ↑ 6.4% 6.0% 0.4 p.p. ↑
Off-site
Selling Expenses (0.0) 0.0 0.0% ↑ 0.0 0.0% ↑ (0.0) 0.0 0.0% ↑
General and Administrative Expenses
(G&A)
(2.1) (5.7) (62.3%) ↓ (0.0) 0.0% ↑ (8.0) (0.0) 0.0% ↑
Total SG&A Expenses (2.1) (5.7) (62.2%) ↓ (0.0) 0.0% ↑ (8.0) (0.0) 0.0% ↑
Consolidated
Selling Expenses (52.1) (55.6) (6.3%) ↓ (45.5) 14.7% ↑ (200.6) (162.5) 23.4% ↑
General and Administrative Expenses
(G&A)
(38.3) (45.8) (16.5%) ↓ (26.3) 45.6% ↑ (154.4) (117.1) 31.9% ↑
Total SG&A Expenses (90.4) (101.5) (10.9%) ↓ (71.8) 26.0% ↑ (355.0) (279.6) 27.0% ↑
Gross sales 854.7 836.1 2.2% ↑ 669.4 27.7% ↑ 2,921.0 2,239.4 30.4% ↑
Launches 885.2 984.2 (10.1%) ↓ 835.8 5.9% ↑ 2,665.2 2,575.1 3.5% ↑
Net Operating Revenue 685.9 654.5 4.8% ↑ 543.1 26.3% ↑ 2,282.4 1,950.1 17.0% ↑
Selling Expenses / Gross Sales 6.1% 6.7% (0.6 p.p.) ↓ 6.8% (0.7 p.p.) ↓ 6.9% 7.3% (0.4 p.p.) ↓
G&A / Launches 4.3% 4.7% (0.3 p.p.) ↓ 3.1% 1.2 p.p. ↑ 5.8% 4.5% 1.2 p.p. ↑
G&A / Net Operating Revenue 5.6% 7.0% (1.4 p.p.) ↓ 4.8% 0.7 p.p. ↑ 6.8% 6.0% 0.8 p.p. ↑
16
OTHER OPERATING REVENUES AND EXPENSES
This quarter this line stood at R$21.4 million (+19.2% YoY and +41.4% QoQ). We accelerated legal
settlements for cases that had not received a decision, but with a high probability of loss, which reduced
the Company's possible risk of loss by R$69 million (21% QoQ), as explained in note 17.3. In the year,
other operating income and expenses totaled R$67.0 million (+12% YoY).
(R$ million) 4Q20 3Q20 QoQ (%) 4Q19 YoY (%) 2020 2019 YoY (%)
On-site
Other operating revenues and
expenses
(21.0) (15.0) 39.5% ↑ (17.9) 16.8% ↑ (67.1) (60.5) 11.0% ↑
Litigation expenses (22.5) (12.2) 85.3% ↑ (16.4) 37.6% ↑ (54.9) (39.8) 38.1% ↑
Others 1.6 (2.9) (154.9%) ↓ (1.6) (200.5%) ↓ (12.2) (20.7) (41.1%) ↓
Equity Income (0.4) (0.1) 342.0% ↑ 5.0 107.7% ↑ (0.5) 3.2 114.8% ↑
Off-site
Other operating revenues and
expenses
(0.4) (0.1) 289.8% ↑ (0.0) 1,654.2% ↑ (0.6) (0.0) 2,422.8% ↑
Litigation expenses 0.0 0.0 0.0% ↑ 0.0 0.0% ↑ 0.0 0.0 0.0% ↑
Others (0.4) (0.1) 289.8% ↑ (0.0) 1,654.2% ↑ (0.6) (0.0) 2,422.8% ↑
Equity Income 0.0 0.0 0.0% ↑ 0.0 0.0% ↑ 0.0 0.0 0.0% ↑
Consolidated
Other operating revenues and
expenses
(21.4) (15.1) 41.4% ↑ (18.0) 19.2% ↑ (67.8) (60.5) 12.0% ↑
Litigation expenses (22.5) (12.2) 85.3% ↑ (16.4) 37.6% ↑ (54.9) (39.8) 38.1% ↑
Others 1.1 (3.0) (137.8%) ↓ (1.6) (170.9%) ↓ (12.8) (20.7) (38.1%) ↓
Equity Income (0.4) (0.1) 342.0% ↑ 5.0 107.7% ↑ (0.5) 3.2 114.8% ↑
ADJUSTED EBITDA
In 4Q20, the adjusted EBITDA for the on-site model totaled R$112.8 million and ended 2021 at R$338.7
million, -4.2% YoY. In the consolidated result, Adjusted EBITDA reached R$110.2 million in the quarter
and R$330.0 million in 2020, -6.6% YoY.
(R$ million) 4Q20 3Q20 QoQ (%) 4Q19 YoY (%) 2020 2019 YoY (%)
On-site
Net Income 74.7 76.3 (2.1%) ↓ 76.2 (2.0%) ↓ 209.2 263.5 (20.6%) ↓
(+) Financial Results 7.1 6.7 5.1% ↑ (4.0) 279.2% ↑ 23.1 (8.7) 364.4% ↑
(+) Income taxes and social
contribution
13.0 11.0 18.0% ↑ 10.4 24.6% ↑ 41.9 35.1 19.2% ↑
(+) Depreciation and Amortization 6.0 5.8 4.1% ↑ 5.7 5.0% ↑ 22.2 20.4 8.5% ↑
(+) Capitalized interests 6.9 5.0 38.6% ↑ 8.6 (19.6%) ↓ 24.2 33.6 (28.0%) ↓
(+) Expenses with Stock Option Plan 6.0 6.0 (0.3%) ↓ 2.9 106.4% ↑ 18.7 8.7 116.5% ↑
(+) Minority Shareholders (0.9) 0.5 (285.0%) ↓ 0.1 (1.804%) ↓ (0.6) 0.9 (168.7%) ↓
Adjusted EBITDA¹ 112.8 111.4 1.3% ↑ 99.9 12.9% ↑ 338.7 353.5 (4.2%) ↓
Net Revenue 685.9 654.5 4.8% ↑ 543.1 26.3% ↑ 2.282.4 1.950.1 17.0% ↑
Adjusted EBITDA Margin¹ 16.4% 17.0% (0.6 p.p.) ↓ 18.4% (2.0 p.p.) ↓ 14.8% 18.1% (3.3 p.p.) ↓
Off-site
Net Income (2.7) (5.8) 53.1% ↑ 0.0 0.0% ↑ (8.9) 0.0 (0.0% ↑
(+) Financial Results (0.0) (0.0) (120.1%) ↓ (0.1) 88.6% ↑ (0.0) (0.1) 37.0% ↑
(+) Depreciation and Amortization 0.2 0.0 236.1% ↑ 0.0 0.0% ↑ 0.3 0.0 0.0% ↑↑
Adjusted EBITDA¹ (2.6) (5.8) 55.3% ↑ (0.0) (0.0%) ↓ (8.6) (0.0) (0.0%) ↓
Net Revenue 0.0 0.0 0.0% ↑ 0.0 0.0% ↑ 0.0 0.0 0.0% ↑
Adjusted EBITDA Margin¹ 0.0% 0.0% 0.0 p.p. 0.0% 0.0 p.p. 0.0% 0.0% 0.0 p.p.
Consolidated
Net Income 72.0 70.5 2.1% ↑ 76.2 (5.6%) ↓ 200.3 263.5 (24.0%) ↓
(+) Financial Results 7.1 6.7 5.0% ↑ (4.0) 276.2% ↑ 23.1 (8.8) 362.1% ↑
(+) Income taxes and social
contribution
13.0 11.0 18.0% ↑ 10.4 24.6% ↑ 41.9 35.1 19.2% ↑
(+) Depreciation and Amortization 6.2 5.8 5.9% ↑ 5.8 7.2% ↑ 22.5 20.5 9.7% ↑
(+) Capitalized interests 6.9 5.0 38.6% ↑ 8.6 (19.6%) ↓ 24.2 33.6 (28.0%) ↓
(+) Expenses with Stock Option Plan 6.0 6.0 (0.3%) ↓ 2.9 106.4% ↑ 18.7 8.7 116.5% ↑
(+) Minority Shareholders (0.9) 0.5 (285.0%) ↓ 0.1 (1.804%) ↓ (0.6) 0.9 (168.7%) ↓
Adjusted EBITDA¹ 110.2 105.6 4.4% ↑ 99.9 10.3% ↑ 330.0 353.5 (6.6%) ↓
Net Revenue 685.9 654.5 4.8% ↑ 543.1 26.3% ↑ 2.282.4 1.950.1 17.0% ↑
Adjusted EBITDA Margin¹ 16.1% 16.1% (0.1 p.p.) ↓ 18.4% (2.3 p.p.) ↓ 14.5% 18.1% (3.7 p.p.) ↓
1. Adjusted by capitalized interests, expenses with action plans (non-cash) and Minority Shareholders.
17
FINANCIAL RESULTS
The company ended this quarter with a negative financial result of R$7.1 million, in which R$23.1 million
is negative year to date. Lower net cash position and drop in Selic rate reduced the profitability of
investments (benchmark 100% CDI) that failed to match the cost of debt, which increased with the
additional debt incurred as a consequence of the pandemic.
(R$ million) 4Q20 3Q20 QoQ (%) 4Q19 YoY (%) 2020 2019 YoY (%)
Consolidated
Financial Revenues 7.0 6.1 15.6% ↑ 16.7 (58.2%) ↓ 32.6 61.2 (46.8%) ↓
Financial Expenses (14.1) (12.8) 10.0% ↑ (12.7) 10.6% ↑ (55.6) (52.4) 6.1% ↑
Financial Results (7.1) (6.7) (5.0%) ↓ 4.0 (276.2%) ↓ (23.1) 8.8 (362.1%) ↓
NET INCOME
In 4Q20, the on-site model recorded net income of R$74.7 million (-2.0% YoY and -2.1% QoQ) ending
2020 at R$209.2 million (-20.6 % YoY). In consolidated terms, net income for the quarter totaled R$72.0
million (-5.6% YoY and +2.1% QoQ), and R$200.3 million (-24.0 YoY) in 2020.
Earnings per share (ex-treasury) totaled R$2.04 (-25.1% YoY) in 2020.
(R$ million) 4Q20 3Q20 QoQ (%) 4Q19 YoY (%) 2020 2019 YoY (%)
On-site
Net Income after Income Tax and
Social Contribution
73.8 76.8 (3.9%) ↓ 76.2 (3.2%) ↓ 208.6 264.4 (21.1%) ↓
(-) Minority Shareholders 0.9 (0.5) 285.0% ↑ (0.1) 1.803.8% ↑ 0.6 (0.9) 168.7% ↑
Net Income 74.7 76.3 (2.1%) ↓ 76.2 (2.0%) ↓ 209.2 263.5 (20.6%) ↓
Net Margin 10.9% 11.7% (0.8 p.p.) ↓ 14.0% (3.1 p.p.) ↓ 9.2% 13.5% (4.3 p.p.) ↓
Off-site
Net income after Income Tax and
Social Contribution
(2.7) (5.8) 53.1% ↑ 0.0 (0.0%) ↓ (8.9) 0.0 (0.0%) ↓
(-)Minority Shareholders 0.0 0.0 0.0% ↑ 0.0 0.0% ↑ 0.0 0.0 0.0% ↑
Net Income (2.7) (5.8) 53.1% ↑ 0.0 (0.0%) ↓ (8.9) 0.0 (0.0%) ↓
Net Margin 0.0% 0.0% 0.0 p.p. 0.0% 0.0 p.p. 0.0% 0.0% 0.0 p.p.
Consolidated
Net income after Income Tax and
Social Contribution
71.0 71.0 0.1% ↑ 76.2 (6.8%) ↓ 199.7 264.4 (24.5%) ↓
(-)Minority Shareholders 0.9 (0.5) 285.0% ↑ (0.1) 1.803.8% ↑ 0.6 (0.9) 168.7% ↑
Net Income 72.0 70.5 2.1% ↑ 76.2 (5.6%) ↓ 200.3 263.5 (24.0%) ↓
Net Margin 10.5% 10.8% (0.3 p.p.) ↓ 14.0% (3.5 p.p.) ↓ 8.8% 13.5% (4.7 p.p.) ↓
Earnings per Share¹ (LTM) (R$/share) 1.92 1.96 (2.1%) ↓ 2.53 (24.0%) ↓ 1.92 2.53 (24.0%) ↓
Earnings per Share² (LTM) (R$/share)
(ex-Treasury)
2.04 2.09 (2.5%) ↓ 2.73 (25.1%) ↓ 2.04 2.73 (25.1%) ↓
1. Earnings per share considers all issued shares (adjusted for stock splits).
2. Earnings per share (ex-Treasury) considers the issued shares (adjusted for stock splits) and does not consider shares held in Treasury at the end of the period.
ROE (%, 12 months) and ROIC (%, 12 months) - Consolidated
ROE (12 months) ROIC (12 months)
18
BACKLOG RESULTS
We ended 2020 with a Backlog Margin of 35.2% (-4.0 p.p. YoY and -1.1 p.p. QoQ). In addition to the loss
of productivity in the construction sites that were paralyzed in the first half due to the pandemic, the
sector has also been under pressure with increased material costs reflected in the new harvests of
construction sites.
(R$ million) December 20 September 20 QoQ (%) December 19 YoY (%)
On-site
Backlog Revenues 949.5 745.3 27.4% ↑ 555.2 71.0% ↑
Backlog Costs (of Units Sold) (615.6) (474.9) 29.6% ↑ (337.6) 82.3% ↑
Backlog Results¹ 333.9 270.4 23.5% ↑ 217.7 53.4% ↑
Backlog Margin 35.2% 36.3% (1.1 p.p.) ↓ 39.2% (4.0 p.p.) ↓
1. Includes the projects restricted under a supersedeas clause.
Off-site operation values are not provided yet.
CASH AND SHORT-TERM INVESTMENTS
(R$ million) December 20 September 20 QoQ (%) December 19 YoY (%)
Consolidated
Cash and cash equivalents 69.7 25.1 177.5% ↑ 48.4 44.2% ↑
Short-term investments 1,235.7 1,377.7 (10.3%) ↓ 1,022.1 20.9% ↑
Total Cash Positions 1,305.5 1,402.8 (6.9%) ↓ 1,070.5 22.0% ↑
ACCOUNTS RECEIVABLE
The Company totaled R$911.8 million in accounts receivable at the end of 2020, an increase of 45.9%
YoY and 14.3% QoQ due to the record sales reported.
(R$ million) December 20 September 20 QoQ (%) December 19 YoY (%)
On-site
Up to 2020¹ 84.8 748.3 (88.7%) ↓ 530.4 (84.0%) ↓
2021 622.5 110.6 462.7% ↑ 155.6 300.0% ↑
2022 300.5 55.4 442.3% ↑ 61.9 385.4% ↑
2023 42.9 33.5 28.3% ↑ 22.5 90.9% ↑
2024 32.4 44.4 (27.0%) ↓ 26.0 24.6% ↑
2025 onwards 37.3 0.0 0.0% ↑ 0.0 0.0% ↑
Total Accounts Receivable 1,120.6 992.3 12.9% ↑ 796.5 40.7% ↑
(-) Present value adjustment (5.2) (4.5) (15.5%) ↓ (7.4) 29.9% ↑
(-) Provision for doubtful accounts (174.4) (161.4) (8.1%) ↓ (118.2) (47.5%) ↓
(-) Provision for cancellations (29.2) (28.5) (2.4%) ↓ (45.7) 36.2% ↑
Accounts Receivable 911.8 797.9 14.3% ↑ 625.1 45.9% ↑
Days of Accounts Receivable 146 136 7.1% ↑ 117 24.6% ↑
1. Overdue and falling due.
Off-site operation values are not provided yet.
19
TENDA'S RECEIVABLES
Tenda's receivables portfolio (on and off balance, Tenda's risk) net of provision, increased by 17.1% QoQ
and 54.3% YoY, reflecting its good performance in sales.
Several initiatives related to collection activities led to an improvement in the default indicators, which
allowed for a reduction in the coverage ratio of of provision for the after-delivery portfolio, which
changed from 24.7% in 3Q20 to 22.9% in 4Q20.
Receivables Tenda¹ (R$ million) 4Q20 3Q20 QoQ (%) 4Q19 YoY (%)
Gross Receivables 560.2 489.3 14.5% ↑ 389.3 43.9% ↑
Installments Before Delivery 86.2 70.8 21.7% ↑ 62.7 37.4% ↑
Installments After Delivery 474.0 418.5 13.3% ↑ 326.6 45.1% ↑
Net Receivables 451.0 385.1 17.1% ↑ 292.3 54.3% ↑
Installments Before Delivery 85.4 70.2 21.7% ↑ 62.2 37.2% ↑
Installments After Delivery 365.6 314.9 16.1% ↑ 230.0 59.0% ↑
Receivables Tenda¹ (por aging. after delivery) 4Q20 3Q20 QoQ (%) 4Q19 YoY (%)
Net Receivables Tenda (R$ million) 365.6 314.9 16.1% ↑ 230.0 59.0% ↑
Not Delivered² 175.6 133.6 31.4% ↑ 65.2 169.3% ↑
Delivered. current 133.9 133.5 0.3% ↑ 123.5 8.4% ↑
Delivered. <90d Overdue 40.6 34.0 19.3% ↑ 30.6 32.6% ↑
Delivered. >90d Overdue 15.6 13.9 12.3% ↑ 10.7 45.3% ↑
% of Allowances over Total Receivables Tenda 22.9% 24.7% (1.9 p.p.) ↓ 29.6% (6.7 p.p.) ↓
Not Delivered² 11.7% 13.4% (1.7 p.p.) ↓ 17.8% (6.1 p.p.) ↓
Delivered. current 0.9% 1.0% (0.1 p.p.) ↓ 1.6% (0.7 p.p.) ↓
Delivered. <90d Overdue 9.6% 10.1% (0.5 p.p.) ↓ 16.8% (7.2 p.p.) ↓
Delivered. >90d Overdue 83.6% 84.9% (1.2 p.p.) ↓ 87.4% (3.8 p.p.) ↓
1. On and off-balance receivables with installment payments directly to the Company since the bank loan does not absorb 100% of the property value.
2. Projects not delivered have installments payment before and after delivery. The allowances over total receivable Tenda are just installments payment after delivery.
20
INDEBTEDNESS
We ended the year with a total debt of R$1.157 billion, in line with the previous quarter. It has been 16.5
months with nominal average cost of 4.0% annual percentage yield.
Debt Maturity Schedule (R$ million) 4Q20
Bank
Debt
Corporate
Debt
Project Finance
(SFH)
Consolidated
2021 599.7 175.6 424.1 0.0
2022 218.4 118.9 99.5 0.0
2023 210.3 35.8 174.5 0.0
2024 128.7 4.2 124.6 0.0
2025 onwards 0.0 0.0 0.0 0.0
Total Debt 1,157.1 334.5 822.6 0.0
Duration (in months) 16.5
Debt Breakdown (R$ million) Maturity Charges (APY)
Balance Due
December 20
Balance Due
September 20
Consolidated
Total Debt 1,157.1 1,152.9
Bank Debt up to 03/2024 CDI + 3.15% 334.5 334.3
Corporate Debt 822.6 818.5
CRI Tenda up to 01/2021 CDI + 0.90% 321.2 318.1
DEB TEND14 up to 09/2023 CDI + 1.75% 151.7 150.3
DEB TEND15 up to 03/2024 CDI + 1.40% 150.9 149.7
DEB TEND16 up to 12/2024 CDI + 1.30% 198.8 200.5
Weighted Average Cost of Debt (R$ million)
Balance Due
December 20
Balance Due /
Total Debt
Average Cost
(APY)
Consolidated
CDI 1,157.1 100.0% CDI + 1.8%
TR 0.0 0.0% TR + 8.3%
Total 1,157.1 100% 4.0%
RATING
Standard & Poor’s (“S&P”) maintains Tenda's corporate credit rating at brAA+ with a positive outlook.
21
NET DEBT
The net debt to equity ratio ended the year at 9.8% negative, within the limit of -10% to + 10% as
established by the company.
(R$ million) December 20 September 20 QoQ (%) December 19 YoY (%)
Consolidated
Gross Debt 1,157.1 1,152.1 0.4% ↑ 870.4 32.9% ↑
(-) Cash and cash equivalents / financial
investments
(1,305.5) (1,402.8) (6.9%) ↓ (1,070.5) 22.0% ↑
Net Debt (148.3) (250.7) 40.8% ↑ (200.0) 25.8% ↑
Shareholders’ Equity + Minority Shareholders
(SE+MS)
1,518.1 1,480.5 2.5% ↑ 1,351.7 12.3% ↑
Net Debt / Equity (SE+MS) (9.8%) (16.9%) 7.2 p.p. ↑ (14.8%) 5.0 p.p. ↑
Adjusted EBITDA (LTM) 330.0 319.8 3.2% ↑ 353.5 (6.6%) ↓
CASH GENERATION AND CAPITAL DISTRIBUTION
In 2020, Tenda's operating cash generation totaled R$70 million. In 4Q20, the Company accelerated
some construction sites to off-set the readjustments in material costs, thus consuming R$54.3 million
this quarter.
In 4Q20, we opened a new stock buyback plan that amounted to R$5.3 million. Throughout 2020, Tenda
distributed R$53.9 million to its shareholders that included dividends paid and stock buyback,
equivalent to a payout of 26.9%.
(R$ million) 4Q20 3Q20 QoQ (%) 4Q19 YoY (%)
Consolidated
Stock buyback 5.3 0.0 0.0% ↑ (0.3) 2.065.4% ↑
Dividends paid 30.5 18.1 68.5% ↑ 15.4 98.4% ↑
Capital Distribution 35.8 18.1 97.7% ↑ 15.1 137.0% ↑
(R$ million. last 12 months) 4Q20 3Q20 QoQ (%) 4Q19 YoY (%)
Consolidated
Stock buyback 5.3 (0.3) 2.065.4% ↑ 62.2 (91.5%) ↓
Dividends paid 48.6 33.5 45.2% ↑ 57.8 (15.9%) ↓
Capital Distribution 53.9 33.2 62.3% ↑ 120.0 (55.1%) ↓
(R$ million) December 20 September 20 QoQ (%) December 19 YoY (%)
Consolidated
Change in Available Cash (97.4) (132.1) 26.3% ↑ 94.1 (203.4%) ↓
(-) Change in Gross Debt 5.0 (195.1) 102.5% ↑ 125.6 (96.0%) ↓
(+) Capital Distribution 35.8 18.1 97.7% ↑ 15.1 137.0% ↑
Cash Generation¹ (66.6) 81.1 (182.1%) ↓ (16.4) (305.9%) ↓
Operating Cash Generation² (54.3) 111.5 (148.7%) ↓ (12.5) (332.5%) ↓
On-site (44.7) 119.3 (137.4%) ↓ (11.3) (296.8%) ↓
Off-site (9.6) (7.8) (23.3%) ↓ (1.3) (645.5%) ↓
(R$ million) 2020 2019 QoQ (%)
Consolidated
Change in Available Cash 235.0 214.9 9.4% ↑
(-) Change in Gross Debt 286.7 327.9 (12.6%) ↓
(+) Capital Distribution 53.9 120.0 (55.1%) ↓
Cash Generation¹ 2.2 6.9 (68.4%) ↓
Operating Cash Generation² 70.0 21.6 223.9% ↑
On-site 97.7 24.5 286.1% ↑
Off-site (27.7) (2.8) 0.0% ↑
1. Cash Generation is obtained through the difference between the change in Available Cash and the change in Gross Debt, adjusted to the amounts of Stock Buyback, Dividends paid, Capital
Reduction and non-operating effects.
2. Operating Cash Generation is a result of the company’s managerial calculation which neither reflects nor is compared with the figures reported in the financial statements.
22
INCOME STATEMENT
(R$ million) 4Q20 3Q20 QoQ (%) 4Q19 YoY (%) 2020 2019 YoY (%)
On-site
Net Revenue 685.9 654.5 4.8% ↑ 543.1 26.3% ↑ 2,282.4 1,950.1 17.0% ↑
Operating Costs (476.4) (443.2) 7.5% ↑ (370.1) 28.7% ↑ (1,572.0) (1,302.0) 20.7% ↑
Gross Profit 209.5 211.3 (0.8%) ↓ 173.1 21.0% ↑ 710.4 648.1 9.6% ↑
Gross Margin 30.5% 32.3% (1.7 p.p.) ↓ 31.9% (1.3 p.p.) ↓ 31.1% 33.2% (2.1 p.p.) ↓
Operating Expenses (115.6) (116.7) (0.9%) ↓ (90.4) 27.9% ↑ (436.8) (357.3) 22.3% ↑
Selling Expenses (52.1) (55.6) (6.3%) ↓ (45.5) 14.7% ↑ (200.6) (162.5) 23.4% ↑
G&A Expenses (36.1) (40.2) (10.1%) ↓ (26.3) 37.4% ↑ (146.4) (117.1) 25.0% ↑
Other Operating
Expenses/Revenue
(21.0) (15.0) 39.5% ↑ (17.9) 16.8% ↑ (67.1) (60.5) 11.0% ↑
Depreciation and Amortization (6.0) (5.8) 4.1% ↑ (5.7) 5.0% ↑ (22.2) (20.4) 8.5% ↑
Equity Income (0.4) (0.1) (342.0%) ↓ 5.0 (107.7%) ↓ (0.5) 3.2 (114.8%) ↓
Operational Result 93.8 94.6 (0.7%) ↓ 82.7 13.5% ↑ 273.6 290.8 (5.9%) ↓
Financial Revenue 7.0 6.0 15.5% ↑ 16.7 (58.3%) ↓ 32.5 61.2 (46.9%) ↓
Financial Expenses (14.1) (12.8) 10.0% ↑ (12.8) 10.1% ↑ (55.6) (52.5) 6.0% ↑
Net Income before taxes on
income tax and social contribution
86.8 87.8 (1.2%) ↓ 86.6 0.1% ↑ 250.4 299.5 (16.4%) ↓
Deferred taxes (2.4) 0.6 (496.9%) ↓ (0.6) (308.2%) ↓ (4.6) (3.9) (19.7%) ↓
Income Taxes and Social
Contribution
(10.5) (11.6) (9.2%) ↓ (9.8) 7.4% ↑ (37.2) (31.3) 19.1% ↑
Net Income after taxes on income
tax and social contribution
73.8 76.8 (3.9%) ↓ 76.2 (3.2%) ↓ 208.6 264.4 (21.1%) ↓
(-) Minority Shareholders 0.9 (0.5) 285.0% ↑ (0.1) 1,803.8% ↑ 0.6 (0.9) 168.7% ↑
Net Income 74.7 76.3 (2.1%) ↓ 76.2 (2.0%) ↓ 209.2 263.5 (20.6%) ↓
Off-site
Net Revenue 0.0 0.0 0.0% ↑ 0.0 0.0% ↑ 0.0 0.0 0.0% ↑
Operating Costs 0.0 0.0 0.0% ↑ 0.0 0.0% ↑ 0.0 0.0 0.0% ↑
Gross Profit 0.0 0.0 0.0% ↑ 0.0 0.0% ↑ 0.0 0.0 0.0% ↑
Gross Margin 0.0% 0.0% 0.0 p.p. 0.0% 0.0 p.p. 0.0% 0.0% 0.0 p.p.
Operating Expenses (2.7) (5.8) (53.0%) ↓ (0.1) 0.0% ↑ (8.9) (0.1) 0.0% ↑
Selling Expenses (0.0) 0.0 0.0% ↑ 0.0 0.0% ↑ (0.0) 0.0 0.0% ↑
G&A Expenses (2.1) (5.7) (62.3%) ↓ (0.0) 0.0% ↑ (8.0) (0.0) 0.0% ↑
Other Operating
Expenses/Revenue
(0.4) (0.1) 289.8% ↑ (0.0) 0.0% ↑ (0.6) (0.0) 0.0% ↑
Depreciation and Amortization (0.2) (0.0) 236.1% ↑ (0.0) 0.0% ↑ (0.3) (0.0) 0.0% ↑
Equity Income 0.0 0.0 0.0% ↑ 0.0 0.0% ↑ 0.0 0.0 0.0% ↑
Operational Income/Result (2.7) (5.8) 53.0% ↑ (0.1) 0.0% ↑ (8.9) (0.1) 0.0% ↑
Financial Revenue 0.0 0.0 63.6% ↑ 0.0 0.0% ↑ 0.0 0.0 0.0% ↑
Financial Expenses (0.0) (0.0) 6.7% ↑ 0.1 105.7% ↑ (0.0) 0.1 0.0% ↑
Net Income before taxes on
income tax and social contribution
(2.7) (5.8) 53.1% ↑ 0.0 0.0% ↑ (8.9) 0.0 0.0% ↑
Deferred taxes 0.0 0.0 0.0% ↑ 0.0 0.0% ↑ 0.0 0.0 0.0% ↑
Income Taxes and Social
Contribution
0.0 0.0 0.0% ↑ 0.0 0.0% ↑ 0.0 0.0 0.0% ↑
Net Income after taxes on income
tax and social contribution
(2.7) (5.8) 53.1% ↑ 0.0 0.0% ↑ (8.9) 0.0 0.0% ↑
(-) Minority Shareholders 0.0 0.0 0.0% ↑ 0.0 0.0% ↑ 0.0 0.0 0.0% ↑
Net Income (2.7) (5.8) 53.1% ↑ 0.0 0.0% ↑ (8.9) 0.0 0.0% ↑
Consolidated
Net Revenue 685.9 654.5 4.8% ↑ 543.1 26.3% ↑ 2,282.4 1,950.1 17.0% ↑
Operating Costs (476.4) (443.2) 7.5% ↑ (370.1) 28.7% ↑ (1,572.0) (1,302.0) 20.7% ↑
Gross Profit 209.5 211.3 (0.8%) ↓ 173.1 21.0% ↑ 710.4 648.1 9.6% ↑
Gross Margin 30.5% 32.3% (1.7 p.p.) ↓ 31.9% (1.3 p.p.) ↓ 31.1% 33.2% (2.1 p.p.) ↓
Operating Expenses (118.4) (122.6) (3.4%) ↓ (90.4) 30.9% ↑ (445.7) (357.3) 24.7% ↑
Selling Expenses (52.1) (55.6) (6.3%) ↓ (45.5) 14.7% ↑ (200.6) (162.5) 23.4% ↑
G&A Expenses (38.3) (45.8) (16.5%) ↓ (26.3) 45.6% ↑ (154.4) (117.1) 31.9% ↑
Other Operating
Expenses/Revenue
(21.4) (15.1) 41.4% ↑ (18.0) 19.2% ↑ (67.8) (60.5) 12.0% ↑
Depreciation and Amortization (6.2) (5.8) 5.9% ↑ (5.8) 7.2% ↑ (22.5) (20.5) 9.7% ↑
Equity Income (0.4) (0.1) (342.0%) ↓ 5.0 (107.7%) ↓ (0.5) 3.2 (114.8%) ↓
Operational Income/Result 91.1 88.7 2.7% ↑ 82.6 10.2% ↑ 264.6 290.7 (9.0%) ↓
Financial Revenue 7.0 6.1 15.6% ↑ 16.7 (58.2%) ↓ 32.6 61.2 (46.8%) ↓
Financial Expenses (14.1) (12.8) 10.0% ↑ (12.7) 10.6% ↑ (55.6) (52.4) 6.1% ↑
Net Income before taxes on
income tax and social contribution
84.0 82.0 2.5% ↑ 86.7 (3.0%) ↓ 241.6 299.5 (19.3%) ↓
Deferred taxes (2.4) 0.6 (496.9%) ↓ (0.6) (308.2%) ↓ (4.6) (3.9) (19.7%) ↓
Income Taxes and Social
Contribution
(10.5) (11.6) (9.2%) ↓ (9.8) 7.4% ↑ (37.2) (31.3) 19.1% ↑
Net Income after taxes on income
tax and social contribution
71.0 71.0 0.1% ↑ 76.2 (6.8%) ↓ 199.7 264.4 (24.5%) ↓
(-) Minority Shareholders 0.9 (0.5) 285.0% ↑ (0.1) 1,803.8% ↑ 0.6 (0.9) 168.7% ↑
Net Income 72.0 70.5 2.1% ↑ 76.2 (5.6%) ↓ 200.3 263.5 (24.0%) ↓
23
BALANCE SHEET
(R$ million) December 20 September 20 QoQ (%) December 19 YoY (%)
Consolidated
Current Assets 2, 758.9 3,053.2 (9.6%) ↓ 2,506.4 10.1% ↑
Cash and cash equivalents 69.7 25.1 177.5% ↑ 48.4 44.2% ↑
Securities 1,235.7 1,377.7 (10.3%) ↓ 1,022.1 20.9% ↑
Receivables from clients 563.0 539.9 4.3%) ↓ 406.6 38.5% ↑
Properties for sale 777.7 1,015.5 (23.4%) ↓ 955.6 (18.6%) ↓
Other accounts receivables 112.8 95.0 18.6% ↑ 73.7 52.9% ↑
Non-Current Assets 1,292.6 906.6 42.6% ↑ 827.6 56.2% ↑
Receivables from Clients 348.8 258.0 35.2% ↑ 218.5 59.6% ↑
Properties for Sale 875.2 580.9 50.7% ↑ 537.0 63.0% ↑
Others 68.6 67.7 1.2% ↑ 72.1 (4.9%) ↓
Intangibles and Property and Equipment 143.2 107.1 33.8% ↑ 101.9 40.6% ↑
Investments 42.0 42.5 (1.2%) ↓ 42.6 (1.4%) ↓
Total Assets 4,236.7 4,109.4 3.1% ↑ 3,478.5 21.8% ↑
Current Liabilities 1,216.4 1,043.5 16.6% ↑ 579.0 110.1% ↑
Loans and financing 175.6 108.4 62.0% ↑ 8.5 1,961.9% ↑
Debentures 424.1 370.1 14.6% ↑ 5.6 7,475.0% ↑
Land obligations and customers’ advances 370.8 267.9 38.4% ↑ 340.9 8.8% ↑
Material and Service Suppliers 38.2 84.9 (55.1%) ↓ 38.9 (2.0%) ↓
Taxes and Contributions 23.6 29.3 (19.6%) ↓ 30.0 (21.6%) ↓
Others 184.2 182.8 0.7% ↑ 155.0 18.8% ↑
Non-current liabilities 1,502.2 1,585.4 (5.2%) ↓ 1,547.8 (2.9%) ↓
Loans and financing 158.9 225.2 (29.4%) ↓ 51.5 208.6% ↑
Debentures 398.5 448.4 (11.1%) ↓ 804.8 (50.5%) ↓
Land obligations and customers’ advances 806.6 824.8 (2.2%) ↓ 602.4 33.9% ↑
Deferred taxes 15.7 14.0 12.0% ↑ 11.8 32.7% ↑
Provision for Contingencies 32.3 27.6 17.0% ↑ 28.7 12.7% ↑
Other creditors 0.0 0.0 0.0% ↑ 0.0 0.0% ↑
Others 90.2 45.4 98.7% ↑ 48.6 85.5% ↑
Total Shareholders’ Equity 1,518.1 1,480.5 2.5% ↑ 1,351.7 12.3% ↑
Shareholders’ equity 1,517.6 1,479.1 2.6% ↑ 1,350.6 12.4% ↑
Minority shareholders 0.5 1.4 (64.8%) ↓ 1.1 (54.9%) ↓
Total Liabilities and Shareholders’ Equity 4,236.7 4,109.4 3.1% ↑ 3,478.5 21.8% ↑
24
CASH FLOW STATEMENT
(R$ million) 4Q20 3Q20 QoQ (%) 4Q19 YoY (%) 2020 2019 YoY (%)
Consolidated
Cash from (used in) operating activities (48.6) 94.2 (151.6%) ↓ (0.1)
(78,325.8%)
↓
94.4 68.8 36.6% ↑
Net Income (Loss) before taxes 84.0 82.0 2.5% ↑ 86.7 (3.0%) ↓ 241.6 299.5 (19.3%) ↓
Expenses/revenues causing no impact
on working capital
0.0 0.0 0.0% ↑ 0.0 0.0% ↑ 0.0 0.0 0.0% ↑
Depreciation and amortization 3.2 9.6 (66.5%) ↓ 9.0 (64.1%) ↓ 30.1 31.7 (5.0%) ↓
Provision (reversal) for doubtful
accounts and cancellations
15.0 (6.3) 337.8% ↑ 8.7 71.5% ↑ 41.5 11.3 265.7% ↑
Present value adjustment 0.7 (1.6) 143.6% ↑ 0.9 (22.4%) ↓ (2.2) (2.6) 14.7% ↑
Impairment 2.0 (2.6) 180.2% ↑ (3.1) 166.8% ↑ (1.0) (6.0) 82.6% ↑
Equity Income 0.4 0.1 342.0% ↑ (5.0) 107.7% ↑ 0.5 (3.2) 114.8% ↑
Provision for contingencies 10.2 (3.7) 375.2% ↑ 3.5 191.4% ↑ 9.5 (4.9) 294.4% ↑
Unrealized interests and charges, net (1.2) 9.5 (112.7%) ↓ 4.6 (126.5%) ↓ 32.9 16.8 96.0% ↑
Warranty provision 18.7 1.6 1,077.5% ↑ 4.4 326.6% ↑ 21.4 6.5 232.1% ↑
Profit sharing provision (1.0) 1.9 (153.3%) ↓ 1.8 (154.6%) ↓ 12.3 15.0 (17.7%) ↓
Stock option plan expenses 6.0 6.0 (0.3%) ↓ 2.9 106.4% ↑ 18.7 8.7 116.5% ↑
Write-off of property and equipment
and intangible
8.7 (3.2) 370.9% ↑ 0.0 0.0% ↑ 5.5 0.0 0.0% ↑
Other provisions (2.5) (0.7) (255.7%) ↓ (0.5) (356.9%) ↓ (3.4) (1.6) (105.4%) ↓
Leasing 0.0 (4.5) 100.0% ↑ 0.0 0.0% ↑ 0.0 0.0 0.0% ↑
Deferred taxes (11.6) (1.3) (760.2%) ↓ (0.3) (4,227.0%) ↓ (9.7) 0.8
(1.394.0%)
↓
Clients (128.3) (39.8) (222.1%) ↓ (15.7) (717.4%) ↓ (324.1) (165.2) (96.2%) ↓
Properties for sale (66.5) (31.5) (111.1%) ↓ (179.5) 63.0% ↑ (139.0) (422.4) 67.1% ↑
Other accounts receivable (13.0) (4.6) (183.1%) ↓ (27.6) 52.8% ↑ (29.2) (49.1) 40.6% ↑
Suppliers (46.8) 31.1 (250.4%) ↓ (21.0) (122.7%) ↓ (0.8) 17.5 (104.4%) ↓
Taxes and contributions 0.2 (10.3) 102.3% ↑ 1.4 (83.4%) ↓ (2.4) 2.2 (208.6%) ↓
Salaries, payroll charges and bonus
provision
(16.9) 9.8 (272.9%) ↓ (7.1) (136.4%) ↓ (5.7) (10.8) 47.2% ↑
Obligations for purchase of real estate
properties
86.1 65.5 31.5% ↑ 140.7 (38.8%) ↓ 212.6 353.3 (39.8%) ↓
Other accounts payable 14.8 5.9 151.6% ↑ 4.0 267.6% ↑ 21.9 1.0 2.054.3% ↑
Current account operations (0.0) 0.4 (112.8%) ↓ (0.2) 76.2% ↑ 0.6 0.7 (25.1%) ↓
Taxes paid (11.0) (18.9) 41.8% ↑ (8.6) (27.6%) ↓ (37.7) (30.3) (24.5%) ↓
Cash from (used in) investment
activities, net
138.6 121.0 14.6% ↑ (110.9) 225.0% ↑ (249.8) (209.2) (19.4%) ↓
Investment activities 0.0 0.0 0.0% ↑ 0.0 0.0% ↑ 0.0 0.0 0.0% ↑
Purchase of property and equipment (8.4) (12.7) 34.1% ↑ (12.0) 29.8% ↑ (46.6) (44.8) (3.9%) ↓
Investments/redemption of securities 155.8 133.7 16.5% ↑ (98.9) 257.4% ↑ (194.4) (164.3) (18.3%) ↓
Increase in investments (0.1) 0.0 0.0% ↑ 0.0 0.0% ↑ (0.1) 0.0 0.0% ↑
Dividends received 0.0 0.0 0.0% ↑ 0.0 0.0% ↑ 0.0 0.0 0.0% ↑
Cash from (used in) financing activities,
net
(45.4) (216.2) 79.0% ↑ 100.4 (145.2%) ↓ 177.2 154.4 14.8% ↑
Stock Buyback (5.3) 0.0 0.0% ↑ 0.3 (2,065.4%) ↓ (5.3) (62.2) 91.5% ↑
Capital Increase 0.0 0.0 0.0% ↑ 0.0 0.0% ↑ 0.0 0.0 0.0% ↑
Capital Reserve Increase (0.3) 9.1 (103.0%) ↓ 1.4 (119.9%) ↓ 0.8 5.5 (85.3%) ↓
Dividends Paid (30.5) (18.1) (68.5%) ↓ (15.4) (98.4%) ↓ (48.6) (57.8) 15.9% ↑
Loans and financing increase 0.8 57.8 (98.7%) ↓ 202.1 (99.6%) ↓ 648.7 693.5 (6.5%) ↓
Amortization of loans and financing (7.8) (263.9) 97.0% ↑ (86.6) 91.0% ↑ (413.0) (418.0) 1.2% ↑
Lease payments (2.1) (0.9) (125.7%) ↓ (0.9) (127.7%) ↓ (4.8) (3.8) (28.1%) ↓
Loan operations (0.2) (0.2) 3.3% ↑ (0.5) 56.8% ↑ (0.6) (2.9) 78.6% ↑
Net increase (decrease) in cash and cash
equivalents
44.6 (0.9) 4,800.5% ↑ (10.6) 522.8% ↑ 21.4 14.1 52.0% ↑
At the beginning of the period 25.1 26.1 (3.6%) ↓ 58.9 (57.3%) ↓ 48.4 34.3 41.0% ↑
At the end of the period 69.7 25.1 177.5% ↑ 48.4 44.2% ↑ 69.7 48.4 44.2% ↑
25
INVESTOR RELATIONS
Renan Barbosa Sanches
CFO and Investor Relations Officer
Alvaro Kaue
Investor Relations Manager
Bruno Souza
Investor Relations Specialist
Investor Relations
Tel.: +55 (11) 3111-9909
E-mail: ri@tenda.com
Website: ri.tenda.com
MEDIA RELATIONS
NOVAPR
Marilia Paiotti
Tel.: +55 (11) 5180-9079
E-mail: marilia.paiotti@novapr.com.br
ABOUT TENDA
Tenda (B3: TEND3), one of the main
homebuilders in Brazil, is listed under Novo
Mercado, B3’s highest corporate governance
level. With a focus on affordable housing, it
concentrates its activities in nine
metropolitan areas of Brazil, with projects
aimed within the bracket 2 of “Programa Casa
Verde e Amarela” (PCVA) federal government
housing program.

021148000101011 (5)

  • 1.
    Em ano derecordes operacionais, receita líquida cresceu 17,0% a/a atingindo R$ 2,3 bilhões, lucro bruto de R$ 710,4 milhões (+9,6% a/a) com redução do lucro líquido contabilizando R$ 200,3 milhões (-24,0% a/a)
  • 2.
    2 São Paulo, 11de março de 2021 – Construtora Tenda S.A. (“Companhia”, “Tenda”), uma das principais construtoras e incorporadoras com foco em habitação popular no Brasil, anuncia hoje seus resultados do 4º trimestre e ano de 2020. DESTAQUES FINANCEIROS ▪ ReceitalíquidadeR$2,3biem2020(+17,0%a/a).No4T20,contabilizouR$685,9milhões(+26,3%a/a); ▪ Margem bruta ajustada de 32,2% em 2020 (-2,8 p.p. a/a). No 4T20, o indicador registrou 31,5% (-1,9 p.p. a/a); o Margem REF encerrou 2020 em 35,2% (-4,0 p.p. a/a) impactada pela perda de produtividade nas obras que sofreram paralizações no 1S20 por conta da pandemia e aumento no custo dos materiais de obra; ▪ Lucro Líquido de R$ 200,3 milhões no ano (-24% a/a) registrando R$ 72,0 milhões no trimestre. O modelo off-site totalizou no ano um prejuízo de R$ -8,9 milhões sendo R$ -2,7 milhões no trimestre; ▪ Geração de caixa operacional finalizou o ano no positivo em R$ 70,0 milhões (+223,9% a/a). No 4T20, a Companhia acelerou a atividade de algumas obras para combater reajustes nos custos de materiais consumindo R$ 54,3 milhões; ▪ Dívidalíquida/PLde-9,8%,desalavancagemreduzidapelasdistribuiçõeserecomprasaolongodoano; OPERACIONAIS ▪ Lançamento de 20empreendimentos no 4T20comVGV de R$885,2milhões (+5,9% a/a e -10,1% t/t); o Ano recorde em lançamentos atingindo o VGV de R$ 2,67 bilhões (+3,5% a/a); ▪ Vendas brutas recorde no trimestre de R$ 854,7 milhões (+27,7% a/a e +2,2% t/t) e VSO bruta de 35,0% (+4,5p.p. a/a e -1,3% t/t). Em ano recorde, foram registrados R$ 2,92 bilhões em VGV (+30,4% a/a); o Vendas líquidas recorde no trimestre de R$ 795,2 milhões no 4T20 (+29,1% a/a e +7,2% t/t) e VSO líquida de 32,5% (+4,5 p.p. a/a e +0,2 p.p t/t). Em ano recorde, foram registrados R$ 2,55 bilhões em VGV (+25,2% a/a); o Distratos de 7,0% (-1,0 p.p. a/a e -4,2 p.p. t/t) sobre vendas brutas no 4T20, encerrando o ano com média de 12,6% (+3,7 p.p. a/a); ▪ VGV repassado de R$ 619,8 milhões nesse trimestre (+12,1% a/a e -1,0% t/t) totalizando no ano R$ 2,14 bilhões (+30,7% a/a); ▪ Banco de terrenos atingiu R$ 10,97 bilhões em VGV ao final de 2020 (+3,3% a/a); COVID-19 ▪ Lançamento recorde no ano com recuperação no segundo semestre; ▪ Vendas em níveis recordes sinalizando resiliência da demanda e eficiência dos canais de venda própria online e de terceiros; ▪ As obras e repasses foram normalizadas ao longo do 3T20;
  • 3.
    3 MENSAGEM DA ADMINISTRAÇÃO Mesmoem um ano desafiador marcado pela pandemia do Covid-19, a Tenda apresentou resultados operacionais recordes em lançamentos, vendas e repasse atestando mais uma vez a resiliência do mercado de habitação popular brasileiro, e se consolidando como a principal empresa exclusivamente focada em projetos voltados para o grupo 2 do programa Casa Verde e Amarela. Foram lançadas mais de 18mil unidades habitacionais em 2020 que representam um VGV de R$ 2,66 bilhões (+3,5% a/a) acompanhado por um aumento expressivo das vendas líquidas que atingiram o VGV R$ 2,55 bilhões (+25,2% a/a) e VSO trimestral de 32,5% (+4,5 p.p. a/a). Cabe ressaltar que o desempenho recorde de vendas ocorreu organicamente sem a necessidade de redução de preços ou aumento do custo de vendas, muito em função da grande transformação digital que temos promovido em todo processo de vendas, tanto para lojas próprias quanto no relacionamento com as empresas de vendas parceiras, permitindo captura de eficiência mesmo em um cenário complexo de distanciamento social. O bom desempenho operacional, principalmente no segundo semestre, reflete na melhora da receita operacional. Tivemos níveis recordes de receita operacional líquida que registrou nesse ano R$ 2,29 bilhões (+17% a/a). Por outro lado, a margem bruta ajustada foi impactada negativamente pelos efeitos da pandemia finalizando o ano em 32,2% (-2,8 p.p. a/a), com destaque para perda de produtividade de algumas obras paralisadas no primeiro semestre (normalizadas 3T20). Em função das pressões com aumento nos custos de materiais que o setor vem sofrendo, a margem de resultados a apropriar também apresentou redução de -1,1 p.p. t/t e -4,0 p.p. a/a em virtude das novas safras de obras que já refletem esse aumento. Com isso, a Tenda entregou um lucro líquido de R$ 200,3 milhões, queda de 24,0% a/a, fechando o ano com 14,0% de ROE (-6,7 p.p. a/a), 19,6% de ROIC (-8,7 p.p. a/a) e lucro de R$ 2,04 por ação (ex- Tesouraria), queda de 25,1% a/a. Nesse último trimestre a Companhia consumiu R$ 54,3 milhões de caixa operacional adotando a estratégia de acelerar atividades em algumas obras como saída para evitar reajustes de preços em 2021, finalizando o ano com uma geração R$ 70,0 milhões de caixa operacional. A Tenda reitera a sua opção por uma gestão financeira conservadora. A Companhia mantém uma posição de caixa líquido (R$ 148,3 milhões no final de 2020), resultando em uma relação entre dívida líquida e patrimônio líquido de -9,8%. A decisão estratégica é validada pela recorrência de eventos que impactam a geração de caixa, como os atrasos nos repasses dentro do programa Casa Verde e Amarela. Em 2020 realizamos avanços importantes no projeto off-site ganhando cada vez mais convicção de que ele é a grande plataforma de crescimento da Companhia, com destaque para os pilotos executados que comprovaram as teses iniciais de qualidade de produto e eficiência de produção, vinda anunciada no trimestre passado do Marcelo Willer (ex-CEO Alphaville Urbanismo) como investidor minoritário do projeto e o investimento que estamos realizando na montagem de uma fábrica com alta capacidade produtiva de até 10 mil unidades ano prevista para iniciar as operações no segundo semestre de 2021. A partir do ano de 2021, temos a ambição de formar landbank robusto para escalar a operação, buscando operar em capacidade total da nova fábrica em 2026. A Tenda ressalta que permanece orientada à geração de valor de longo prazo buscando construir diferenciais competitivos através da industrialização da construção civil, almejando ser a empresa que consistentemente entrega maior retorno aos seus acionistas.
  • 4.
    4 GUIDANCE Com o objetivode gerar simetria de informações e dar previsibilidade ao mercado sobre os nossos números, a Companhia optou em 2021 por divulgar projeções (guidance) do modelo on-site baseadas em expectativas da Administração, bem como em estudos internos realizados e nas condições econômico-financeiras do mercado de atuação. • Em 2021, para a Margem Bruta Ajustada, entendida como a razão entre o resultado bruto (deduzido dos encargos financeiros presentes na nota explicativa 11 das demonstrações financeiras) e a receita líquida consolidada do exercício, estima-se uma oscilação entre o mínimo de 30,0% e o máximo de 32,0%. • Em 2021, para as Vendas Líquidas, definidas como o resultado da subtração entre as vendas brutas (em R$ milhões) e os distratos (em R$ milhões) realizados do exercício, ajustados todos os valores à participação societária da Tenda, estima-se uma oscilação entre o mínimo de R$2.800 milhões e o máximo de R$ 3.000 milhões. Guidance 2021 Limite Inferior Limite Superior Margem Bruta Ajustada (%) 30,0% 32,0% Vendas Líquidas (R$ MM) 2.800,0 3.000,0 ABERTURA ENTRE AS OPERAÇÕES TENDA ON-SITE E OFF-SITE Seguindo com o nosso compromisso iniciamos a partir deste trimestre a apresentação dos dados segregados entre as operações on-site e off-site. On-site: Modelo em que a companhia opera desde 2013 caracterizado pela construção no canteiro de obra de apartamentos usando o método construtivo parede de concreto com forma de alumínio, em regiões metropolitanas com demanda mínima produtiva de 1.000 unidades/ano. Off-site: Modelo caracterizado pelo desenvolvimento de casas produzidas em uma fábrica usando a tecnologia construtiva woodframe e montadas no canteiro de obra. Esse modelo não exige uma demanda mínima local abrindo a possibilidade da companhia explorar mercados menores atuando em pequenas e médias cidades do país. Consolidado: Resultado agregado das duas operações.
  • 5.
    Off-site No Tenda Day,evento realizado para investidores no dia 16 de dezembro de 2020, anunciamos o investimento que estamos realizando na montagem de uma fábrica de alta produção. Além disso, divulgamos as imagens das primeiras casas prontas do projeto piloto que consiste em um condomínio com 49 casas localizado em Mogi das Cruzes em um terreno que já fazia parte do nosso landbank. O projeto off-site, nesse primeiro momento, visa explorar a demanda das cidades médias do interior de São Paulo. Nova Fábrica: A nova fábrica será inaugurada no 2º semestre de 2021 na cidade de Jaguariúna, interior de São Paulo. São mais de 18mil m² com alta capacidade produtiva de 10 mil unidades ano que a companhia almeja atingir em 2026. Os novos maquinários estão a caminho do Brasil com a chegada prevista para o segundo trimestre. Estamos iniciando a desmobilização do nosso centro de inovação incorporando à nova fábrica o maquinário existente. Estágio DATEC: DATEC é o documento de avaliação técnica que credencia os materiais utilizados e processos adotados para um determinado sistema construtivo. Obter a certificação DATEC para o novo sistema construtivo do off-site nos qualifica em operar no mesmo modelo da Tenda on-site realizando o repasse do cliente com a CEF ao longo da obra. O processo de certificação está em andamento com previsão de publicação no primeiro semestre de 2021. Parceria Tecverde: A Tecverde é pioneira em construções woodframe no Brasil, são mais de 10 anos de experiência e mais de 4,5mil unidades construídas. Com objetivo de acelerar nossa curva de aprendizado no sistema construtivo, a Tenda firmou no 4T20 parceria com a Tecverde que está construindo 50 casas no interior de São Paulo.
  • 6.
    6 Indicadores a seremmonitorados: Na construção off-site há uma facilidade maior de traduzir e implementar os conceitos de engenharia de produção para engenharia civil. As casas são produzidas em um ambiente controlado livre de intempéries climáticas, há possibilidade no ganho de produtividade operando no limite em 3 turnos e melhoria de eficiência através da automação. Produzir as casas em uma fábrica realizando somente a montagem no canteiro de obra permite a companhia operar em mercados de baixa escala local. A possibilidade de operar em uma baixa escala local aumenta substancialmente a quantidade de mercados endereçáveis aumentando a escala global a ser explorada. A alta escala global permite que a empresa tenha custos competitivos através do desenvolvimento da cadeia de suprimentos, traduzindo em melhores produtos ofertados (localização, área, preço e urbanismo) que implica em uma alta velocidade de vendas reforçando o ganho de escala. Quanto mais rápido gira o flywheel maior é o diferencial competitivo da Companhia no longo prazo. O sucesso do projeto off-site depende do ganho de escala, acompanhar os indicadores de compra de terreno e lançamentos são um balizador para monitorar a velocidade de execução do projeto. Encerramos 2020 com dois projetos pilotos e reforçamos que 2021 e 2022 continuam sendo anos de aprendizados escalando o volume de lançamentos a partir de 2023. Baixa Escala Local
  • 7.
    7 ESG A Companhia no3T20 apresentou um ponto de partida no tema com os principais elementos de impacto ESG, tomando por base os temas materiais propostos pelo SASB (Sustainability Accounting Standards Board) e pelo S&P SAM CSA (Corporate Sustainability Assessment) para o setor, além de outros aspectos materiais derivados da atuação da Tenda no segmento de habitação popular. Os principais elementos de impacto ESG da Tenda podem ser agrupados em três pilares: Inclusão social Produtos ao alcance das famílias de baixa renda em empreendimentos que trazem bem-estar, saneamento e infraestrutura para as comunidades Na Tenda, empresa na B3 integralmente dedicada à produção de unidades residenciais populares, todos os empreendimentos se enquadram no grupo 2 do Programa Casa Verde e Amarela. A Companhia oferece apartamentos com preços 19% inferiores à média praticada pelos principais concorrentes (de acordo com informações de vendas do 4T20), permitindo acesso ao imóvel próprio a famílias que nunca tiveram essa alternativa. Em 2020, a Tenda atingiu famílias com renda média familiar mensal de R$ 2.473, valor mais próximo do piso do que do teto do grupo 2 do PCVA (faixa de renda familiar mensal entre R$ 2.000 e R$ 4.000). Preço Médio de Vendas (R$ mil) 4T20 3T20 T/T (%) 4T19 A/A (%) Tenda (R$ / unid) 142 143 (0,7%) ↓ 139 2,2% ↑ PCVA¹ (R$ / unid) 175 171 2,3% ↑ 165 6,1% ↑ % Preço Médio de Vendas (Tenda / PCVA) 81,1% 83,6% (3,0%) ↓ 84,2% (3,7%) ↓ ¹ Preço médio ponderado entre MRV (apenas MRV) e Direcional (apenas Direcional) ¹ com base nas vendas brutas realizadas entre jan/20 e dez/20 ² preço médio ponderado entre MRV (100%) e Direcional (apenas PCVA 2 e 3)
  • 8.
    8 Respeito ao clientee ao colaborador Produtos de qualidade, entregues no prazo e feitos de forma segura por profissionais diretamente contratados e com oportunidades de crescimento Todos os empreendimentos lançados a partir de 2013, ano que marca o início do atual modelo de negócios, foram entregues dentro do prazo contratual, um dos principais compromissos firmados pela Administração com seus clientes. A Companhia tem voltado esforços para a satisfação do cliente e, em 2020, o Net Promoting Score (NPS), uma das principais métricas globais de satisfação, passou a fazer parte das metas dos principais executivos. Na Tenda, praticamente todos os colaboradores envolvidos na construção dos edifícios são empregados diretamente pela Companhia, e não terceirizados, como costuma ser a prática no setor. Além de permitir a implementação da abordagem industrial à construção, o principal diferencial competitivo da Tenda, a iniciativa traz mais segurança e estabilidade para os funcionários. A Tenda adota práticas de segurança e saúde ocupacional rigorosas, monitorando riscos e indicadores de forma contínua. Indicadores 4T20 3T20 T/T (%) 4T19 A/A (%) Entregas dentro do prazo (%)¹ 100% 100% 0,0% ↑ 100% 0,0% ↑ Número de colaboradores diretos² 3.757 3.682 2,0% ↑ 3.558 5,6% ↑ Número de colaboradores indiretos 1.620 1.900 (14,7%) ↓ 1.762 (8,1%) ↓ Total de colaboradores 5.377 5.582 (3,7%) ↓ 5.320 1,1% ↑ % colaboradores diretos / total 70% 66% 5,9% ↑ 67% 4,5% ↑ ¹ Empreendimentos lançados a partir de 2013, marco inicial do atual modelo de negócios ² Funcionários diretamente contratados pela Companhia
  • 9.
    9 Compromisso com aética e a governança Rigor e atuação responsável em todas as etapas da viabilização dos empreendimentos, com gestão alinhada às melhores práticas corporativas O comportamento ético faz parte da cultura da Tenda e está no centro das decisões da Companhia, desde os processos de prospecção e legalização dos futuros empreendimentos até as melhores práticas junto aos colaboradores e fornecedores. A empresa mantém um Comitê de Ética coordenado pelo diretor-presidente, códigos de ética e conduta voltados para colaboradores e fornecedores, e canais de denúncia independentes. Empresa do Novo Mercado, o mais alto nível de Governança Corporativa da B3, a Tenda atende a 90% das melhores práticas estabelecidas pelo IBGC no Código Brasileiro de Governança. Todos os conselheiros são independentes e todos os diretores são estatutários, com 37% da remuneração total vinculada a incentivos de longo prazo. ³ Com base nas respostas do formulário CVM 586 da Tenda 4 Conforme proposta da administração aprovada em AGO para o ano de 2020 Para mais informações ESG, entre em contato com a equipe de RI da Tenda em ri@tenda.com
  • 10.
    10 DESTAQUES OPERACIONAIS EFINANCEIROS Ainda não constam valores para operação off-site Destaques Financeiros (R$ milhões) 4T20 3T20 T/T (%) 4T19 A/A (%) 2020 2019 A/A (%) On-site Receita Líquida 685,9 654,5 4,8% ↑ 543,1 26,3% ↑ 2.282,4 1.950,1 17,0% ↑ Lucro Bruto Ajustado¹ 216,4 216,3 0,1% ↑ 181,7 19,1% ↑ 734,6 681,7 7,8% ↑ Margem Bruta Ajustada¹ (%) 31,5% 33,0% (1,5 p.p.) ↓ 33,4% (1,9 p.p.) ↓ 32,2% 35,0% (2,8 p.p.) ↓ EBITDA Ajustado² 112,8 111,4 1,3% ↑ 99,9 12,9% ↑ 338,7 353,5 (4,2%) ↓ Margem EBITDA Ajustada² (%) 16,4% 17,0% (0,6 p.p.) ↓ 18,4% (2,0 p.p.) ↓ 14,8% 18,1% (3,3 p.p.) ↓ Lucro Líquido (Prejuízo)³ 74,7 76,3 (2,1%) ↓ 76,2 (2,0%) ↓ 209,2 263,5 (20,6%) ↓ Margem Líquida (%) 10,9% 11,7% (0,8 p.p.) ↓ 14,0% (3,1 p.p.) ↓ 9,2% 13,5% (4,3 p.p.) ↓ Receitas a Apropriar 949,5 745,3 27,4% ↑ 555,2 71,0% ↑ 949,5 555,2 71,0% ↑ Margem Resultados a Apropriar (%) 35,2% 36,3% (1,1 p.p.) ↓ 39,2% (4,0 p.p.) ↓ 35,2% 39,2% (4,0 p.p.) ↓ Geração de Caixa Operacional⁴ (44,7) 119,3 (137,4%) ↓ (11,3) (296,8%) ↓ 97,7 24,5 299,6% ↑ Off-site Receita Líquida 0,0 0,0 0,0% ↑ 0,0 0,0% ↑ 0,0 0,0 0,0% ↑ EBITDA Ajustado² (2,6) (5,8) 55,3% ↑ (0,0) 0,0% ↑ (8,6) (0,0) 0,0% ↑ Margem EBITDA Ajustada² (%) 0,0% 0,0% 0,0 p.p. 0,0% 0,0 p.p. 0,0% 0,0% 0,0 p.p. Lucro Líquido (Prejuízo)³ (2,7) (5,8) 53,1% ↑ 0,0 0,0% ↑ (8,9) 0,0 0,0% ↑ Margem Líquida (%) 0,0% 0,0% 0,0 p.p. 0,0% 0,0 p.p. 0,0% 0,0% 0,0 p.p. Geração de Caixa Operacional⁴ (9,6) (7,8) (23,3%) ↓ (1,3) (645,5%) ↓ (27,7) (2,8) (874,8%) ↓ Consolidado Receita Líquida 685,9 654,5 4,8% ↑ 543,1 26,3% ↑ 2.282,4 1.950,1 17,0% ↑ Lucro Bruto Ajustado¹ 216,4 216,3 0,1% ↑ 181,7 19,1% ↑ 734,6 681,7 7,8% ↑ Margem Bruta Ajustada¹ (%) 31,5% 33,0% (1,5 p.p.) ↓ 33,4% (1,9 p.p.) ↓ 32,2% 35,0% (2,8 p.p.) ↓ EBITDA Ajustado² 110,2 105,6 4,4% ↑ 99,9 10,3% ↑ 330,0 353,5 (6,6%) ↓ Margem EBITDA Ajustada² (%) 16,1% 16,1% (0,1 p.p.) ↓ 18,4% (2,3 p.p.) ↓ 14,5% 18,1% (3,7 p.p.) ↓ Lucro Líquido (Prejuízo)³ 72,0 70,5 2,1% ↑ 76,2 (5,6%) ↓ 200,3 263,5 (24,0%) ↓ Margem Líquida (%) 10,5% 10,8% (0,3 p.p.) ↓ 14,0% (3,5 p.p.) ↓ 8,8% 13,5% (4,7 p.p.) ↓ Receitas a Apropriar 949,5 745,3 27,4% ↑ 555,2 71,0% ↑ 949,5 555,2 71,0% ↑ Margem Resultados a Apropriar (%) 35,2% 36,3% (1,1 p.p.) ↓ 39,2% (4,0 p.p.) ↓ 35,2% 39,2% (4,0 p.p.) ↓ Dívida Líquida / (PL+Minoritários) (%) (9,8%) (16,9%) 7,2 p.p. ↑ (14,8%) 5,0 p.p. ↑ (9,8%) (14,8%) 5,0 p.p. ↑ Geração de Caixa Operacional⁴ (54,3) 111,5 (148,7%) ↓ (12,5) (332,5%) ↓ 70,0 21,6 223,9% ↑ ROE⁵ (12 meses) 14,0% 14,7% (0,7 p.p.) ↓ 20,7% (6,7 p.p.) ↓ 14,0% 20,7% (6,7 p.p.) ↓ ROIC⁶ (12 meses) 19,6% 21,1% (1,5 p.p.) ↓ 28,3% (8,7 p.p.) ↓ 19,6% 28,3% (8,7 p.p.) ↓ Lucro por Ação⁷ (12 meses) (R$/ação) (ex-Tesouraria) 2,04 2,09 (2,5%) ↓ 2,73 (25,1%) ↓ 2,04 2,73 (25,1%) ↓ 1. Ajustado por juros capitalizados. 2. Ajustado por juros capitalizados, despesas com planos de ações (não caixa) e minoritários. 3. Ajustado por minoritários 4. A Geração de Caixa Operacional é resultado de um cálculo gerencial interno da companhia que não reflete ou compara-se aos números presentes nas DFs 5. ROE é calculado pelo lucro líquido dos últimos 12 meses ajustado por minoritários divididos pela média do patrimônio líquido. Média referente à posição de abertura e fechamento dos últimos 12 meses. 6. ROIC é calculado pelo NOPAT dos últimos 12 meses divididos pela média do capital empregado. Média referente à posição de abertura e fechamento dos últimos 12 meses. 7. Lucro por ação (ex-Tesouraria) considera as ações emitidas (ajustadas em casos de desdobramento de ações) e desconsidera as ações mantidas em Tesouraria ao final do período. Destaques Operacionais (R$ milhões, VGV) 4T20 3T20 T/T (%) 4T19 A/A (%) 2020 2019 A/A (%) On-site Lançamentos 885,2 984,2 (10,1%) ↓ 835,8 5,9% ↑ 2.665,2 2.575,1 3,5% ↑ Vendas Líquidas 795,2 742,1 7,2% ↑ 615,9 29,1% ↑ 2.553,5 2.039,6 25,2% ↑ VSO Líquida (%) 32,5% 32,3% 0,2 p.p. ↑ 28,0% 4,5 p.p. ↑ 60,8% 56,3% 4,5 p.p. ↑ VGV Repassado 619,8 626,2 (1,0%) ↓ 553,1 12,1% ↑ 2.144,8 1.641,1 30,7% ↑ Unidades Entregues (#) 2.728,0 2.163,0 26,1% ↑ 1.752,0 55,7% ↑ 9.246,0 10.368,0 (10,8%) ↓ Banco de Terrenos 10.974,5 10.802,8 1,6% ↑ 10.619,4 3,3% ↑ 10.974,5 10.619,4 3,3% ↑
  • 11.
    11 RESULTADOS OPERACIONAIS LANÇAMENTOS No 4T20,a Tenda lançou 20 empreendimentos, totalizando R$ 885,2 milhões em VGV (+5,9% a/a e -10,1% t/t). Recorde em 2020 os lançamentos atingiram o VGV de R$2,67 bilhões, aumento de 3,5% na comparação anual. Nesse ano, a região metropolitana (“RM”) de São Paulo passou a representar 37,1% do VGV lançado (versus 35,7% em 2019) com 5.898 unidades lançadas (+6,5% a/a). A RM de Salvador representou 19,2% do VGV lançado (versus 15,7% em 2019) com 3.668 unidades lançadas (+22,8% a/a). O incremento de 2,2% a/a no preço médio por unidade lançada é explicado pelo crescimento de representatividade das regionais SP e BA no VGV total lançado, locais em que já lançamos os empreendimentos com elevadores concentrados mais próximos das regiões centrais. Ainda não constam valores para operação off-site VENDAS BRUTAS As vendas brutas totalizaram R$ 854,7 milhões no 4T20 (+27,7% a/a e +2,2% t/t). Trata-se do melhor trimestre em vendas brutas na história da Tenda. Na comparação com 2019, o ano de 2020 encerrou com um aumento de 30,4% no VGV de vendas brutas. Nesse ano, tivemos incremento no número de unidades vendidas (+26,6% a/a) e no preço médio por unidade vendida (+3,0% a/a) explicado pela maior participação de São Paulo no mix de vendas brutas (37,8% em 2020 versus 35,4% em 2019). A VSO bruta atingiu 35,0% no 4T20, decréscimo de 1,3 p.p. em relação ao 3T20. Vendas Brutas 4T20 3T20 T/T (%) 4T19 A/A (%) 2020 2019 A/A (%) On-site VGV (R$ milhões) 854,7 836,1 2,2% ↑ 669,4 27,7% ↑ 2.921,0 2.239,4 30,4% ↑ Número de unidades 6.042 5.860 3,1% ↑ 4.831 25,1% ↑ 20.761 16.397 26,6% ↑ Preço médio por unidade (R$ mil) 141,5 142,7 (0,9%) ↓ 138,6 2,1% ↑ 140,7 136,6 3,0% ↑ VSO Bruta 35,0% 36,3% (1,3 p.p.) ↓ 30,5% 4,5 p.p. ↑ 69,5% 61,8% 7,7 p.p. ↑ Ainda não constam valores para operação off-site Vendas Brutas (VGV, R$ milhões) e VSO Bruta (%) On-site Lançamentos 4T20 3T20 T/T (%) 4T19 A/A (%) 2020 2019 A/A (%) On-site Número de Empreendimentos 20 17 17,6% ↑ 22 (9,1%) ↓ 55 63 (12,7%) ↓ VGV (R$ milhões) 885,2 984,2 (10,1%) ↓ 835,8 5,9% ↑ 2.665,2 2.575,1 3,5% ↑ Número de unidades 6.136 6.325 (3,0%) ↓ 5.972 2,7% ↑ 18.120 17.894 1,3% ↑ Preço médio por unidade (R$ mil) 144,3 155,6 (7,3%) ↓ 140,0 3,1% ↑ 147,1 143,9 2,2% ↑ Tamanho médio dos lançamentos (em unidades) 306,8 372,1 (17,5%) ↓ 271,5 13,0% ↑ 329,5 284,0 16,0% ↑ 313 383 319 403 424 463 443 478 471 528 543 504 443 537 590 669 541 689 836 855 28% 31% 25% 29% 30% 31% 28% 30% 32% 37% 35% 31% 30% 32% 31% 30% 31% 36% 36% 35% 1T16 2T16 3T16 4T16 1T17 2T17 3T17 4T17 1T18 2T18 3T18 4T18 1T19 2T19 3T19 4T19 1T20 2T20 3T20 4T20 Vendas Brutas VSO Bruta
  • 12.
    12 DISTRATOS E VENDASLÍQUIDAS As vendas líquidas totalizaram R$ 795,2 milhões no 4T20 (+29,1% a/a e +7,2% t/t). Trata-se do melhor trimestre em vendas líquidas na história da Tenda. Encerramos 2020 com R$ 2,55 bilhões, um aumento de 25,2% na comparação anual. A velocidade sobre a oferta (“VSO líquida”) atingiu 32,5% nesse trimestre (+4,5 p.p. a/a e +0,2 p.p. t/t). A média trimestral da VSO Líquida nesse ano contabilizou 30,2%, incremento de 2,1 p.p. frente aos 28,1% de 2019. A relação distratos sobre vendas brutas de 7,0% no 4T20 reduziu 4,2 p.p frente ao 3T20. Endereçamos um alto nível de distratos nos primeiros nove meses do ano em função da pandemia tendo uma queda significativa nesse trimestre. Em 2020 o índice ficou em 12,6% (+3,7 p.p. a/a) e a expectativa é que em 2021 esse indicador continue convergindo para os patamares histórico de 2019. (VGV, R$ milhões) 4T20 3T20 T/T (%) 4T19 A/A (%) 2020 2019 A/A (%) On-site Vendas Brutas 854,7 836,1 2,2% ↑ 669,4 27,7% ↑ 2.921,0 2.239,4 30,4% ↑ Distratos 59,5 94,0 (36,7%) ↓ 53,5 11,2% ↑ 367,5 199,8 83,9% ↑ Vendas Líquidas 795,2 742,1 7,2% ↑ 615,9 29,1% ↑ 2.553,5 2.039,6 25,2% ↑ % Lançamentos¹ 79,6% 54,4% 25,2 p.p. ↑ 83,3% (3,7 p.p.) ↓ 48,0% 51,5% (3,5 p.p.) ↓ % Estoque 20,4% 45,6% (25,2 p.p.) ↓ 16,7% 3,7 p.p. ↑ 52,0% 48,5% 3,5 p.p. ↑ Distratos / Vendas Brutas 7,0% 11,2% (4,2 p.p.) ↓ 8,0% (1,0 p.p.) ↓ 12,6% 8,9% 3,7 p.p. ↑ VSO Líquida 32,5% 32,3% 0,2 p.p. ↑ 28,0% 4,5 p.p. ↑ 60,8% 56,3% 4,5 p.p. ↑ (em unidades) 4T20 3T20 T/T (%) 4T19 A/A (%) 2020 2019 A/A (%) On-site Unidades Vendidas Brutas 6.042 5.860 3,1% ↑ 4.831 25,1% ↑ 20.761 16.397 26,6% ↑ Unidades Distratadas 431 681 (36,7%) ↓ 383 12,5% ↑ 2.671 1.490 79,3% ↑ Unidades Vendidas Líquidas 5.611 5.179 8,3% ↑ 4.448 26,1% ↑ 18.090 14.907 21,4% ↑ Distratos / Vendas Brutas 7,1% 11,6% (4,5 p.p.) ↓ 7,9% (0,8 p.p.) ↓ 12,9% 9,1% 3,8 p.p. ↑ 1. Lançamentos do ano corrente. Ainda não constam valores para operação off-site Vendas Líquidas (VGV, R$ milhões) e VSO Líquida (%) On-site 266 325 239 311 339 388 385 433 424 481 490 459 407 480 537 616 440 576 742 795 24% 26% 19% 22% 24% 26% 25% 27% 29% 33% 32% 29% 27% 29% 28% 28% 25% 30% 32% 33% 1T16 2T16 3T16 4T16 1T17 2T17 3T17 4T17 1T18 2T18 3T18 4T18 1T19 2T19 3T19 4T19 1T20 2T20 3T20 4T20 Vendas Líquidas VSO Líquida
  • 13.
    13 UNIDADES REPASSADAS, ENTREGUESE OBRAS EM ANDAMENTO O VGV repassado totalizou R$ 619,8 milhões no 4T20 (+12,1% a/a e -1,0% t/t). O bom desempenho deve- se à normalização dos financiamentos no decorrer do segundo semestre, dado que a Caixa Econômica Federal (“CEF”) adaptou seus procedimentos para superar os desafios operacionais verificados no início da pandemia. Em 2020, o VGV repassado contabilizou R$ 2,1 bilhões, crescimento anual de 30,7%. Foram entregues 2.728 unidades no 4T20 totalizando 9.246 unidades ao longo de 2020. Encerramos o ano com 91 obras em andamento, crescimento de 33,8% em relação à 2019. Com a retomada do setor imobiliário em 2020 e o consequente aumento dos custos de construção, a Tenda antecipou o início de algumas das obras como estratégia para mitigar o impacto de reajustes que devem continuar presentes ao longo de 2021. Repasses, Entregas e Andamento 4T20 3T20 T/T (%) 4T19 A/A (%) 2020 2019 A/A (%) On-site VGV Repassado (em R$ milhões) 619,8 626,2 (1,0%) ↓ 553,1 12,1% ↑ 2.144,8 1.641,1 30,7% ↑ Unidades Repassadas 4.846 5.085 (4,7%) ↓ 4.771 1,6% ↑ 17.215 13.951 23,4% ↑ Unidades Entregues 2.728 2.163 26,1% ↑ 1.752 55,7% ↑ 9.246 10.368 (10,8%) ↓ Obras em andamento 91 82 11,0% ↑ 68 33,8% ↑ 91 68 33,8% ↑ Ainda não constam valores para operação off-site ESTOQUE A VALOR DE MERCADO Nesse trimestre o estoque a valor de mercado totalizou R$ 1,65 bilhão em VGV (+4,3% a/a e +5,8% t/t). O estoque pronto contabilizou R$ 38,8 milhões representando 2,4% do total. O giro do estoque (estoque a valor de mercado dividido pelas vendas líquidas dos últimos doze meses) em 2020 atingiu 7,8 meses apresentando melhora em relação aos 8,2 meses de patamar médio do ano anterior. Estoque a Valor de Mercado 4T20 3T20 T/T (%) 4T19 A/A (%) 2020 2019 A/A (%) On-site VGV (R$ milhões) 1.649,2 1.558,8 5,8% ↑ 1.581,6 4,3% ↑ 1.649,2 1.581,6 4,3% ↑ Número de unidades 10.878 10.416 4,4% ↑ 10.963,0 (0,8%) ↓ 10.878 10.963,0 (0,8%) ↓ Preço médio por unidade (R$ mil) 151,6 149,7 1,3% ↑ 144,3 5,1% ↑ 151,6 144,3 5,1% ↑ Status de Obra - VGV (R$ milhões) 4T20 Não Iniciadas Até 30% Concluído 30% a 70% Concluído Mais de 70% Concluído Concluído On-site 1.649,2 747,7 447,9 385,2 29,6 38,8 Ainda não constam valores para operação off-site BANCO DE TERRENOS A companhia finalizou 2020 com um VGV de R$ 10,97 bilhões (+3,3% a/a e +1,6% t/t ) em seu banco de terreno, sustentando o mesmo patamar de 2019. Em função da pandemia passamos boa parte do ano renegociando terrenos que já adquiridos. Nossa avaliação é que o desempenho na compra de terreno foi saudável em 2020 mas abaixo das nossas expectativas. O projeto off-site encerrou 2020 com dois projetos pilotos em andamento. Banco de Terrenos¹ 4T20 3T20 T/T (%) 4T19 A/A (%) 2020 2019 A/A (%) On-site Número de Empreendimentos 291 291 0,0% ↑ 292 (0,3%) ↓ 291 292 (0,3%) ↓ VGV (em R$ milhões) 10.974,5 10.802,8 1,6% ↑ 10.619,4 3,3% ↑ 10.974,5 10.619,4 3,3% ↑ Aquisições/Ajustes (em R$ milhões) 1.057,0 1.096,5 (3,6%) ↓ 1.585,5 (33,3%) ↓ 3.020,4 4.300,9 (29,8%) ↓ Número de unidades 73.339 73.266 0,1% ↑ 72.159 1,6% ↑ 73.339 72.159 1,6% ↑ Preço médio por unidade (em R$ mil) 149,6 147,4 1,5% ↑ 147,2 1,7% ↑ 149,6 147,2 1,7% ↑ % Permuta Total 38,5% 37,9% 0,6 p.p. ↑ 34,6% 3,9 p.p. ↑ 38,5% 34,6% 3,9 p.p. ↑ % Permuta Unidades 8,6% 8,8% (0,2 p.p.) ↓ 8,4% 0,2 p.p. ↑ 8,6% 8,4% 0,2 p.p. ↑ % Permuta Financeiro 30,0% 29,2% 0,8 p.p. ↑ 26,2% 3,8 p.p. ↑ 30,0% 26,2% 3,8 p.p. ↑ 1. Tenda detém 100% de participação societária de seu Banco de Terrenos. Ainda não constam valores para operação off-site
  • 14.
    14 RESULTADOS FINANCEIROS RECEITA OPERACIONALLÍQUIDA A receita operacional líquida totalizou R$ 685,9 milhões no 4T20 (+ 26,3% a/a e 4,8% t/t) finalizando o ano em R$ 2,28 bilhões. Nesse ano reclassificamos R$ 46,8 milhões entre as provisões de distrato e créditos de liquidação duvidosa (“PCLD”), desconsiderando esse efeito a provisão de distrato registrou uma constituição de R$ 30,2 milhões (-1,3% a/a) e a PCLD contabilizou uma constituição de R$ 9,3 milhões frente uma reversão de R$ 12 milhões no ano passado. (R$ milhões) 4T20 3T20 T/T (%) 4T19 A/A (%) 2020 2019 A/A (%) On-site Receita Operacional Bruta 706,8 651,7 8,4% ↑ 566,5 24,8% ↑ 2.358,9 2.005,3 17,6% ↑ Provisão para perdas estimadas em créditos de liquidação duvidosa (13,0) (31,9) 59,3% ↑ 4,0 (423,4%) ↓ (56,2) 12,3 (558,0%) ↓ Provisão para distratos (0,7) 47,3 (101,4%) ↓ (18,5) 96,3% ↑ 16,5 (30,6) 154,0% ↑ Imposto sobre vendas de imóveis e serviços (7,2) (12,5) (42,7%) ↓ (8,9) (19,0%) ↓ (36,9) (36,9) 0,1% ↑ Receita Operacional Líquida 685,9 654,5 4,8% ↑ 543,1 26,3% ↑ 2.282,4 1.950,1 17,0% ↑ Ainda não constam valores para operação off-site LUCRO BRUTO Nesse trimestre o lucro bruto ajustado contabilizou R$ 216,4 milhões (+19,1% a/a e +0,1% t/t), a margem bruta ajustada atingiu 31,5% (-1,9 p.p. a/a e -1,5 p.p) sofrendo um impacto não recorrente de R$ 11 milhões com destaque para obra de reforço de fundação realizada em um projeto de São Paulo. A margem bruta ajustada sem esse efeito teria ficado em 33,2% no 4T20, mantendo-se estável em relação ao trimestre passado. A margem bruta ajustada do ano também foi impactada negativamente pelos efeitos da pandemia registrando 32,2% (-2,8 p.p. a/a), com destaque para perda de produtividade de algumas obras paralisadas no primeiro semestre e normalizadas no 3T20. (R$ milhões) 4T20 3T20 T/T (%) 4T19 A/A (%) 2020 2019 A/A (%) On-site Receita Líquida 685,9 654,5 4,8% ↑ 543,1 26,3% ↑ 2.282,4 1.950,1 17,0% ↑ Lucro Bruto 209,5 211,3 (0,8%) ↓ 173,1 21,0% ↑ 710,4 648,1 9,6% ↑ Margem Bruta 30,5% 32,3% (1,7 p.p.) ↓ 31,9% (1,3 p.p.) ↓ 31,1% 33,2% (2,1 p.p.) ↓ (-) Custos Financeiros 6,9 5,0 38,6% ↑ 8,6 (19,6%) ↓ 24,2 33,6 (28,0%) ↓ Lucro Bruto Ajustado¹ 216,4 216,3 0,1% ↑ 181,7 19,1% ↑ 734,6 681,7 7,8% ↑ Margem Bruta Ajustada 31,5% 33,0% (1,5 p.p.) ↓ 33,4% (1,9 p.p.) ↓ 32,2% 35,0% (2,8 p.p.) ↓ 1. Ajustado por juros capitalizados. Ainda não constam valores para operação off-site
  • 15.
    15 DESPESAS COM VENDAS,GERAIS E ADMINISTRATIVAS (SG&A) Despesas com vendas No 4T20 as despesas com vendas totalizaram R$ 52,1 milhões (+14,7% a/a e -6,3% t/t), representando 6,1% das vendas brutas. O indicador manteve-se resiliente aos patamares históricos com recorde de vendas impulsionado pela boa performance das vendas online. Em 2020 as despesas com vendas contabilizaram R$ 200,6 milhões sendo 6,9% das vendas brutas, redução -0,4p.p. frente aos 7,3% de 2019. Despesas gerais e administrativas (G&A) Nesse trimestre, as despesas gerais e administrativas (G&A) do modelo on-site totalizaram R$ 36,1 milhões (+37,4% a/a e -10,1% t/t) e do modelo off-site R$ 2,1 milhões. No consolidado encerramos o 4T20 com R$ 38,3 milhões (+45,6% a/a e -16,5% t/t) finalizando o ano em R$ 154,4 milhões (+31,9% a/a) que representa uma relação de 5,8% dos lançamentos (+1,2p.p. a/a). (R$ milhões) 4T20 3T20 T/T (%) 4T19 A/A (%) 2020 2019 A/A (%) On-site Despesas com Vendas (52,1) (55,6) (6,3%) ↓ (45,5) 14,7% ↑ (200,6) (162,5) 23,4% ↑ Despesas Gerais e Administrativas (G&A) (36,1) (40,2) (10,1%) ↓ (26,3) 37,4% ↑ (146,4) (117,1) 25,0% ↑ Total de Despesas SG&A (88,3) (95,8) (7,9%) ↓ (71,7) 23,0% ↑ (347,0) (279,6) 24,1% ↑ Vendas Brutas 854,7 836,1 2,2% ↑ 669,4 27,7% ↑ 2.921,0 2.239,4 30,4% ↑ Lançamentos 885,2 984,2 (10,1%) ↓ 835,8 5,9% ↑ 2.665,2 2.575,1 3,5% ↑ Receita Operacional Líquida 685,9 654,5 4,8% ↑ 543,1 26,3% ↑ 2.282,4 1.950,1 17,0% ↑ Despesas com Vendas / Vendas Brutas 6,1% 6,7% (0,6 p.p.) ↓ 6,8% (0,7 p.p.) ↓ 6,9% 7,3% (0,4 p.p.) ↓ G&A / Lançamentos 4,1% 4,1% (0,0 p.p.) ↓ 3,1% 0,9 p.p. ↑ 5,5% 4,5% 0,9 p.p. ↑ G&A / Receita Operacional Líquida 5,3% 6,1% (0,9 p.p.) ↓ 4,8% 0,4 p.p. ↑ 6,4% 6,0% 0,4 p.p. ↑ Off-site Despesas com Vendas (0,0) 0,0 0,0% ↑ 0,0 0,0% ↑ (0,0) 0,0 0,0% ↑ Despesas Gerais e Administrativas (G&A) (2,1) (5,7) (62,3%) ↓ (0,0) 0,0% ↑ (8,0) (0,0) 0,0% ↑ Total de Despesas SG&A (2,1) (5,7) (62,2%) ↓ (0,0) 0,0% ↑ (8,0) (0,0) 0,0% ↑ Consolidado Despesas com Vendas (52,1) (55,6) (6,3%) ↓ (45,5) 14,7% ↑ (200,6) (162,5) 23,4% ↑ Despesas Gerais e Administrativas (G&A) (38,3) (45,8) (16,5%) ↓ (26,3) 45,6% ↑ (154,4) (117,1) 31,9% ↑ Total de Despesas SG&A (90,4) (101,5) (10,9%) ↓ (71,8) 26,0% ↑ (355,0) (279,6) 27,0% ↑ Vendas Brutas 854,7 836,1 2,2% ↑ 669,4 27,7% ↑ 2.921,0 2.239,4 30,4% ↑ Lançamentos 885,2 984,2 (10,1%) ↓ 835,8 5,9% ↑ 2.665,2 2.575,1 3,5% ↑ Receita Operacional Líquida 685,9 654,5 4,8% ↑ 543,1 26,3% ↑ 2.282,4 1.950,1 17,0% ↑ Despesas com Vendas / Vendas Brutas 6,1% 6,7% (0,6 p.p.) ↓ 6,8% (0,7 p.p.) ↓ 6,9% 7,3% (0,4 p.p.) ↓ G&A / Lançamentos 4,3% 4,7% (0,3 p.p.) ↓ 3,1% 1,2 p.p. ↑ 5,8% 4,5% 1,2 p.p. ↑ G&A / Receita Operacional Líquida 5,6% 7,0% (1,4 p.p.) ↓ 4,8% 0,7 p.p. ↑ 6,8% 6,0% 0,8 p.p. ↑
  • 16.
    16 OUTRAS RECEITAS EDESPESAS OPERACIONAIS Nesse trimestre essa rubrica contabilizou R$ 21,4 milhões (+19,2% a/a e +41,4% t/t). Aceleramos acordos judiciais de causas não julgadas mas com grande probabilidade de perda que reduziu em R$ 69 milhões (21% t/t) o risco de perda possível da Companhia conforme nota explicativa 17.3. No ano as outras receitas e despesas operacionais totalizaram R$ 67,8 milhões (+12% a/a). (R$ milhões) 4T20 3T20 T/T (%) 4T19 A/A (%) 2020 2019 A/A (%) On-site Outras Receitas e Despesas Operacionais (21,0) (15,0) 39,5% ↑ (17,9) 16,8% ↑ (67,1) (60,5) 11,0% ↑ Despesas com demandas judiciais (22,5) (12,2) 85,3% ↑ (16,4) 37,6% ↑ (54,9) (39,8) 38,1% ↑ Outras 1,6 (2,9) (154,9%) ↓ (1,6) (200,5%) ↓ (12,2) (20,7) (41,1%) ↓ Equivalência Patrimonial (0,4) (0,1) 342,0% ↑ 5,0 107,7% ↑ (0,5) 3,2 114,8% ↑ Off-site Outras Receitas e Despesas Operacionais (0,4) (0,1) 289,8% ↑ (0,0) 1.654,2% ↑ (0,6) (0,0) 2.422,8% ↑ Despesas com demandas judiciais 0,0 0,0 0,0% ↑ 0,0 0,0% ↑ 0,0 0,0 0,0% ↑ Outras (0,4) (0,1) 289,8% ↑ (0,0) 1.654,2% ↑ (0,6) (0,0) 2.422,8% ↑ Equivalência Patrimonial 0,0 0,0 0,0% ↑ 0,0 0,0% ↑ 0,0 0,0 0,0% ↑ Consolidado Outras Receitas e Despesas Operacionais (21,4) (15,1) 41,4% ↑ (18,0) 19,2% ↑ (67,8) (60,5) 12,0% ↑ Despesas com demandas judiciais (22,5) (12,2) 85,3% ↑ (16,4) 37,6% ↑ (54,9) (39,8) 38,1% ↑ Outras 1,1 (3,0) (137,8%) ↓ (1,6) (170,9%) ↓ (12,8) (20,7) (38,1%) ↓ Equivalência Patrimonial (0,4) (0,1) 342,0% ↑ 5,0 107,7% ↑ (0,5) 3,2 114,8% ↑ EBITDA AJUSTADO No 4T20, o EBITDA ajustado do modelo on-site totalizou R$ 112,8 milhões (+12,9% a/a e +1,3% t/t) e encerrou 2020 em R$ 338,7 milhões (-4,2% a/a). No resultado consolidado, o EBITDA ajustado atingiu R$ 110,2 milhões no trimestre (+10,3% a/a e +4,4% t/t) e R$ 330,0 milhões em 2020 (-6,6% a/a). (R$ milhões) 4T20 3T20 T/T (%) 4T19 A/A (%) 2020 2019 A/A (%) On-site Lucro Líquido 74,7 76,3 (2,1%) ↓ 76,2 (2,0%) ↓ 209,2 263,5 (20,6%) ↓ (+) Resultado Financeiro 7,1 6,7 5,1% ↑ (4,0) 279,2% ↑ 23,1 (8,7) 364,4% ↑ (+) IR / CSLL 13,0 11,0 18,0% ↑ 10,4 24,6% ↑ 41,9 35,1 19,2% ↑ (+) Depreciação e Amortização 6,0 5,8 4,1% ↑ 5,7 5,0% ↑ 22,2 20,4 8,5% ↑ (+) Capitalização de Juros 6,9 5,0 38,6% ↑ 8,6 (19,6%) ↓ 24,2 33,6 (28,0%) ↓ (+) Despesas com SOP 6,0 6,0 (0,3%) ↓ 2,9 106,4% ↑ 18,7 8,7 116,5% ↑ (+) Participação dos Minoritários (0,9) 0,5 (285,0%) ↓ 0,1 (1.804%) ↓ (0,6) 0,9 (168,7%) ↓ EBITDA Ajustado¹ 112,8 111,4 1,3% ↑ 99,9 12,9% ↑ 338,7 353,5 (4,2%) ↓ Receita Líquida 685,9 654,5 4,8% ↑ 543,1 26,3% ↑ 2.282,4 1.950,1 17,0% ↑ Margem EBITDA Ajustada¹ 16,4% 17,0% (0,6 p.p.) ↓ 18,4% (2,0 p.p.) ↓ 14,8% 18,1% (3,3 p.p.) ↓ Off-site Lucro Líquido (2,7) (5,8) 53,1% ↑ 0,0 0,0% ↑ (8,9) 0,0 (0,0% ↑ (+) Resultado Financeiro (0,0) (0,0) (120,1%) ↓ (0,1) 88,6% ↑ (0,0) (0,1) 37,0% ↑ (+) Depreciação e Amortização 0,2 0,0 236,1% ↑ 0,0 0,0% ↑ 0,3 0,0 0,0% ↑↑ EBITDA Ajustado¹ (2,6) (5,8) 55,3% ↑ (0,0) (0,0%) ↓ (8,6) (0,0) (0,0%) ↓ Receita Líquida 0,0 0,0 0,0% ↑ 0,0 0,0% ↑ 0,0 0,0 0,0% ↑ Margem EBITDA Ajustada¹ 0,0% 0,0% 0,0 p.p. 0,0% 0,0 p.p. 0,0% 0,0% 0,0 p.p. Consolidado Lucro Líquido 72,0 70,5 2,1% ↑ 76,2 (5,6%) ↓ 200,3 263,5 (24,0%) ↓ (+) Resultado Financeiro 7,1 6,7 5,0% ↑ (4,0) 276,2% ↑ 23,1 (8,8) 362,1% ↑ (+) IR / CSLL 13,0 11,0 18,0% ↑ 10,4 24,6% ↑ 41,9 35,1 19,2% ↑ (+) Depreciação e Amortização 6,2 5,8 5,9% ↑ 5,8 7,2% ↑ 22,5 20,5 9,7% ↑ (+) Capitalização de Juros 6,9 5,0 38,6% ↑ 8,6 (19,6%) ↓ 24,2 33,6 (28,0%) ↓ (+) Despesas com SOP 6,0 6,0 (0,3%) ↓ 2,9 106,4% ↑ 18,7 8,7 116,5% ↑ (+) Participação dos Minoritários (0,9) 0,5 (285,0%) ↓ 0,1 (1.804%) ↓ (0,6) 0,9 (168,7%) ↓ EBITDA Ajustado¹ 110,2 105,6 4,4% ↑ 99,9 10,3% ↑ 330,0 353,5 (6,6%) ↓ Receita Líquida 685,9 654,5 4,8% ↑ 543,1 26,3% ↑ 2.282,4 1.950,1 17,0% ↑ Margem EBITDA Ajustada¹ 16,1% 16,1% (0,1 p.p.) ↓ 18,4% (2,3 p.p.) ↓ 14,5% 18,1% (3,7 p.p.) ↓ 1. Ajustado por juros capitalizados, despesas com planos de ações (não caixa) e minoritários
  • 17.
    17 RESULTADO FINANCEIRO A companhiafinalizou esse trimestre com um resultado financeiro negativo de R$ 7,1 milhões e R$ 23,1 milhões negativos no acumulado do ano. Posição de caixa líquido menor e queda da Selic reduziram a rentabilidade das aplicações (benchmark 100% CDI) que não conseguiram fazer frente ao custo de dívida, que aumentou com a captação de dívidas adicionais em meio à pandemia. (R$ milhões) 4T20 3T20 T/T (%) 4T19 A/A (%) 2020 2019 A/A (%) Consolidado Receitas Financeiras 7,0 6,1 15,6% ↑ 16,7 (58,2%) ↓ 32,6 61,2 (46,8%) ↓ Despesas Financeiras (14,1) (12,8) 10,0% ↑ (12,7) 10,6% ↑ (55,6) (52,4) 6,1% ↑ Resultado Financeiro (7,1) (6,7) (5,0%) ↓ 4,0 (276,2%) ↓ (23,1) 8,8 (362,1%) ↓ LUCRO LÍQUIDO No 4T20, o modelo on-site registrou lucro líquido de R$ 74,7 milhões (-2,0% a/a e -2,1% t/t) encerrando 2020 em R$ 209,2 milhões (-20,6% a/a). No consolidado o lucro líquido do trimestre totalizou R$ 72,0 milhões (-5,6% a/a e +2,1% t/t) sendo R$ 200,3 milhões (-24,0% a/a) em 2020. O lucro por ação desconsiderando as em tesouraria contabilizou R$ 2,04 (-25,1% a/a) em 2020. (R$ milhões) 4T20 3T20 T/T (%) 4T19 A/A (%) 2020 2019 A/A (%) On-site Resultado Líquido após IR & CSLL 73,8 76,8 (3,9%) ↓ 76,2 (3,2%) ↓ 208,6 264,4 (21,1%) ↓ (-) Participação Minoritários 0,9 (0,5) 285,0% ↑ (0,1) 1.803,8% ↑ 0,6 (0,9) 168,7% ↑ Lucro Líquido 74,7 76,3 (2,1%) ↓ 76,2 (2,0%) ↓ 209,2 263,5 (20,6%) ↓ Margem Líquida 10,9% 11,7% (0,8 p.p.) ↓ 14,0% (3,1 p.p.) ↓ 9,2% 13,5% (4,3 p.p.) ↓ Off-site Resultado Líquido após IR & CSLL (2,7) (5,8) 53,1% ↑ 0,0 (0,0%) ↓ (8,9) 0,0 (0,0%) ↓ (-) Participação Minoritários 0,0 0,0 0,0% ↑ 0,0 0,0% ↑ 0,0 0,0 0,0% ↑ Lucro Líquido (2,7) (5,8) 53,1% ↑ 0,0 (0,0%) ↓ (8,9) 0,0 (0,0%) ↓ Margem Líquida 0,0% 0,0% 0,0 p.p. 0,0% 0,0 p.p. 0,0% 0,0% 0,0 p.p. Consolidado Resultado Líquido após IR & CSLL 71,0 71,0 0,1% ↑ 76,2 (6,8%) ↓ 199,7 264,4 (24,5%) ↓ (-) Participação Minoritários 0,9 (0,5) 285,0% ↑ (0,1) 1.803,8% ↑ 0,6 (0,9) 168,7% ↑ Lucro Líquido 72,0 70,5 2,1% ↑ 76,2 (5,6%) ↓ 200,3 263,5 (24,0%) ↓ Margem Líquida 10,5% 10,8% (0,3 p.p.) ↓ 14,0% (3,5 p.p.) ↓ 8,8% 13,5% (4,7 p.p.) ↓ Lucro por Ação¹ (12 meses) (R$/ação) 1,92 1,96 (2,1%) ↓ 2,53 (24,0%) ↓ 1,92 2,53 (24,0%) ↓ Lucro por Ação² (12 meses) (R$/ação) (ex-tesouraria) 2,04 2,09 (2,5%) ↓ 2,73 (25,1%) ↓ 2,04 2,73 (25,1%) ↓ 1. Lucro por ação considera todas as ações emitidas (ajustadas em casos de desdobramento de ações). 2. Lucro por ação (ex-Tesouraria) considera ações emitidas (ajustadas em casos de desdobramento de ações) e desconsidera as mantidas em Tesouraria. ROE (%, 12 meses) e ROIC (%, 12 meses) Consolidado 2,8% 5,3% 9,7% 17,0% 20,7% 14,0% 3,6% 9,4% 13,4% 23,8% 28,3% 19,6% 1T15 2T15 3T15 4T15 1T16 2T16 3T16 4T16 1T17 2T17 3T17 4T17 1T18 2T18 3T18 4T18 1T19 2T19 3T19 4T19 1T20 2T20 3T20 4T20 ROE (12 meses) ROIC (12 meses)
  • 18.
    18 RESULTADO A APROPRIAR Encerramos2020 com uma margem REF de 35,2%, queda -4,0 p.p. a/a e -1,1 p.p. t/t. Além da perda de produtividade nas obras que sofreram paralizações no primeiro semestre por conta da pandemia, o setor também vem sofrendo pressões com aumento nos custos de materiais refletidos nas novas safras de obras. (R$ milhões) Dezembro 20 Setembro 20 T/T (%) Dezembro 19 A/A (%) On-site Receitas a Apropriar 949,5 745,3 27,4% ↑ 555,2 71,0% ↑ Custo das Unidades Vendidas a Apropriar (615,6) (474,9) 29,6% ↑ (337,6) 82,3% ↑ Resultado a Apropriar¹ 333,9 270,4 23,5% ↑ 217,7 53,4% ↑ Margem a Apropriar 35,2% 36,3% (1,1 p.p.) ↓ 39,2% (4,0 p.p.) ↓ 1. Contempla os empreendimentos que estão sob restrição por cláusula suspensiva. Ainda não constam valores para operação off-site CAIXA E APLICAÇÕES FINANCEIRAS (R$ milhões) Dezembro 20 Setembro 20 T/T (%) Dezembro 19 A/A (%) Consolidado Caixa e equivalentes de caixa 69,7 25,1 177,5% ↑ 48,4 44,2% ↑ Aplicações financeiras 1.235,7 1.377,7 (10,3%) ↓ 1.022,1 20,9% ↑ Caixa Total 1.305,5 1.402,8 (6,9%) ↓ 1.070,5 22,0% ↑ CONTAS A RECEBER A Companhia totalizou R$ 911,8 milhões em contas a receber ao final de 2020, alta de 45,9% a/a e 14,3% t/t em função do recorde de vendas. (R$ milhões) Dezembro 20 Setembro 20 T/T (%) Dezembro 19 A/A (%) On-site Até 2020¹ 84,8 748,3 (88,7%) ↓ 530,4 (84,0%) ↓ 2021 622,5 110,6 462,7% ↑ 155,6 300,0% ↑ 2022 300,5 55,4 442,3% ↑ 61,9 385,4% ↑ 2023 42,9 33,5 28,3% ↑ 22,5 90,9% ↑ 2024 32,4 44,4 (27,0%) ↓ 26,0 24,6% ↑ 2025 em diante 37,3 0,0 0,0% ↑ 0,0 0,0% ↑ Contas a Receber Total 1.120,6 992,3 12,9% ↑ 796,5 40,7% ↑ (-) Ajuste a valor presente (5,2) (4,5) (15,5%) ↓ (7,4) 29,9% ↑ (-) Provisão para créditos de liquidação duvidosa (174,4) (161,4) (8,1%) ↓ (118,2) (47,5%) ↓ (-) Provisão para distrato (29,2) (28,5) (2,4%) ↓ (45,7) 36,2% ↑ Contas a Receber 911,8 797,9 14,3% ↑ 625,1 45,9% ↑ Dias de Contas a Receber 146 136 7,1% ↑ 117 24,6% ↑ 1. Vencidos e a vencer. Ainda não constam valores para operação off-site
  • 19.
    19 RECEBÍVEIS TENDA A carteirade Recebíveis Tenda (on e off balance, risco Tenda) líquida de provisão cresceu 17,1% t/t e 54,3% a/a, reflexo da boa performance nas vendas. Diversas iniciativas na atividade de Cobrança levaram a uma melhora dos indicadores de adimplência que permitiu uma redução no índice de cobertura de provisão da carteira pós-chaves, que passou de 24,7% no 3T20 para 22,9% no 4T20. Recebíveis Tenda¹ (R$ milhões) 4T20 3T20 T/T (%) 4T19 A/A (%) Carteira Bruta 560,2 489,3 14,5% ↑ 389,3 43,9% ↑ Antes da entrega de chaves (pré-chaves) 86,2 70,8 21,7% ↑ 62,7 37,4% ↑ Após a entrega de chaves (pós-chaves) 474,0 418,5 13,3% ↑ 326,6 45,1% ↑ Carteira Líquida de Provisão 451,0 385,1 17,1% ↑ 292,3 54,3% ↑ Antes da entrega de chaves (pré-chaves) 85,4 70,2 21,7% ↑ 62,2 37,2% ↑ Após a entrega de chaves (pós-chaves) 365,6 314,9 16,1% ↑ 230,0 59,0% ↑ Recebíveis Tenda¹ (por aging, pós-chaves) 4T20 3T20 T/T (%) 4T19 A/A (%) Carteira Líquida de Provisão (R$ milhões) 365,6 314,9 16,1% ↑ 230,0 59,0% ↑ Não entregue² 175,6 133,6 31,4% ↑ 65,2 169,3% ↑ Entregue, adimplente 133,9 133,5 0,3% ↑ 123,5 8,4% ↑ Entregue, inadimplente <90d 40,6 34,0 19,3% ↑ 30,6 32,6% ↑ Entregue, inadimplente >90d 15,6 13,9 12,3% ↑ 10,7 45,3% ↑ Índice de Cobertura de Provisão (%) 22,9% 24,7% (1,9 p.p.) ↓ 29,6% (6,7 p.p.) ↓ Não entregue² 11,7% 13,4% (1,7 p.p.) ↓ 17,8% (6,1 p.p.) ↓ Entregue, adimplente 0,9% 1,0% (0,1 p.p.) ↓ 1,6% (0,7 p.p.) ↓ Entregue, inadimplente <90d 9,6% 10,1% (0,5 p.p.) ↓ 16,8% (7,2 p.p.) ↓ Entregue, inadimplente >90d 83,6% 84,9% (1,2 p.p.) ↓ 87,4% (3,8 p.p.) ↓ 1. Valores a receber, on e off balance, parcelados diretamente com a Companhia, uma vez que os financiamentos bancários não absorvem 100% do valor do imóvel. 2. Empreendimentos não entregues têm fluxos de financiamento pré-chaves e pós-chaves. O índice de cobertura de provisão diz respeito apenas ao fluxo pós-chaves.
  • 20.
    20 ENDIVIDAMENTO Encerramos o anocom uma dívida total de R$ 1,157 bilhão, em linha com o trimestre anterior. São 16,5 meses de duration com custo médio nominal de 4,0% a.a. Cronograma de Vencimento da Dívida (R$ milhões) 4T20 Financiamento Bancário Dívida Corporativa Financiamento a Construção (SFH) Consolidado 2021 599,7 175,6 424,1 0,0 2022 218,4 118,9 99,5 0,0 2023 210,3 35,8 174,5 0,0 2024 128,7 4,2 124,6 0,0 2025 em diante 0,0 0,0 0,0 0,0 Dívida Total 1.157,1 334,5 822,6 0,0 Duration (em meses) 16,5 Detalhamento da dívida (R$ milhões) Vencimento Taxas (a.a.) Saldo Devedor Dezembro 20 Saldo Devedor Setembro 20 Consolidado Dívida Total 1.157,1 1.152,9 Financiamento Bancário até 03/2024 CDI + 3,15% 334,5 334,3 Dívida Corporativa 822,6 818,5 CRI Tenda até 01/2021 CDI + 0,90% 321,2 318,1 DEB TEND14 até 09/2023 CDI + 1,75% 151,7 150,3 DEB TEND15 até 03/2024 CDI + 1,40% 150,9 149,7 DEB TEND16 até 12/2024 CDI + 1,30% 198,8 200,5 Custo Médio Ponderado da Dívida (R$ milhões) Saldo Devedor Dezembro 20 Saldo Devedor / Total Dívida Custo Médio (a.a.) Consolidado CDI 1.157,1 100,0% CDI + 1,8% TR 0,0 0,0% TR + 8,3% Total 1.157,1 100% 4,0% RATING A Standard & Poor’s (“S&P”) mantém o rating de crédito corporativo da Tenda em brAA+ com perspectiva positiva.
  • 21.
    21 DÍVIDA LÍQUIDA A relaçãodívida líquida sobre patrimônio líquido fechou o ano negativa em 9,8%, dentro do limite de -10% a +10% estipulado pela companhia. (R$ milhões) Dezembro 20 Setembro 20 T/T (%) Dezembro 19 A/A (%) Consolidado Dívida Bruta 1.157,1 1.152,1 0,4% ↑ 870,4 32,9% ↑ (-) Caixa e equivalentes de caixa e Aplicações financeiras (1.305,5) (1.402,8) (6,9%) ↓ (1.070,5) 22,0% ↑ Dívida Líquida (148,3) (250,7) 40,8% ↑ (200,0) 25,8% ↑ Patrimônio Líquido + Minoritários 1.518,1 1.480,5 2,5% ↑ 1.351,7 12,3% ↑ Dívida Líquida / (Patrimônio Líquido + Minoritários) (9,8%) (16,9%) 7,2 p.p. ↑ (14,8%) 5,0 p.p. ↑ EBITDA Ajustado (12 meses) 330,0 319,8 3,2% ↑ 353,5 (6,6%) ↓ GERAÇÃO DE CAIXA E DISTRIBUIÇÃO DE CAPITAL Em 2020, a Tenda totalizou uma geração de caixa operacional de R$ 70 milhões. A Companhia acelerou a atividade de algumas obras para combater reajustes nos custos de materiais consumindo R$ 54,3 milhões nesse trimestre. No 4T20, abrimos um novo plano de recompra de ações que totalizou R$ 5,3 milhões. Ao longo de 2020, a Tenda distribuiu para seus acionistas R$ 53,9 milhões entre dividendos pagos e recompra de ações, o equivalente a um payout de 26,9%. (R$ milhões) 4T20 3T20 T/T (%) 4T19 A/A (%) Consolidado Recompra de ações 5,3 0,0 0,0% ↑ (0,3) 2.065,4% ↑ Dividendos pagos 30,5 18,1 68,5% ↑ 15,4 98,4% ↑ Distribuição de Capital 35,8 18,1 97,7% ↑ 15,1 137,0% ↑ (R$ milhões, últimos 12 meses) 4T20 3T20 T/T (%) 4T19 A/A (%) Consolidado Recompra de ações 5,3 (0,3) 2.065,4% ↑ 62,2 (91,5%) ↓ Dividendos pagos 48,6 33,5 45,2% ↑ 57,8 (15,9%) ↓ Distribuição de Capital 53,9 33,2 62,3% ↑ 120,0 (55,1%) ↓ (R$ milhões) Dezembro 20 Setembro 20 T/T (%) Dezembro 19 A/A (%) Consolidado Variação do Caixa Disponível (97,4) (132,1) 26,3% ↑ 94,1 (203,4%) ↓ (-) Variação da Dívida Bruta 5,0 (195,1) 102,5% ↑ 125,6 (96,0%) ↓ (+) Distribuição de Capital 35,8 18,1 97,7% ↑ 15,1 137,0% ↑ Geração de Caixa¹ (66,6) 81,1 (182,1%) ↓ (16,4) (305,9%) ↓ Geração de Caixa Operacional² (54,3) 111,5 (148,7%) ↓ (12,5) (332,5%) ↓ On-site (44,7) 119,3 (137,4%) ↓ (11,3) (296,8%) ↓ Off-site (9,6) (7,8) (23,3%) ↓ (1,3) (645,5%) ↓ (R$ milhões) 2020 2019 T/T (%) Consolidado Variação do Caixa Disponível 235,0 214,9 9,4% ↑ (-) Variação da Dívida Bruta 286,7 327,9 (12,6%) ↓ (+) Distribuição de Capital 53,9 120,0 (55,1%) ↓ Geração de Caixa¹ 2,2 6,9 (68,4%) ↓ Geração de Caixa Operacional² 70,0 21,6 223,9% ↑ On-site 97,7 24,5 299,6% ↑ Off-site (27,7) (2,8) (874,8%) ↓ 1. A Geração de Caixa: Diferença entre a variação do Caixa Disponível e a variação da Dívida Bruta, ajustada a valores de Recompra, Dividendos, Redução de Capital e efeitos não operacionais. 2. A Geração de Caixa Operacional: Gerencial interno da companhia que não reflete ou compara-se aos números presentes nas demonstrações financeiras
  • 22.
    22 DEMONSTRATIVO DE RESULTADOS (R$milhões) 4T20 3T20 T/T (%) 4T19 A/A (%) 2020 2019 A/A (%) On-site Receita Líquida 685,9 654,5 4,8% ↑ 543,1 26,3% ↑ 2.282,4 1.950,1 17,0% ↑ Custos Operacionais (476,4) (443,2) 7,5% ↑ (370,1) 28,7% ↑ (1.572,0) (1.302,0) 20,7% ↑ Lucro Bruto 209,5 211,3 (0,8%) ↓ 173,1 21,0% ↑ 710,4 648,1 9,6% ↑ Margem Bruta 30,5% 32,3% (1,7 p.p.) ↓ 31,9% (1,3 p.p.) ↓ 31,1% 33,2% (2,1 p.p.) ↓ Despesas Operacionais (115,6) (116,7) (0,9%) ↓ (90,4) 27,9% ↑ (436,8) (357,3) 22,3% ↑ Despesas com Vendas (52,1) (55,6) (6,3%) ↓ (45,5) 14,7% ↑ (200,6) (162,5) 23,4% ↑ Desp. Gerais e Administrativas (36,1) (40,2) (10,1%) ↓ (26,3) 37,4% ↑ (146,4) (117,1) 25,0% ↑ Outras Desp. e Rec. Operacionais (21,0) (15,0) 39,5% ↑ (17,9) 16,8% ↑ (67,1) (60,5) 11,0% ↑ Depreciação e Amortização (6,0) (5,8) 4,1% ↑ (5,7) 5,0% ↑ (22,2) (20,4) 8,5% ↑ Equivalência Patrimonial (0,4) (0,1) (342,0%) ↓ 5,0 (107,7%) ↓ (0,5) 3,2 (114,8%) ↓ Lucro Operacional 93,8 94,6 (0,7%) ↓ 82,7 13,5% ↑ 273,6 290,8 (5,9%) ↓ Receita Financeira 7,0 6,0 15,5% ↑ 16,7 (58,3%) ↓ 32,5 61,2 (46,9%) ↓ Despesa Financeira (14,1) (12,8) 10,0% ↑ (12,8) 10,1% ↑ (55,6) (52,5) 6,0% ↑ Lucro Líquido antes de IR & CSLL 86,8 87,8 (1,2%) ↓ 86,6 0,1% ↑ 250,4 299,5 (16,4%) ↓ Impostos Diferidos (2,4) 0,6 (496,9%) ↓ (0,6) (308,2%) ↓ (4,6) (3,9) (19,7%) ↓ IR & CSLL (10,5) (11,6) (9,2%) ↓ (9,8) 7,4% ↑ (37,2) (31,3) 19,1% ↑ Lucro Líquido após IR & CSLL 73,8 76,8 (3,9%) ↓ 76,2 (3,2%) ↓ 208,6 264,4 (21,1%) ↓ (-) Participações Minoritárias 0,9 (0,5) 285,0% ↑ (0,1) 1.803,8% ↑ 0,6 (0,9) 168,7% ↑ Lucro Líquido 74,7 76,3 (2,1%) ↓ 76,2 (2,0%) ↓ 209,2 263,5 (20,6%) ↓ Off-site Receita Líquida 0,0 0,0 0,0% ↑ 0,0 0,0% ↑ 0,0 0,0 0,0% ↑ Custos Operacionais 0,0 0,0 0,0% ↑ 0,0 0,0% ↑ 0,0 0,0 0,0% ↑ Lucro Bruto 0,0 0,0 0,0% ↑ 0,0 0,0% ↑ 0,0 0,0 0,0% ↑ Margem Bruta 0,0% 0,0% 0,0 p.p. 0,0% 0,0 p.p. 0,0% 0,0% 0,0 p.p. Despesas Operacionais (2,7) (5,8) (53,0%) ↓ (0,1) 0,0% ↑ (8,9) (0,1) 0,0% ↑ Despesas com Vendas (0,0) 0,0 0,0% ↑ 0,0 0,0% ↑ (0,0) 0,0 0,0% ↑ Desp. Gerais e Administrativas (2,1) (5,7) (62,3%) ↓ (0,0) 0,0% ↑ (8,0) (0,0) 0,0% ↑ Outras Desp. e Rec. Operacionais (0,4) (0,1) 289,8% ↑ (0,0) 0,0% ↑ (0,6) (0,0) 0,0% ↑ Depreciação e Amortização (0,2) (0,0) 236,1% ↑ (0,0) 0,0% ↑ (0,3) (0,0) 0,0% ↑ Equivalência Patrimonial 0,0 0,0 0,0% ↑ 0,0 0,0% ↑ 0,0 0,0 0,0% ↑ Lucro Operacional (2,7) (5,8) 53,0% ↑ (0,1) 0,0% ↑ (8,9) (0,1) 0,0% ↑ Receita Financeira 0,0 0,0 63,6% ↑ 0,0 0,0% ↑ 0,0 0,0 0,0% ↑ Despesa Financeira (0,0) (0,0) 6,7% ↑ 0,1 105,7% ↑ (0,0) 0,1 0,0% ↑ Lucro Líquido antes de IR & CSLL (2,7) (5,8) 53,1% ↑ 0,0 0,0% ↑ (8,9) 0,0 0,0% ↑ Impostos Diferidos 0,0 0,0 0,0% ↑ 0,0 0,0% ↑ 0,0 0,0 0,0% ↑ IR & CSLL 0,0 0,0 0,0% ↑ 0,0 0,0% ↑ 0,0 0,0 0,0% ↑ Lucro Líquido após IR & CSLL (2,7) (5,8) 53,1% ↑ 0,0 0,0% ↑ (8,9) 0,0 0,0% ↑ (-) Participações Minoritárias 0,0 0,0 0,0% ↑ 0,0 0,0% ↑ 0,0 0,0 0,0% ↑ Lucro Líquido (2,7) (5,8) 53,1% ↑ 0,0 0,0% ↑ (8,9) 0,0 0,0% ↑ Consolidado Receita Líquida 685,9 654,5 4,8% ↑ 543,1 26,3% ↑ 2.282,4 1.950,1 17,0% ↑ Custos Operacionais (476,4) (443,2) 7,5% ↑ (370,1) 28,7% ↑ (1.572,0) (1.302,0) 20,7% ↑ Lucro Bruto 209,5 211,3 (0,8%) ↓ 173,1 21,0% ↑ 710,4 648,1 9,6% ↑ Margem Bruta 30,5% 32,3% (1,7 p.p.) ↓ 31,9% (1,3 p.p.) ↓ 31,1% 33,2% (2,1 p.p.) ↓ Despesas Operacionais (118,4) (122,6) (3,4%) ↓ (90,4) 30,9% ↑ (445,7) (357,3) 24,7% ↑ Despesas com Vendas (52,1) (55,6) (6,3%) ↓ (45,5) 14,7% ↑ (200,6) (162,5) 23,4% ↑ Desp. Gerais e Administrativas (38,3) (45,8) (16,5%) ↓ (26,3) 45,6% ↑ (154,4) (117,1) 31,9% ↑ Outras Desp. e Rec. Operacionais (21,4) (15,1) 41,4% ↑ (18,0) 19,2% ↑ (67,8) (60,5) 12,0% ↑ Depreciação e Amortização (6,2) (5,8) 5,9% ↑ (5,8) 7,2% ↑ (22,5) (20,5) 9,7% ↑ Equivalência Patrimonial (0,4) (0,1) (342,0%) ↓ 5,0 (107,7%) ↓ (0,5) 3,2 (114,8%) ↓ Lucro Operacional 91,1 88,7 2,7% ↑ 82,6 10,2% ↑ 264,6 290,7 (9,0%) ↓ Receita Financeira 7,0 6,1 15,6% ↑ 16,7 (58,2%) ↓ 32,6 61,2 (46,8%) ↓ Despesa Financeira (14,1) (12,8) 10,0% ↑ (12,7) 10,6% ↑ (55,6) (52,4) 6,1% ↑ Lucro Líquido antes de IR & CSLL 84,0 82,0 2,5% ↑ 86,7 (3,0%) ↓ 241,6 299,5 (19,3%) ↓ Impostos Diferidos (2,4) 0,6 (496,9%) ↓ (0,6) (308,2%) ↓ (4,6) (3,9) (19,7%) ↓ IR & CSLL (10,5) (11,6) (9,2%) ↓ (9,8) 7,4% ↑ (37,2) (31,3) 19,1% ↑ Lucro Líquido após IR & CSLL 71,0 71,0 0,1% ↑ 76,2 (6,8%) ↓ 199,7 264,4 (24,5%) ↓ (-) Participações Minoritárias 0,9 (0,5) 285,0% ↑ (0,1) 1.803,8% ↑ 0,6 (0,9) 168,7% ↑ Lucro Líquido 72,0 70,5 2,1% ↑ 76,2 (5,6%) ↓ 200,3 263,5 (24,0%) ↓
  • 23.
    23 BALANÇO PATRIMONIAL (R$ milhões)Dezembro 20 Setembro 20 T/T (%) Dezembro 19 A/A (%) Consolidado Ativo Circulante 2.758,9 3.053,2 (9,6%) ↓ 2.506,4 10,1% ↑ Caixa e Equivalentes de Caixa 69,7 25,1 177,5% ↑ 48,4 44,2% ↑ Títulos e Valores Imobiliários 1.235,7 1.377,7 (10,3%) ↓ 1.022,1 20,9% ↑ Recebíveis de Clientes 563,0 539,9 4,3% ↑ 406,6 38,5% ↑ Imóveis a Comercializar 777,7 1.015,5 (23,4%) ↓ 955,6 (18,6%) ↓ Outros Contas a Receber 112,8 95,0 18,6% ↑ 73,7 52,9% ↑ Ativo Não-Circulante 1.292,6 906,6 42,6% ↑ 827,6 56,2% ↑ Recebíveis de Clientes 348,8 258,0 35,2% ↑ 218,5 59,6% ↑ Imóveis a Comercializar 875,2 580,9 50,7% ↑ 537,0 63,0% ↑ Outros 68,6 67,7 1,2% ↑ 72,1 (4,9%) ↓ Intangível e Imobilizado 143,2 107,1 33,8% ↑ 101,9 40,6% ↑ Investimentos 42,0 42,5 (1,2%) ↓ 42,6 (1,4%) ↓ Ativo Total 4.236,7 4.109,4 3,1% ↑ 3.478,5 21,8% ↑ Passivo Circulante 1.216,4 1.043,5 16,6% ↑ 579,0 110,1% ↑ Empréstimos e Financiamentos 175,6 108,4 62,0% ↑ 8,5 1.961,9% ↑ Debêntures 424,1 370,1 14,6% ↑ 5,6 7.475,0% ↑ Obrig. com Terrenos e Adiant. de Clientes 370,8 267,9 38,4% ↑ 340,9 8,8% ↑ Fornecedores e Materiais 38,2 84,9 (55,1%) ↓ 38,9 (2,0%) ↓ Impostos e Contribuições 23,6 29,3 (19,6%) ↓ 30,0 (21,6%) ↓ Outros 184,2 182,8 0,7% ↑ 155,0 18,8% ↑ Passivo Não-Circulante 1.502,2 1.585,4 (5,2%) ↓ 1.547,8 (2,9%) ↓ Empréstimos e Financiamentos 158,9 225,2 (29,4%) ↓ 51,5 208,6% ↑ Debêntures 398,5 448,4 (11,1%) ↓ 804,8 (50,5%) ↓ Obrig. com Terrenos e Adiant. de Clientes 806,6 824,8 (2,2%) ↓ 602,4 33,9% ↑ Impostos Diferidos 15,7 14,0 12,0% ↑ 11,8 32,7% ↑ Provisão para Contingências 32,3 27,6 17,0% ↑ 28,7 12,7% ↑ Outros credores 0,0 0,0 0,0% ↑ 0,0 0,0% ↑ Outros 90,2 45,4 98,7% ↑ 48,6 85,5% ↑ Patrimônio Líquido Total 1.518,1 1.480,5 2,5% ↑ 1.351,7 12,3% ↑ Patrimônio Líquido 1.517,6 1.479,1 2,6% ↑ 1.350,6 12,4% ↑ Participação dos Minoritários 0,5 1,4 (64,8%) ↓ 1,1 (54,9%) ↓ Total do Passivo e Patrimônio Líquido 4.236,7 4.109,4 3,1% ↑ 3.478,5 21,8% ↑
  • 24.
    24 FLUXO DE CAIXA (R$milhões) 4T20 3T20 T/T (%) 4T19 A/A (%) 2020 2019 A/A (%) Consolidado Caixa líquido gerado (aplicado) - operacional (48,6) 94,2 (151,6%) ↓ (0,1) (78.325,8%) ↓ 94,0 68,8 36,6% ↑ Lucro Líquido (Prejuízo) antes dos impostos 84,0 82,0 2,5% ↑ 86,7 (3,0%) ↓ 241,6 299,5 (19,3%) ↓ Despesas/receitas que não impactam capital de giro 0,0 0,0 0,0% ↑ 0,0 0,0% ↑ 0,0 0,0 0,0% ↑ Depreciações e Amortizações 3,2 9,6 (66,5%) ↓ 9,0 (64,1%) ↓ 30,1 31,7 (5,0%) ↓ Provisão (reversão) para créditos de liquidação duvidosa e distratos 15,0 (6,3) 337,8% ↑ 8,7 71,5% ↑ 41,5 11,3 265,7% ↑ Ajuste a valor presente 0,7 (1,6) 143,6% ↑ 0,9 (22,4%) ↓ (2,2) (2,6) 14,7% ↑ Impairment 2,0 (2,6) 180,2% ↑ (3,1) 166,8% ↑ (1,0) (6,0) 82,6% ↑ Equivalência Patrimonial 0,4 0,1 342,0% ↑ (5,0) 107,7% ↑ 0,5 (3,2) 114,8% ↑ Provisão por contingências 10,2 (3,7) 375,2% ↑ 3,5 191,4% ↑ 9,5 (4,9) 294,4% ↑ Juros e encargos não realizados, líquidos (1,2) 9,5 (112,7%) ↓ 4,6 (126,5%) ↓ 32,9 16,8 96,0% ↑ Provisão para garantia 18,7 1,6 1.077,5% ↑ 4,4 326,6% ↑ 21,4 6,5 232,1% ↑ Provisão para distribuição de lucros (1,0) 1,9 (153,3%) ↓ 1,8 (154,6%) ↓ 12,3 15,0 (17,7%) ↓ Despesas com plano de opções 6,0 6,0 (0,3%) ↓ 2,9 106,4% ↑ 18,7 8,7 116,5% ↑ Baixa de Imobilizado e intangível líquido 8,7 (3,2) 370,9% ↑ 0,0 0,0% ↑ 5,5 0,0 0,0% ↑ Outras provisões (2,5) (0,7) (255,7%) ↓ (0,5) (356,9%) ↓ (3,4) (1,6) (105,4%) ↓ Arrendamento mercantil 0,0 (4,5) 100,0% ↑ 0,0 0,0% ↑ 0,0 0,0 0,0% ↑ Impostos diferidos (11,6) (1,3) (760,2%) ↓ (0,3) (4.227,0%) ↓ (9,7) 0,8 (1.394,0%) ↓ Clientes (128,3) (39,8) (222,1%) ↓ (15,7) (717,4%) ↓ (324,1) (165,2) (96,2%) ↓ Imóveis a venda (66,5) (31,5) (111,1%) ↓ (179,5) 63,0% ↑ (139,0) (422,4) 67,1% ↑ Outras contas a receber (13,0) (4,6) (183,1%) ↓ (27,6) 52,8% ↑ (29,2) (49,1) 40,6% ↑ Fornecedores (46,8) 31,1 (250,4%) ↓ (21,0) (122,7%) ↓ (0,8) 17,5 (104,4%) ↓ Impostos e contribuições 0,2 (10,3) 102,3% ↑ 1,4 (83,4%) ↓ (2,4) 2,2 (208,6%) ↓ Salários, encargos sociais e participações (16,9) 9,8 (272,9%) ↓ (7,1) (136,4%) ↓ (5,7) (10,8) 47,2% ↑ Obrigações por aquisição de imóveis 86,1 65,5 31,5% ↑ 140,7 (38,8%) ↓ 212,6 353,3 (39,8%) ↓ Outras contas a pagar 14,8 5,9 151,6% ↑ 4,0 267,6% ↑ 21,9 1,0 2.054,3% ↑ Operações de conta corrente (0,0) 0,4 (112,8%) ↓ (0,2) 76,2% ↑ 0,6 0,7 (25,1%) ↓ Impostos Pagos (11,0) (18,9) 41,8% ↑ (8,6) (27,6%) ↓ (37,7) (30,3) (24,5%) ↓ Caixa líquido gerado (aplicado) - investimento 138,6 121,0 14,6% ↑ (110,9) 225,0% ↑ (249,8) (209,2) (19,4%) ↓ Atividades de Investimento 0,0 0,0 0,0% ↑ 0,0 0,0% ↑ 0,0 0,0 0,0% ↑ Aquisição de propriedades e equipamentos (17,0) (12,7) (33,7%) ↓ (12,0) (42,4%) ↓ (55,2) (44,8) (23,2%) ↓ Aplicação / resgate de títulos e valores mobiliários 155,8 133,7 16,5% ↑ (98,9) 257,4% ↑ (194,4) (164,3) (18,3%) ↓ Aumento de Investimentos (0,1) 0,0 0,0% ↑ 0,0 0,0% ↑ (0,1) 0,0 0,0% ↑ Dividendos Recebidos 0,0 0,0 0,0% ↑ 0,0 0,0% ↑ 0,0 0,0 0,0% ↑ Caixa líquido gerado (aplicado) - financiamento (45,4) (216,2) 79,0% ↑ 100,4 (145,2%) ↓ 177,2 154,4 14,8% ↑ Recompra de ações (5,3) 0,0 0,0% ↑ 0,3 (2.065,4%) ↓ (5,3) (62,2) 91,5% ↑ Aumento de Capital 0,0 0,0 0,0% ↑ 0,0 0,0% ↑ 0,0 0,0 0,0% ↑ Aumento de Reserva de Capital (0,3) 9,1 (103,0%) ↓ 1,4 (119,9%) ↓ 0,8 5,5 (85,3%) ↓ Dividendos Pagos (30,5) (18,1) (68,5%) ↓ (15,4) (98,4%) ↓ (48,6) (57,8) 15,9% ↑ Aumento empréstimos e financiamentos 0,8 57,8 (98,7%) ↓ 202,1 (99,6%) ↓ 648,7 693,5 (6,5%) ↓ Amortização de empréstimo e financiamento (7,8) (263,9) 97,0% ↑ (86,6) 91,0% ↑ (413,0) (418,0) 1,2% ↑ Pagamento de arrendamento (2,1) (0,9) (125,7%) ↓ (0,9) (127,7%) ↓ (4,8) (3,8) (28,1%) ↓ Operações de mútuo (0,2) (0,2) 3,3% ↑ (0,5) 56,8% ↑ (0,6) (2,9) 78,6% ↑ Aumento (redução) de caixa e equivalentes 44,6 (0,9) 4.800,5% ↑ (10,6) 522,8% ↑ 21,4 14,1 52,0% ↑ Saldo no início do período 25,1 26,1 (3,6%) ↓ 58,9 (57,3%) ↓ 48,4 34,3 41,0% ↑ Saldo no fim do período 69,7 25,1 177,5% ↑ 48,4 44,2% ↑ 69,7 48,4 44,2% ↑
  • 25.
    25 RELAÇÕES COM INVESTIDORES RenanBarbosa Sanches CFO e Diretor Executivo de Relações com Investidores Alvaro Kaue Gerente de Relações com Investidores Bruno Souza Especialista de Relações com Investidores Relações com Investidores Tel.: +55 (11) 3111-9909 E-mail: ri@tenda.com Website: ri.tenda.com ASSESSORIA DE IMPRENSA NOVAPR Marilia Paiotti Tel.: +55 (11) 5180-9079 E-mail: marilia.paiotti@novapr.com.br SOBRE A TENDA A Tenda (B3: TEND3) é uma das principais construtoras do Brasil e está listada no Novo Mercado, o mais alto nível de governança corporativa da B3. Com foco em habitação popular, atua em nove regiões metropolitanas do país com empreendimentos voltados para o grupo 2 do programa Casa Verde e Amarela (“PCVA”).
  • 26.
    In a yearof record operating results, net revenue grew 17.0% YoY reaching R$2.3 billion, gross profit amounted to R$710.4 million (+9.6% YoY) with a reduction in net income to R$200.3 million (-24.0% YoY)
  • 27.
    2 São Paulo, March11, 2021 - Construtora Tenda S.A. (“Company”, “Tenda”), a leading Brazilian homebuilder and real estate developer focused on affordable housing, announces today its results for the fourth quarter and the full year of 2020. HIGHLIGHTS FINANCIALS ▪ NetRevenueofR$2.3billionin2020(+17.0%YoY).In4Q20,itaccountedforR$685.9million(+26.3%YoY); ▪ Adjustedgrossmarginof32.2%in2020(-2.8p.p.YoY).In4Q20,theindicatorrecorded31.5%(-1.9p.p.YoY); o Backlog margin ended 2020 at 35.2% (-4.0 p.p. YoY) impacted by the loss of productivity in the construction sites that were paralyzed in 1H20 due to the pandemic and an increase in the construction materials costs; ▪ Net Income of R$200.3 million in the year (-24% YoY), totaling R$72.0 million in the quarter. The off- site model amounted to a loss of R$-8.9 million in the year, of which R$-2.7 million was recorded for the quarter; ▪ OperatingcashgenerationendedtheyearonapositivenoteatR$70.0million(+223.9%YoY).In4Q20, the Company accelerated the activity of some construction sites to off-set readjustments in material costs, consuming R$54.3 million; ▪ Net debt/Equity -9.8%, de-leveraging reduced due to dividend distribution and and stock buyback throughout the year; OPERATIONS ▪ 20 projects launched in 4Q20 with PSV of R$885.2 million (+5.9% YoY and -10.1% QoQ); o Record year for launches reaching PSV of R$2.67 billion (+3.5% YoY); ▪ Recordquarterlygrosssales ofR$854.7million(+27.7%YoYand+2.2%QoQ)andgrossSoSof35.0% (+4.5 p.p. YoY and -1.3% QoQ). In a record year, R$2.92 billion was recorded in PSV (+30.4% YoY); o Record quarterly net sales of R$795.2 million in 4Q20 (+29.1% YoY and +7.2% QoQ) and net VSO of 32.5% (+4.5 p.p. YoY and +0.2 p.p. QoQ). In a record year, R$2.92 billion was recorded in PSV (+30.4% YoY); o Cancellations at 7.0% (-1.0 p.p. YoY and -4.2 p.p. QoQ) on gross sales in 4Q20, ending the year recording an average of 12.6% (+3.7 p.p. YoY) ; ▪ PSV transferred of R$619.8 million this quarter (+12.1% YoY and -1.0% QoQ) totaling R$2.14 billion for the year (+30.7% YoY); ▪ Landbank reached R$10.97 billion in PSV in the end of 2020 (+3.3% YoY) COVID-19 ▪ Record launches for 2020 with a recovery in the second half of the year; ▪ Sales at record-high levels signaling demand resilience and efficiency of both online and third-party sales channels. ▪ Construction sites transfers were normalized throughout 4Q20.
  • 28.
    3 MESSAGE FROM THEMANAGEMENT Even in a challenging year marked by the Covid-19 pandemic, Tenda posted record operating results for launches, sales, and transfers, once again attesting to the resilience of the Brazilian affordable housing market and consolidating itself as the main company exclusively focused on projects aimed at bracket 2 of the Programa Casa Verde e Amarela. More than 18,000 housing units were launched in 2020, accounting for a PSV of R$2.66 billion (+3.5% YoY) in line with a significant increase in net sales, which reached a PSV of R$2.55 billion (+25.2% YoY) and quarterly SoS of 32.5% (+4.5 p.p. YoY). It should be noted that the record performance in sales occurred organically without the need to reduce prices or increase selling expenses, largely due to the major digital transformation that we have brought about to the entire sales process, both at our own stores and in the relationship with partner sales companies, allowing for enhanced efficiency even within the complex scenario of social distance. The positive operating performance, especially in the second half of 2020, is reflected in the improvement in the net operational revenue. We posted record levels in net operating revenues which totaled R$2.29 billion this year (+17% YoY). On the other hand, adjusted gross margin was adversely impacted by the effects of the pandemic ending the year at 32.2% (-2.8 p.p. YoY) with emphasis on the loss of productivity of some construction sites that were paralyzed in the first half (normalized 3Q20). Due to pressures with an increase in material costs that the sector has been suffering, the profit margin to be appropriated also decreased by -1.1 p.p. q/q and -4.0 p.p. YoY due to the new harvests of construction sites that already reflect this increase. With that, Tenda delivered a net profit of R$200.3 million, down 24.0% YoY, closing the year with 14.0% of ROE (-6.7 p.p. YoY), 19.6% of ROIC (-8.7 p.p. YoY) and earnings of R$2.04 per share (ex -Treasury), a drop of 25.1% YoY. In this last quarter, the Company consumed R$54.3 million in operating cash, by adopting the strategy of accelerating activities of some construction sites as means to prevent price adjustments in 2021, ending the year with a generation of R$70.0 million in operating cash. Tenda reiterates its option for a conservative financial management. The Company maintains a net cash position (R$148.3 million at the end of 2020) resulting in a net debt-to-equity ratio of -9.8%. The strategic decision is validated by the recurrence of events that impact cash generation, such as delays in transfers within the Programa Casa Verde and Amarela. In 2020 we made important progress in the off-site project and became ever more convinced that it is the major growth platform of the Company, with highlights on the completed pilot projects which proved the initial theses of product quality and production efficiency, on Marcelo Willer (ex-CEO of Alphaville Urbanismo), who joined the company as a minority investor in the project as announced last quarter, and the investment we are making in setting up a factory with a high production capacity of up to 10,000 units per year and whose operations are scheduled to start in the second half of 2021. As of the year 2021, we have the ambition to form a robust land bank to scale up the operation, seeking to operate at full capacity of the new plant in 2026. Tenda points out that it remains focused on long term value generation seeking to build competitive differentials through civil construction industrialization, aiming to be the company which consistently delivers the highest return to its shareholders.
  • 29.
    4 GUIDANCE In order tooffer aligned information and provide predictability about our figures to the market, in 2021 the Company chose to disclose its projections (guidance) of the on-site model based on the expectations of the management, on internal studies carried out, and on the economic and financial outlook of the market we operate. • In 2021, for the Adjusted Gross Margin, referred to as the ratio between the gross result (less the financial charges described in explanatory note 11 of the financial statements) and the consolidated net revenue for the year, it is estimated a fluctuation between a minimum of 30.0% and a maximum of 32,0%. • In 2021, for the Net Sales, referred to as the result of the deduction between gross sales (R$ million) and cancellations (R$ million) recorded in the year, all values adjusted to Tenda's equity, a variation is estimated between the minimum of R$2,800 million and a maximum of R$3,000 million. Guidance 2021 Lower Limit Upper Limit Adjusted Gross Margin (%) 30.0% 32.0% Net Sales (R$ MM) 2,800.0 3,000.0 TENDA'S ON-SITE AND OFF-SITE OPERATIONS BREAKDOWN In compliance with the commitment assumed, from this quarter onwards, we will present the data of our on-site and off-site operations separately. On-site: Model in which the company has been operating since 2013, characterized by the construction of apartments in construction sites using the construction method of concrete wall with aluminum form, in metropolitan areas, with a minimum production demand of 1,000 units/year. Off-site Model characterized by the development of houses produced in a factory using the woodframe construction technology and assembled at the construction site. Since this model does not require a minimum local demand, it opens up the possibility for the company to explore smaller markets operating in small- and medium-sized cities in the country. Consolidated: Aggregate result of the two operations.
  • 30.
    5 Off-site On Tenda Day,an event held for investors on December 16, 2020, we announced the investment we are making in setting up a high production plant. In addition, we published the images of the first finished houses of the pilot project, which consists of a gated community with 49 houses located in Mogi das Cruzes on a land that was already part of our landbank. In this initial phase, the purpose of the off-site project is to explore the demand of medium-sized cities in the interior of São Paulo. New Factory: The new plant will be opened in the second half of 2021 in the city of Jaguariúna, in the interior of São Paulo. It has more than 18,000 m² and a high production capacity of 10 thousand units per year is expected to be achieved by 2016. The new machinery is on its way and is scheduled to reach Brazil in the second quarter this year. We are starting to demobilize our innovation center to incorporate the existing machinery into the new plant. DATEC Step: DATEC is the technical evaluation document that accredits the materials used and processes adopted for a given construction system. Obtaining DATEC certification for the new off-site construction system qualifies us to operate on the same model as Tenda on-site, allowing transfers with CEF during the construction sites. The certification process is underway and is expected to be issued in the first half of 2021. Tecverde Partnership: Tecverde is a pioneer in woodframe constructions in Brazil, with more than 10 years of experience and more than 4,500 units built. In order to accelerate our learning curve in the construction system, in 4Q20 Tenda entered into a partnership with Tecverde , which is building 50 houses in the interior of São Paulo.
  • 31.
    6 Indicators to bemonitored: In off-site construction, the process of implementing and converting the concepts of production engineering into civil engineering is facilitated. The houses are produced in a controlled environment, protected from weathering, with the possiblity of productivity gains by operating at full capacity in 3 shifts and improved efficiency through automation. The production of houses in a factory and the use of the construction site only for assemblying them allows the company to operate in low-scale local markets. The possibility of operating at a low local scale substantially increases the number of addressable markets, increasing the global scale to be explored. The high global scale allows the company to have competitive costs through the development of the supply chain, which can be translated into better products offered (location, area, price, and urbanism) and higher speed of sales, thus reinforcing the gain of scale. The faster the flywheel spins, the greater the Company's competitive advantage in the long run. The success of the off-site project depends on the gain of scale, the land purchase monitoring, and the launch indicators, which are a beacon to monitor the speed the projects are implemented. We ended 2020 with two pilot projects and reinforced that 2021 and 2022 continue to be years of learning by scaling up the volume of launches after 2023. High SoS High global sacle Unimaginable product Cost reduction Operations in a large number of markets Low local scale High Global Scale
  • 32.
    7 ESG In 3Q20 thecompany presented a starting point with the main elements of ESG impact based on the material topics proposed by the SASB (Sustainability Accounting Standards Board) and S&P SAM CSA (Corporate Sustainability Assessment) for the sector, in addition to other material aspects associated with Tenda's performance in the affordable housing segment. Tenda's main elements with ESG impact can be grouped together into three pillars: Social Inclusion Products available to low-income families through projects that contribute to enhanced well-being, sanitation, and infrastructure of communities. At Tenda, a B3 company fully dedicated to building affordable housing units, all the projects fall into bracket 2 of the Programa Casa Verde e Amarela. The Company offers apartments with prices 19% lower than the average charged by the main competitors (according to sales information for 4Q20), providing families which never had this alternative with access to their own properties. In 2020, Tenda reached families with an average monthly family income of R$2,473, which is closer to the floor value than to the ceiling value of PCVA bracket 2 (range of monthly family income between R$2,000 and R$4,000). Average Sales Prices (R$ mil) 4Q20 3Q20 QoQ (%) 4Q19 YoY (%) Tenda (R$ / unit) 142 143 (0.7%) ↓ 139 2.2% ↑ PCVA¹ (R$ / unit) 175 171 2.3% ↑ 165 6.1% ↑ % Average Sales Prices (Tenda / PCVA) 81.1% 83.6% (3.0%) ↓ 84.2% (3.7%) ↓ ¹ Weighted average price between MRV (only MRV) and Direcional (only Direcional) ¹Based on gross sales between Jan/20 and Dec ² Weighted average price between MRV (100%) and Direcional (PCVA 2 and 3 only) Closer to the floor value than bracket 2 of PCVA Social inclusion AVERAGE MONTHLY FAMILY INCOME (R$, Jan to Dec/20¹) 2.473 142 175 Tenda PCVA AVERAGE PRICE PER UNIT SOLD (R$ thous, 4Q20²) 2.000 4.000 B3 COMPANY FULLY DEDICATED TO PROJECTS IN CASA VERDE E AMARELA PROGRAM Properties affordable by low-income families
  • 33.
    8 Respect for customersand employees Quality products, delivered on-schedule and made safely by directly hired professionals and with growth opportunities. All projects launched since 2013, the year that marks the beginning of the current business model, were delivered within the contractual term, one of the main commitments assumed by Management with its customers. The Company has turned its efforts towards customer satisfaction and, in 2020, the Net Promoting Score (NPS), one of the main global metrics of satisfaction, became part of the goals of its main officers. At Tenda, nearly all employees involved in the construction of the buildings are employed directly by the Company, and not outsourced, as is usually the practice in the sector. In addition to enabling the implementation of the industrial approach to construction, which is Tenda's main competitive differential, the initiative brings more security and stability to employees. Tenda adopts strict occupational health and safety practices, continuously monitoring risks and indicators. Indicators 4Q20 3Q20 QoQ (%) 4Q19 YoY (%) On-schedule deliveries (%)¹ 100% 100% 0.0% ↑ 100% 0.0% ↑ Number of direct employees ² 3,757 3,682 2.0% ↑ 3,558 5.6% ↑ Number of indirect employees 1,620 1,900 (14.7%) ↓ 1,762 (8.1%) ↓ Total employees 5,377 5,582 (3.7%) ↓ 5,320 1.1% ↑ % direct employees/total 70% 66% 5.9% ↑ 67% 4.5% ↑ ¹ Projects launched since 2013, the starting point of the current business model ² Employees directly hired by the Company Respect for clients and employees 5.377 EMPLOYEES 70% ARE DIRECTLY HIRED BY TENDA Clients receive the housing units within schedule 100%OF PROJECTS LAUNCHED AFTER 2013 WERE DELIVERED WITHIN SCHEDULE Most employees directed hired SAFE ENVIRONMENT: INDUSTRIAL RISK MONITORING STANDARDS Own employees in ~ 100% of the tower's activities
  • 34.
    9 Commitment to Ethicsand Governance Rigor and responsible performance in all stages of the viability of the projects, with management in line with the best corporate practices Ethical behavior is part of Tenda's culture and is at the heart of the Company's decisions, from the prospecting and legalization processes for future projects to the best practices towards employees and suppliers. The company maintains an Ethics Committee coordinated by the CEO, codes of ethics and conduct for employees and suppliers, and independent reporting channels. A Novo Mercado company, B3's highest Corporate Governance level, Tenda meets 90% of the best practices established by Brazilian Institute of Corporate Governance (IBGC) under the Brazilian Governance Code. All Board Members are independent, and all directors are statutory officers, with 37% of their total compensation linked to long-term incentives. ³ Based on answers to Tenda's CVM 586(Brazilian Securities Exchange Commission) form 4 According to the management proposal approved at the Annual Shareholders' Meeting for the year 2020 For more ESG-related information, contact Tenda's IR team at ri@tenda.com Commitment to ethics and governance Culture focused on ethical conduct Reference Governance ✓ Ethics Committee coordinated by the CEO ✓ Ethics Code for employees and suppliers ✓ Preliminary Assessment og suppliers ✓ Independent Reporting Hotline 90% COMPLIANT WITH IBGC’S BEST PRACTICES IN 2019?³ ✓ A Novo Mercado Company ✓ All board members are independent ✓ All the directors are statutory officers, with 37% of compensation linked to long term incentives4
  • 35.
    10 OPERATIONAL AND FINANCIALHIGHLIGHTS Off-site operation values are not provided yet, Financial Highlights (R$ million) 4Q20 3Q20 QoQ (%) 4Q19 YoY (%) 2020 2019 YoY (%) On-site Net Revenue 685.9 654.5 4.8% ↑ 543.1 26.3% ↑ 2,282.4 1,950.1 17.0% ↑ Adjusted Gross Profit¹ 216.4 216.3 0.1% ↑ 181.7 19.1% ↑ 734.6 681.7 7.8% ↑ Adjusted Gross Margin¹ (%) 31.5% 33.0% (1.5 p.p.) ↓ 33.4% (1.9 p.p.) ↓ 32.2% 35.0% (2.8 p.p.) ↓ Adjusted EBITDA² 112.8 111.4 1.3% ↑ 99.9 12.9% ↑ 338.7 353.5 (4.2%) ↓ Adjusted EBITDA Margin² (%) 16.4% 17.0% (0.6 p.p.) ↓ 18.4% (2.0 p.p.) ↓ 14.8% 18.1% (3.3 p.p.) ↓ Net Income (Loss)³ 74.7 76.3 (2.1%) ↓ 76.2 (2.0%) ↓ 209.2 263.5 (20.6%) ↓ Net Margin (%) 10.9% 11.7% (0.8 p.p.) ↓ 14.0% (3.1 p.p.) ↓ 9.2% 13.5% (4.3 p.p.) ↓ Backlog Revenues 949.5 745.3 27.4% ↑ 555.2 71.0% ↑ 949.5 555.2 71.0% ↑ Backlog Margin (%) 35.2% 36.3% (1.1 p.p.) ↓ 39.2% (4.0 p.p.) ↓ 35.2% 39.2% (4.0 p.p.) ↓ Operating Cash Generation⁴ (44.7) 119.3 (137.4%) ↓ (11.3) (296.8%) ↓ 97.7 24.5 299.6% ↑ Off-site Net Revenue 0.0 0.0 0.0% ↑ 0.0 0.0% ↑ 0.0 0.0 0.0% ↑ Adjusted EBITDA² (2.6) (5.8) 55.3% ↑ (0.0) (0.0% ↑ (8.6) (0.0) 0.0% ↑ Adjusted EBITDA Margin² (%) 0.0% 0.0% 0.0 p.p. 0.0% 0.0 p.p. 0.0% 0.0% 0.0 p.p. Net Income (Loss)³ (2.7) (5.8) 53.1% ↑ 0.0 0.0% ↑ (8.9) 0.0 0.0% ↑ Net Margin (%) 0.0% 0.0% 0.0 p.p. 0.0% 0.0 p.p. 0.0% 0.0% 0.0 p.p. Operating Cash Generation⁴ (9.6) (7,8) (23.3%) ↓ (1.3) (645.5%)↑ (27.7) (2.8) (874.8%) ↑ Consolidated Net Revenue 685.9 654.5 4.8% ↑ 543.1 26.3% ↑ 2,282.4 1,950.1 17.0% ↑ Adjusted Gross Profit¹ 216.4 216.3 0.1% ↑ 181.7 19.1% ↑ 734.6 681.7 7.8% ↑ Adjusted Gross Margin¹ (%) 31.5% 33.0% (1.5 p.p.) ↓ 33.4% (1.9 p.p.) ↓ 32.2% 35.0% (2.8 p.p.) ↓ Adjusted EBITDA² 110.2 105.6 4.4% ↑ 99.9 10.3% ↑ 330.0 353.5 (6.6%) ↓ Adjusted EBITDA Margin² (%) 16.1% 16.1% (0.1 p.p.) ↓ 18.4% (2.3 p.p.) ↓ 14.5% 18.1% (3.7 p.p.) ↓ Net Income (Loss)³ 72.0 70.5 2.1% ↑ 76.2 (5.6%) ↓ 200.3 263.5 (24.0%) ↓ Net Margin (%) 10.5% 10.8% (0.3 p.p.) ↓ 14.0% (3.5 p.p.) ↓ 8.8% 13.5% (4.7 p.p.) ↓ Backlog Revenues 949.5 745.3 27.4% ↑ 555.2 71.0% ↑ 949.5 555.2 71.0% ↑ Backlog Margin (%) 35.2% 36.3% (1.1 p.p.) ↓ 39.2% (4.0 p.p.) ↓ 35.2% 39.2% (4.0 p.p.) ↓ Net Debt / (Shareholders’ Equity + Minority Shareholders) (%) (9.8%) (16.9%) 7.2 p.p. ↑ (14.8%) 5.0 p.p. ↑ (9.8%) (14.8%) 5.0 p.p. ↑ Operating Cash Generation⁴ (54.3) 111.5 (148.7%) ↓ (12.5) (332.5%) ↓ 70.0 21.6 223.9% ↑ ROE⁵ (LTM) 14.0% 14.7% (0.7 p.p.) ↓ 20.7% (6.7 p.p.) ↓ 14.0% 20.7% (6.7 p.p.) ↓ ROIC⁶ (LTM) 19.6% 21.1% (1.5 p.p.) ↓ 28.3% (8.7 p.p.) ↓ 19.6% 28.3% (8.7 p.p.) ↓ Earnings per Share⁷ (LTM) (R$/share) (ex-Treasury) 2.04 2.09 (2.5%) ↓ 2.73 (25.1%) ↓ 2.04 2.73 (25.1%) ↓ 1. Adjusted by capitalized interests. 2. Adjusted by capitalized interests, expenses with stock option plans (non-cash) and minority shareholders. 3. Adjusted by minority shareholders. 4. Operating Cash Generation is the results of the company’s calculation that does not reflect or compare to the numbers in the financial statments 5. ROE is calculated by net income of the last 12 months adjusted by minority shareholders divided by the average shareholders’ equity. Average referring to the opening and closing position in the last 12 months. 6. ROIC is calculated by NOPAT of the last 12 months divided by average capital employed. Average referring to the opening and closing position in the last 12 months. 7. Earnings per share (ex-Treasury) considers the issued shares (adjusted for stock splits) and does not consider shares held in Treasury at the end of the period. Operational Highlights (R$ million, PSV) 4Q20 3Q20 QoQ (%) 4Q19 YoY (%) 2020 2019 YoY (%) On-site Launches 885.2 984.2 (10.1%) ↓ 835.8 5.9% ↑ 2,665.2 2,575.1 3.5% ↑ Net Sales 795.2 742.1 7.2% ↑ 615.9 29.1% ↑ 2,553.5 2,039.6 25.2% ↑ Net SoS (%) 32.5% 32.3% 0.2 p.p. ↑ 28.0% 4.5 p.p. ↑ 60.8% 56.3% 4.5 p.p. ↑ PSV Transferred 619.8 626.2 (1.0%) ↓ 553.1 12.1% ↑ 2,144.8 1,641.1 30.7% ↑ Delivered Units (#) 2,728.0 2,163.0 26.1% ↑ 1,752.0 55.7% ↑ 9,246.0 10,368.0 (10.8%) ↓ Land Bank 10,974.5 10,802.8 1.6% ↑ 10,619.4 3.3% ↑ 10,974.5 10,619.4 3.3% ↑
  • 36.
    11 OPERATIONAL RESULTS LAUNCHES In 4Q20,Tenda launched 20 projects, reaching R$ 885,2 million in PSV (+5.9% YoY and -10,1% QoQ). Record in 2020 launches reached PSV of R$2.67 billion, an increase of 3.5% in the annual comparison. This, the metropolitan area (“RM”) of São Paulo started to represent 37.1% of the PSV launched (versus 35.7% in 2019) with 5,898 units launched (+6.5% YoY). Salvador's RM accounted for 19.2% of the PSV launched (versus 15.7% in 2019) with 3,668 units launched (+22.8% YoY). The increase of 2.2% YoY in the average price per unit launched was driven by the increase in the representativeness of the regions of SP and BA in the total PSV launched, where we have already launched projects with elevators that are concentrated closer to the central areas. Off-site operation values are not provided yet. GROSS SALES Gross sales amounted to R$854.7 million in 4Q20, (+27.7% YoY and +2.2% QoQ). This is a record-high quarter in gross sales in Tenda's history. Compared to 2019, 2020 ended with a 30.4% increase in PSV of gross sales. This year we posted an increase in the number of units sold (+26.6% YoY) and in the average price per unit sold (+3.0% YoY) driven by the greater share of São Paulo in the gross sales mix (37.8% in 2020 versus 35.4% in 2019). Gross SoS reached 35.0% in 4Q20, a decrease of 1.3 p.p. compared to 3Q20. Gross sales 4Q20 3Q20 QoQ (%) 4Q19 YoY (%) 2020 2019 YoY (%) On-site PSV (R$ million) 854.7 836.1 2.2% ↑ 669.4 27.7% ↑ 2,921.0 2,239.4 30.4% ↑ Number of units 6,042 5,860 3.1% ↑ 4,831 25.1% ↑ 20,761 16,397 26.6% ↑ Average price per unit (R$ mil) 141.5 142.7 (0.9%) ↓ 138.6 2.1% ↑ 140.7 136.6 3.0% ↑ Gross SoS 35.0% 36.3% (1.3 p.p.) ↓ 30.5% 4.5 p.p. ↑ 69.5% 61.8% 7.7 p.p. ↑ Off-site operation values are not provided yet. Gross Sales (PSV, R$ million) and Gross SoS (%) On-site Launches 4Q20 3Q20 QoQ (%) 4Q19 YoY (%) 2020 2019 YoY (%) On-site Number of launches 20 17 17.6% ↑ 22 (9.1%) ↓ 55 63 (12.7%) ↓ PSV (R$ million) 885.2 984.2 (10.1%) ↓ 835.8 5.9% ↑ 2,665.2 2,575.1 3.5% ↑ Number of units 6,136 6,325 (3.0%) ↓ 5,972 2.7% ↑ 18,120 17,894 1.3% ↑ Average price per unit (R$ mil) 144.3 155.6 (7.3%) ↓ 140.0 3.1% ↑ 147.1 143.9 2.2% ↑ Average size of launches (in units) 306.8 372.1 (17.5%) ↓ 271.5 13.0% ↑ 329.5 284.0 16.0% ↑
  • 37.
    12 CANCELLATIONS AND NETPRE-SALES Net sales amounted to R$795.2 million in 4Q20, (+29.1% YoY and +7.2% QoQ). This is a record-high quarter in net sales in Tenda's history. We ended 2020 with R$2.55 billion, an increase of 25.2% in the annual comparison. Speed over Supply (“net SoS”) reached 32.5% this quarter (+4.5 p.p. YoY and +0.2 p.p. QoQ). The quarterly average of Net SoS this year accounted for 30.2%, an increase of 2.1 p.p. compared to 28.1% in 2019. The ratio of cancellations to gross sales of 7.0% in 4Q20 decreased 4.2 p.p. compared to 3Q20. We recorded a high level of cancellations in the first nine months of the year due to the pandemic, with a significant reduction this quarter. In 2020, it at 12.6% (+3.7 p.p. YoY) and the expectation is that in 2021 this indicator will continue to converge to the historic levels of 2019. (PSV, R$ million) 4Q20 3Q20 QoQ (%) 4Q19 YoY (%) 2020 2019 YoY (%) On-site Gross sales 854.7 836.1 2.2% ↑ 669.4 27.7% ↑ 2,921.0 2,239.4 30.4% ↑ Cancellations 59.5 94.0 (36.7%) ↓ 53.5 11.2% ↑ 367.5 199.8 83.9% ↑ Net Sales 795.2 742.1 7.2% ↑ 615.9 29.1% ↑ 2,553.5 2,039.6 25.2% ↑ % Launches¹ 79.6% 54.4% 25.2 p.p. ↑ 83.3% (3.7 p.p.) ↓ 48.0% 51.5% (3.5 p.p.) ↓ % Inventory 20.4% 45.6% (25.2 p.p.) ↓ 16.7% 3.7 p.p. ↑ 52.0% 48.5% 3.5 p.p. ↑ Cancellations / Gross Sales 7.0% 11.2% (4.2 p.p.) ↓ 8.0% (1.0 p.p.) ↓ 12.6% 8.9% 3.7 p.p. ↑ Net SoS 32.5% 32.3% 0.2 p.p. ↑ 28.0% 4.5 p.p. ↑ 60.8% 56.3% 4.5 p.p. ↑ (in units) 4Q20 3Q20 QoQ (%) 4Q19 YoY (%) 2020 2019 YoY (%) On-site Gross Units Sold 6,042 5,860 3.1% ↑ 4,831 25.1% ↑ 20,761 16,397 26.6% ↑ Canceled Units 431 681 (36.7%) ↓ 383 12.5% ↑ 2,671 1,490 79.3% ↑ Net Units Sold 5,611 5,179 8.3% ↑ 4,448 26.1% ↑ 18,090 14,907 21.4% ↑ Cancellations / Gross Sales 7.1% 11.6% (4.5 p.p.) ↓ 7.9% (0.8 p.p.) ↓ 12.9% 9.1% 3.8 p.p. ↑ 1. Current year launches. Off-site operation values are not provided yet. Net Sales (PSV, R$ million) and Net SoS (%) - On-site
  • 38.
    13 UNITS TRANSFERRED, DELIVEREDAND CONSTRUCTION SITES UNDERWAY The PSV transferred totaled R$619.8 million in 4Q20 (+12.1% YoY and -1.0% QoQ). The good performance was driven by the normalization of financing during the second semester, given that Caixa Econômica Federal (“CEF”) adapted its procedures to overcome the operational challenges identified at the beginning of the pandemic. In 2020, the PSV transferred accounted for R$2.1 billion, an annual growth of 30.7%. 2,728 units were delivered in 4Q20, totaling 9,246 units throughout 2020. We ended the year with 91 sites in progress, an increase of 33.8% compared to 2019. With the recovery of the real estate sector in 2020 and the associated increase in construction costs, Tenda brought forward the beginning of some of its constructions sites as a strategy to mitigate the impact of the readjustments that are likely to continue to be imposed throughout 2021. Transfers, Deliveries and Construction Sites 4Q20 3Q20 QoQ (%) 4Q19 YoY (%) 2020 2019 YoY (%) On-site PSV Transferred (R$ million) 619.8 626.2 (1.0%) ↓ 553.1 12.1% ↑ 2,144.8 1,641.1 30.7% ↑ Transferred Units 4,846 5,085 (4.7%) ↓ 4,771 1.6% ↑ 17,215 13,951 23.4% ↑ Delivered Units 2,728 2,163 26.1% ↑ 1,752 55.7% ↑ 9,246 10,368 (10.8%) ↓ Construction Sites 91 82 11.0% ↑ 68 33.8% ↑ 91 68 33.8% ↑ Off-site operation values are not provided yet. INVENTORY AT MARKET VALUE This quarter inventories at market value totaled R$1.65 billion in PSV (+4.3% YoY and + 5.8% QoQ). The finished inventory accounted for R$38.8 million, representing 2.4% of the total. The inventory turnover (inventory at market value divided by net sales in the last twelve months) in 2020 reached 7.8 months, showing an improvement in relation to the 8.2 months of the average level of the previous year. Inventory at Market Value 4Q20 3Q20 QoQ (%) 4Q19 YoY (%) 2020 2019 YoY (%) On-site PSV (R$ million) 1,649.2 1,558.8 5.8% ↑ 1,581.6 4.3% ↑ 1,649.2 1,581.6 4.3% ↑ Number of units 10,878 10,416 4.4% ↑ 10,963.0 (0.8%) ↓ 10,878 10,963.0 (0.8%) ↓ Average price per unit (R$ mil) 151.6 149.7 1.3% ↑ 144.3 5.1% ↑ 151.6 144.3 5.1% ↑ Status of Construction - PSV (R$ million) 4Q20 Not started Up to 30% Built 30% to 70% Built More than 70% Built Finished Units On-site 1,649.2 747.7 447.9 385.2 29.6 38.8 Off-site operation values are not provided yet. LANDBANK The company ended 2020 with a PSV of R$10.97 billion (+3.3% YoY and +1.6% QoQ) in its landbank, maintaining the same level as in 2019. Due to the pandemic, we spent a significant part of the year renegotiating land that we had already acquired. Our assessment is that the performance in the purchase of land was healthy in 2020 but below our expectations. The off-site project ended 2020 with two pilot projects in progress. Land Bank¹ 4Q20 3Q20 QoQ (%) 4Q19 YoY (%) 2020 2019 YoY (%) On-site Number of projects 291 291 0.0% ↑ 292 (0.3%) ↓ 291 292 (0.3%) ↓ PSV (R$ million) 10,974.5 10,802.8 1.6% ↑ 10,619.4 3.3% ↑ 10,974.5 10,619.4 3.3% ↑ Acquisitions/Adjustments (R$ million) 1,057.0 1,096.5 (3.6%) ↓ 1,585.5 (33.3%) ↓ 3,020.4 4,300.9 (29.8%) ↓ Number of units 73,339 73,266 0.1% ↑ 72,159 1.6% ↑ 73,339 72,159 1.6% ↑ Average price per unit (R$ thousand) 149.6 147.4 1.5% ↑ 147.2 1.7% ↑ 149.6 147.2 1.7% ↑ % Swap Total 38.5% 37.9% 0.6 p.p. ↑ 34.6% 3.9 p.p. ↑ 38.5% 34.6% 3.9 p.p. ↑ % Swap Units 8.6% 8.8% (0.2 p.p.) ↓ 8.4% 0.2 p.p. ↑ 8.6% 8.4% 0.2 p.p. ↑ % Swap Financial 30.0% 29.2% 0.8 p.p. ↑ 26.2% 3.8 p.p. ↑ 30.0% 26.2% 3.8 p.p. ↑ 1, Tenda holds 100% of equity interest of its Land Bank. Off-site operation values are not provided yet.
  • 39.
    14 FINANCIAL RESULTS NET OPERATIONALREVENUE Net operational revenue totaled R$685.9 million in 4Q20 (+26.3% YoY and 4.8% QoQ) ending the year at R$2.28 billion. In this year, we had a reclassification of R$ 46.8 million between the provisions for cancellation and provision for estimated losses on doubtful accounts, so discounting this effect, the provision for cancellation recorded a constitution of R$ 30.2 million (-1.3% YoY) and the PCLD recorded a constitution of R$ 9.3 million against a reversal of R$ 12 million last year. (R$ million) 4Q20 3Q20 QoQ (%) 4Q19 YoY (%) 2020 2019 YoY (%) On-site Gross Operating Revenue 706.8 651.7 8.4% ↑ 566.5 24.8% ↑ 2,358.9 2,005.3 17.6% ↑ Provision for estimated losses on doubtful accounts (13.0) (31.9) 59.3% ↑ 4.0 (423.4%) ↓ (56.2) 12.3 (558.0%) ↓ Provision for cancellations (0.7) 47.3 (101.4%) ↓ (18.5) 96.3% ↑ 16.5 (30.6) 154.0% ↑ Tax on sales of properties and services (7.2) (12.5) (42.7%) ↓ (8.9) (19.0%) ↓ (36.9) (36.9) 0.1% ↑ Net Operating Revenue 685.9 654.5 4.8% ↑ 543.1 26.3% ↑ 2,282.4 1,950.1 17.0% ↑ Off-site operation values are not provided yet. GROSS PROFIT This quarter adjusted gross profit reached R$216.4 million (+19.1% YoY and + 0.1% QoQ), adjusted gross margin reached 31.5% (-1.9 p.p. YoY and -1.5 p.p.) suffering a non-recurring impact of R$ 11 million, with emphasis on the foundation reinforcement construction site carried out in a project in São Paulo. The adjusted gross margin without this effect would have been 33.2% in 4Q20, remaining stable to the previous quarter. The adjusted gross margin for the year was also negatively impacted by the effects of the pandemic, reaching 32.2% (-2.8 p.p. YoY), with emphasis on the loss of productivity of some construction sites that were paralyzed in the first half and normalized in 3Q20. (R$ million) 4Q20 3Q20 QoQ (%) 4Q19 YoY (%) 2020 2019 YoY (%) On-site Net Revenue 685.9 654.5 4.8% ↑ 543.1 26.3% ↑ 2,282.4 1,950.1 17.0% ↑ Gross Profit 209.5 211.3 (0.8%) ↓ 173.1 21.0% ↑ 710.4 648.1 9.6% ↑ Gross Margin 30.5% 32.3% (1.7 p.p.) ↓ 31.9% (1.3 p.p.) ↓ 31.1% 33.2% (2.1 p.p.) ↓ (-) Financial Costs 6.9 5.0 38.6% ↑ 8.6 (19.6%) ↓ 24.2 33.6 (28.0%) ↓ Adjusted Gross Profit¹ 216.4 216.3 0.1% ↑ 181.7 19.1% ↑ 734.6 681.7 7.8% ↑ Adjusted Gross Margin 31.5% 33.0% (1.5 p.p.) ↓ 33.4% (1.9 p.p.) ↓ 32.2% 35.0% (2.8 p.p.) ↓ 1. Adjusted by capitalized interests. Off-site operation values are not provided yet.
  • 40.
    15 SALES, GENERAL ANDADMINISTRATIVE EXPENSES (SG&A) Selling Expenses In 4Q20, selling expenses totaled R$52.1 million (+14.7% YoY and -6.3% QoQ), representing 6.1% of gross sales. The indicator remained consistent with historical levels with record sales driven by the positive performance of online sales. In 2020, selling expenses were R$200.6 million, 6.9% of gross sales, down -0.4 p.p. compared to 7.3% in 2019. General and Administrative Expenses (G&A) This quarter general and administrative expenses (G&A) for the on-site model totaled R$36.1 million (+37.4% YoY and -10.1% QoQ) and for the off-site model, R$2.1 million. In consolidated terms, we closed 4Q20 at R$38.3 million, ending the year at R$154.4 million (+31.9% YoY), which represents 5.8% of the launches (+1.2 p.p. YoY). (R$ million) 4Q20 3Q20 QoQ (%) 4Q19 YoY (%) 2020 2019 YoY (%) On-site Selling Expenses (52.1) (55.6) (6.3%) ↓ (45.5) 14.7% ↑ (200.6) (162.5) 23.4% ↑ General and Administrative Expenses (G&A) (36.1) (40.2) (10.1%) ↓ (26.3) 37.4% ↑ (146.4) (117.1) 25.0% ↑ Total SG&A Expenses (88.3) (95.8) (7.9%) ↓ (71.7) 23.0% ↑ (347.0) (279.6) 24.1% ↑ Gross sales 854.7 836.1 2.2% ↑ 669.4 27.7% ↑ 2,921.0 2,239.4 30.4% ↑ Launches 885.2 984.2 (10.1%) ↓ 835.8 5.9% ↑ 2,665.2 2,575.1 3.5% ↑ Net Operating Revenue 685.9 654.5 4.8% ↑ 543.1 26.3% ↑ 2,282.4 1,950.1 17.0% ↑ Selling Expenses / Gross Sales 6.1% 6.7% (0.6 p.p.) ↓ 6.8% (0.7 p.p.) ↓ 6.9% 7.3% (0.4 p.p.) ↓ G&A / Launches 4.1% 4.1% (0.0 p.p.) ↓ 3.1% 0.9 p.p. ↑ 5.5% 4.5% 0.9 p.p. ↑ G&A / Net Operating Revenue 5.3% 6.1% (0.9 p.p.) ↓ 4.8% 0.4 p.p. ↑ 6.4% 6.0% 0.4 p.p. ↑ Off-site Selling Expenses (0.0) 0.0 0.0% ↑ 0.0 0.0% ↑ (0.0) 0.0 0.0% ↑ General and Administrative Expenses (G&A) (2.1) (5.7) (62.3%) ↓ (0.0) 0.0% ↑ (8.0) (0.0) 0.0% ↑ Total SG&A Expenses (2.1) (5.7) (62.2%) ↓ (0.0) 0.0% ↑ (8.0) (0.0) 0.0% ↑ Consolidated Selling Expenses (52.1) (55.6) (6.3%) ↓ (45.5) 14.7% ↑ (200.6) (162.5) 23.4% ↑ General and Administrative Expenses (G&A) (38.3) (45.8) (16.5%) ↓ (26.3) 45.6% ↑ (154.4) (117.1) 31.9% ↑ Total SG&A Expenses (90.4) (101.5) (10.9%) ↓ (71.8) 26.0% ↑ (355.0) (279.6) 27.0% ↑ Gross sales 854.7 836.1 2.2% ↑ 669.4 27.7% ↑ 2,921.0 2,239.4 30.4% ↑ Launches 885.2 984.2 (10.1%) ↓ 835.8 5.9% ↑ 2,665.2 2,575.1 3.5% ↑ Net Operating Revenue 685.9 654.5 4.8% ↑ 543.1 26.3% ↑ 2,282.4 1,950.1 17.0% ↑ Selling Expenses / Gross Sales 6.1% 6.7% (0.6 p.p.) ↓ 6.8% (0.7 p.p.) ↓ 6.9% 7.3% (0.4 p.p.) ↓ G&A / Launches 4.3% 4.7% (0.3 p.p.) ↓ 3.1% 1.2 p.p. ↑ 5.8% 4.5% 1.2 p.p. ↑ G&A / Net Operating Revenue 5.6% 7.0% (1.4 p.p.) ↓ 4.8% 0.7 p.p. ↑ 6.8% 6.0% 0.8 p.p. ↑
  • 41.
    16 OTHER OPERATING REVENUESAND EXPENSES This quarter this line stood at R$21.4 million (+19.2% YoY and +41.4% QoQ). We accelerated legal settlements for cases that had not received a decision, but with a high probability of loss, which reduced the Company's possible risk of loss by R$69 million (21% QoQ), as explained in note 17.3. In the year, other operating income and expenses totaled R$67.0 million (+12% YoY). (R$ million) 4Q20 3Q20 QoQ (%) 4Q19 YoY (%) 2020 2019 YoY (%) On-site Other operating revenues and expenses (21.0) (15.0) 39.5% ↑ (17.9) 16.8% ↑ (67.1) (60.5) 11.0% ↑ Litigation expenses (22.5) (12.2) 85.3% ↑ (16.4) 37.6% ↑ (54.9) (39.8) 38.1% ↑ Others 1.6 (2.9) (154.9%) ↓ (1.6) (200.5%) ↓ (12.2) (20.7) (41.1%) ↓ Equity Income (0.4) (0.1) 342.0% ↑ 5.0 107.7% ↑ (0.5) 3.2 114.8% ↑ Off-site Other operating revenues and expenses (0.4) (0.1) 289.8% ↑ (0.0) 1,654.2% ↑ (0.6) (0.0) 2,422.8% ↑ Litigation expenses 0.0 0.0 0.0% ↑ 0.0 0.0% ↑ 0.0 0.0 0.0% ↑ Others (0.4) (0.1) 289.8% ↑ (0.0) 1,654.2% ↑ (0.6) (0.0) 2,422.8% ↑ Equity Income 0.0 0.0 0.0% ↑ 0.0 0.0% ↑ 0.0 0.0 0.0% ↑ Consolidated Other operating revenues and expenses (21.4) (15.1) 41.4% ↑ (18.0) 19.2% ↑ (67.8) (60.5) 12.0% ↑ Litigation expenses (22.5) (12.2) 85.3% ↑ (16.4) 37.6% ↑ (54.9) (39.8) 38.1% ↑ Others 1.1 (3.0) (137.8%) ↓ (1.6) (170.9%) ↓ (12.8) (20.7) (38.1%) ↓ Equity Income (0.4) (0.1) 342.0% ↑ 5.0 107.7% ↑ (0.5) 3.2 114.8% ↑ ADJUSTED EBITDA In 4Q20, the adjusted EBITDA for the on-site model totaled R$112.8 million and ended 2021 at R$338.7 million, -4.2% YoY. In the consolidated result, Adjusted EBITDA reached R$110.2 million in the quarter and R$330.0 million in 2020, -6.6% YoY. (R$ million) 4Q20 3Q20 QoQ (%) 4Q19 YoY (%) 2020 2019 YoY (%) On-site Net Income 74.7 76.3 (2.1%) ↓ 76.2 (2.0%) ↓ 209.2 263.5 (20.6%) ↓ (+) Financial Results 7.1 6.7 5.1% ↑ (4.0) 279.2% ↑ 23.1 (8.7) 364.4% ↑ (+) Income taxes and social contribution 13.0 11.0 18.0% ↑ 10.4 24.6% ↑ 41.9 35.1 19.2% ↑ (+) Depreciation and Amortization 6.0 5.8 4.1% ↑ 5.7 5.0% ↑ 22.2 20.4 8.5% ↑ (+) Capitalized interests 6.9 5.0 38.6% ↑ 8.6 (19.6%) ↓ 24.2 33.6 (28.0%) ↓ (+) Expenses with Stock Option Plan 6.0 6.0 (0.3%) ↓ 2.9 106.4% ↑ 18.7 8.7 116.5% ↑ (+) Minority Shareholders (0.9) 0.5 (285.0%) ↓ 0.1 (1.804%) ↓ (0.6) 0.9 (168.7%) ↓ Adjusted EBITDA¹ 112.8 111.4 1.3% ↑ 99.9 12.9% ↑ 338.7 353.5 (4.2%) ↓ Net Revenue 685.9 654.5 4.8% ↑ 543.1 26.3% ↑ 2.282.4 1.950.1 17.0% ↑ Adjusted EBITDA Margin¹ 16.4% 17.0% (0.6 p.p.) ↓ 18.4% (2.0 p.p.) ↓ 14.8% 18.1% (3.3 p.p.) ↓ Off-site Net Income (2.7) (5.8) 53.1% ↑ 0.0 0.0% ↑ (8.9) 0.0 (0.0% ↑ (+) Financial Results (0.0) (0.0) (120.1%) ↓ (0.1) 88.6% ↑ (0.0) (0.1) 37.0% ↑ (+) Depreciation and Amortization 0.2 0.0 236.1% ↑ 0.0 0.0% ↑ 0.3 0.0 0.0% ↑↑ Adjusted EBITDA¹ (2.6) (5.8) 55.3% ↑ (0.0) (0.0%) ↓ (8.6) (0.0) (0.0%) ↓ Net Revenue 0.0 0.0 0.0% ↑ 0.0 0.0% ↑ 0.0 0.0 0.0% ↑ Adjusted EBITDA Margin¹ 0.0% 0.0% 0.0 p.p. 0.0% 0.0 p.p. 0.0% 0.0% 0.0 p.p. Consolidated Net Income 72.0 70.5 2.1% ↑ 76.2 (5.6%) ↓ 200.3 263.5 (24.0%) ↓ (+) Financial Results 7.1 6.7 5.0% ↑ (4.0) 276.2% ↑ 23.1 (8.8) 362.1% ↑ (+) Income taxes and social contribution 13.0 11.0 18.0% ↑ 10.4 24.6% ↑ 41.9 35.1 19.2% ↑ (+) Depreciation and Amortization 6.2 5.8 5.9% ↑ 5.8 7.2% ↑ 22.5 20.5 9.7% ↑ (+) Capitalized interests 6.9 5.0 38.6% ↑ 8.6 (19.6%) ↓ 24.2 33.6 (28.0%) ↓ (+) Expenses with Stock Option Plan 6.0 6.0 (0.3%) ↓ 2.9 106.4% ↑ 18.7 8.7 116.5% ↑ (+) Minority Shareholders (0.9) 0.5 (285.0%) ↓ 0.1 (1.804%) ↓ (0.6) 0.9 (168.7%) ↓ Adjusted EBITDA¹ 110.2 105.6 4.4% ↑ 99.9 10.3% ↑ 330.0 353.5 (6.6%) ↓ Net Revenue 685.9 654.5 4.8% ↑ 543.1 26.3% ↑ 2.282.4 1.950.1 17.0% ↑ Adjusted EBITDA Margin¹ 16.1% 16.1% (0.1 p.p.) ↓ 18.4% (2.3 p.p.) ↓ 14.5% 18.1% (3.7 p.p.) ↓ 1. Adjusted by capitalized interests, expenses with action plans (non-cash) and Minority Shareholders.
  • 42.
    17 FINANCIAL RESULTS The companyended this quarter with a negative financial result of R$7.1 million, in which R$23.1 million is negative year to date. Lower net cash position and drop in Selic rate reduced the profitability of investments (benchmark 100% CDI) that failed to match the cost of debt, which increased with the additional debt incurred as a consequence of the pandemic. (R$ million) 4Q20 3Q20 QoQ (%) 4Q19 YoY (%) 2020 2019 YoY (%) Consolidated Financial Revenues 7.0 6.1 15.6% ↑ 16.7 (58.2%) ↓ 32.6 61.2 (46.8%) ↓ Financial Expenses (14.1) (12.8) 10.0% ↑ (12.7) 10.6% ↑ (55.6) (52.4) 6.1% ↑ Financial Results (7.1) (6.7) (5.0%) ↓ 4.0 (276.2%) ↓ (23.1) 8.8 (362.1%) ↓ NET INCOME In 4Q20, the on-site model recorded net income of R$74.7 million (-2.0% YoY and -2.1% QoQ) ending 2020 at R$209.2 million (-20.6 % YoY). In consolidated terms, net income for the quarter totaled R$72.0 million (-5.6% YoY and +2.1% QoQ), and R$200.3 million (-24.0 YoY) in 2020. Earnings per share (ex-treasury) totaled R$2.04 (-25.1% YoY) in 2020. (R$ million) 4Q20 3Q20 QoQ (%) 4Q19 YoY (%) 2020 2019 YoY (%) On-site Net Income after Income Tax and Social Contribution 73.8 76.8 (3.9%) ↓ 76.2 (3.2%) ↓ 208.6 264.4 (21.1%) ↓ (-) Minority Shareholders 0.9 (0.5) 285.0% ↑ (0.1) 1.803.8% ↑ 0.6 (0.9) 168.7% ↑ Net Income 74.7 76.3 (2.1%) ↓ 76.2 (2.0%) ↓ 209.2 263.5 (20.6%) ↓ Net Margin 10.9% 11.7% (0.8 p.p.) ↓ 14.0% (3.1 p.p.) ↓ 9.2% 13.5% (4.3 p.p.) ↓ Off-site Net income after Income Tax and Social Contribution (2.7) (5.8) 53.1% ↑ 0.0 (0.0%) ↓ (8.9) 0.0 (0.0%) ↓ (-)Minority Shareholders 0.0 0.0 0.0% ↑ 0.0 0.0% ↑ 0.0 0.0 0.0% ↑ Net Income (2.7) (5.8) 53.1% ↑ 0.0 (0.0%) ↓ (8.9) 0.0 (0.0%) ↓ Net Margin 0.0% 0.0% 0.0 p.p. 0.0% 0.0 p.p. 0.0% 0.0% 0.0 p.p. Consolidated Net income after Income Tax and Social Contribution 71.0 71.0 0.1% ↑ 76.2 (6.8%) ↓ 199.7 264.4 (24.5%) ↓ (-)Minority Shareholders 0.9 (0.5) 285.0% ↑ (0.1) 1.803.8% ↑ 0.6 (0.9) 168.7% ↑ Net Income 72.0 70.5 2.1% ↑ 76.2 (5.6%) ↓ 200.3 263.5 (24.0%) ↓ Net Margin 10.5% 10.8% (0.3 p.p.) ↓ 14.0% (3.5 p.p.) ↓ 8.8% 13.5% (4.7 p.p.) ↓ Earnings per Share¹ (LTM) (R$/share) 1.92 1.96 (2.1%) ↓ 2.53 (24.0%) ↓ 1.92 2.53 (24.0%) ↓ Earnings per Share² (LTM) (R$/share) (ex-Treasury) 2.04 2.09 (2.5%) ↓ 2.73 (25.1%) ↓ 2.04 2.73 (25.1%) ↓ 1. Earnings per share considers all issued shares (adjusted for stock splits). 2. Earnings per share (ex-Treasury) considers the issued shares (adjusted for stock splits) and does not consider shares held in Treasury at the end of the period. ROE (%, 12 months) and ROIC (%, 12 months) - Consolidated ROE (12 months) ROIC (12 months)
  • 43.
    18 BACKLOG RESULTS We ended2020 with a Backlog Margin of 35.2% (-4.0 p.p. YoY and -1.1 p.p. QoQ). In addition to the loss of productivity in the construction sites that were paralyzed in the first half due to the pandemic, the sector has also been under pressure with increased material costs reflected in the new harvests of construction sites. (R$ million) December 20 September 20 QoQ (%) December 19 YoY (%) On-site Backlog Revenues 949.5 745.3 27.4% ↑ 555.2 71.0% ↑ Backlog Costs (of Units Sold) (615.6) (474.9) 29.6% ↑ (337.6) 82.3% ↑ Backlog Results¹ 333.9 270.4 23.5% ↑ 217.7 53.4% ↑ Backlog Margin 35.2% 36.3% (1.1 p.p.) ↓ 39.2% (4.0 p.p.) ↓ 1. Includes the projects restricted under a supersedeas clause. Off-site operation values are not provided yet. CASH AND SHORT-TERM INVESTMENTS (R$ million) December 20 September 20 QoQ (%) December 19 YoY (%) Consolidated Cash and cash equivalents 69.7 25.1 177.5% ↑ 48.4 44.2% ↑ Short-term investments 1,235.7 1,377.7 (10.3%) ↓ 1,022.1 20.9% ↑ Total Cash Positions 1,305.5 1,402.8 (6.9%) ↓ 1,070.5 22.0% ↑ ACCOUNTS RECEIVABLE The Company totaled R$911.8 million in accounts receivable at the end of 2020, an increase of 45.9% YoY and 14.3% QoQ due to the record sales reported. (R$ million) December 20 September 20 QoQ (%) December 19 YoY (%) On-site Up to 2020¹ 84.8 748.3 (88.7%) ↓ 530.4 (84.0%) ↓ 2021 622.5 110.6 462.7% ↑ 155.6 300.0% ↑ 2022 300.5 55.4 442.3% ↑ 61.9 385.4% ↑ 2023 42.9 33.5 28.3% ↑ 22.5 90.9% ↑ 2024 32.4 44.4 (27.0%) ↓ 26.0 24.6% ↑ 2025 onwards 37.3 0.0 0.0% ↑ 0.0 0.0% ↑ Total Accounts Receivable 1,120.6 992.3 12.9% ↑ 796.5 40.7% ↑ (-) Present value adjustment (5.2) (4.5) (15.5%) ↓ (7.4) 29.9% ↑ (-) Provision for doubtful accounts (174.4) (161.4) (8.1%) ↓ (118.2) (47.5%) ↓ (-) Provision for cancellations (29.2) (28.5) (2.4%) ↓ (45.7) 36.2% ↑ Accounts Receivable 911.8 797.9 14.3% ↑ 625.1 45.9% ↑ Days of Accounts Receivable 146 136 7.1% ↑ 117 24.6% ↑ 1. Overdue and falling due. Off-site operation values are not provided yet.
  • 44.
    19 TENDA'S RECEIVABLES Tenda's receivablesportfolio (on and off balance, Tenda's risk) net of provision, increased by 17.1% QoQ and 54.3% YoY, reflecting its good performance in sales. Several initiatives related to collection activities led to an improvement in the default indicators, which allowed for a reduction in the coverage ratio of of provision for the after-delivery portfolio, which changed from 24.7% in 3Q20 to 22.9% in 4Q20. Receivables Tenda¹ (R$ million) 4Q20 3Q20 QoQ (%) 4Q19 YoY (%) Gross Receivables 560.2 489.3 14.5% ↑ 389.3 43.9% ↑ Installments Before Delivery 86.2 70.8 21.7% ↑ 62.7 37.4% ↑ Installments After Delivery 474.0 418.5 13.3% ↑ 326.6 45.1% ↑ Net Receivables 451.0 385.1 17.1% ↑ 292.3 54.3% ↑ Installments Before Delivery 85.4 70.2 21.7% ↑ 62.2 37.2% ↑ Installments After Delivery 365.6 314.9 16.1% ↑ 230.0 59.0% ↑ Receivables Tenda¹ (por aging. after delivery) 4Q20 3Q20 QoQ (%) 4Q19 YoY (%) Net Receivables Tenda (R$ million) 365.6 314.9 16.1% ↑ 230.0 59.0% ↑ Not Delivered² 175.6 133.6 31.4% ↑ 65.2 169.3% ↑ Delivered. current 133.9 133.5 0.3% ↑ 123.5 8.4% ↑ Delivered. <90d Overdue 40.6 34.0 19.3% ↑ 30.6 32.6% ↑ Delivered. >90d Overdue 15.6 13.9 12.3% ↑ 10.7 45.3% ↑ % of Allowances over Total Receivables Tenda 22.9% 24.7% (1.9 p.p.) ↓ 29.6% (6.7 p.p.) ↓ Not Delivered² 11.7% 13.4% (1.7 p.p.) ↓ 17.8% (6.1 p.p.) ↓ Delivered. current 0.9% 1.0% (0.1 p.p.) ↓ 1.6% (0.7 p.p.) ↓ Delivered. <90d Overdue 9.6% 10.1% (0.5 p.p.) ↓ 16.8% (7.2 p.p.) ↓ Delivered. >90d Overdue 83.6% 84.9% (1.2 p.p.) ↓ 87.4% (3.8 p.p.) ↓ 1. On and off-balance receivables with installment payments directly to the Company since the bank loan does not absorb 100% of the property value. 2. Projects not delivered have installments payment before and after delivery. The allowances over total receivable Tenda are just installments payment after delivery.
  • 45.
    20 INDEBTEDNESS We ended theyear with a total debt of R$1.157 billion, in line with the previous quarter. It has been 16.5 months with nominal average cost of 4.0% annual percentage yield. Debt Maturity Schedule (R$ million) 4Q20 Bank Debt Corporate Debt Project Finance (SFH) Consolidated 2021 599.7 175.6 424.1 0.0 2022 218.4 118.9 99.5 0.0 2023 210.3 35.8 174.5 0.0 2024 128.7 4.2 124.6 0.0 2025 onwards 0.0 0.0 0.0 0.0 Total Debt 1,157.1 334.5 822.6 0.0 Duration (in months) 16.5 Debt Breakdown (R$ million) Maturity Charges (APY) Balance Due December 20 Balance Due September 20 Consolidated Total Debt 1,157.1 1,152.9 Bank Debt up to 03/2024 CDI + 3.15% 334.5 334.3 Corporate Debt 822.6 818.5 CRI Tenda up to 01/2021 CDI + 0.90% 321.2 318.1 DEB TEND14 up to 09/2023 CDI + 1.75% 151.7 150.3 DEB TEND15 up to 03/2024 CDI + 1.40% 150.9 149.7 DEB TEND16 up to 12/2024 CDI + 1.30% 198.8 200.5 Weighted Average Cost of Debt (R$ million) Balance Due December 20 Balance Due / Total Debt Average Cost (APY) Consolidated CDI 1,157.1 100.0% CDI + 1.8% TR 0.0 0.0% TR + 8.3% Total 1,157.1 100% 4.0% RATING Standard & Poor’s (“S&P”) maintains Tenda's corporate credit rating at brAA+ with a positive outlook.
  • 46.
    21 NET DEBT The netdebt to equity ratio ended the year at 9.8% negative, within the limit of -10% to + 10% as established by the company. (R$ million) December 20 September 20 QoQ (%) December 19 YoY (%) Consolidated Gross Debt 1,157.1 1,152.1 0.4% ↑ 870.4 32.9% ↑ (-) Cash and cash equivalents / financial investments (1,305.5) (1,402.8) (6.9%) ↓ (1,070.5) 22.0% ↑ Net Debt (148.3) (250.7) 40.8% ↑ (200.0) 25.8% ↑ Shareholders’ Equity + Minority Shareholders (SE+MS) 1,518.1 1,480.5 2.5% ↑ 1,351.7 12.3% ↑ Net Debt / Equity (SE+MS) (9.8%) (16.9%) 7.2 p.p. ↑ (14.8%) 5.0 p.p. ↑ Adjusted EBITDA (LTM) 330.0 319.8 3.2% ↑ 353.5 (6.6%) ↓ CASH GENERATION AND CAPITAL DISTRIBUTION In 2020, Tenda's operating cash generation totaled R$70 million. In 4Q20, the Company accelerated some construction sites to off-set the readjustments in material costs, thus consuming R$54.3 million this quarter. In 4Q20, we opened a new stock buyback plan that amounted to R$5.3 million. Throughout 2020, Tenda distributed R$53.9 million to its shareholders that included dividends paid and stock buyback, equivalent to a payout of 26.9%. (R$ million) 4Q20 3Q20 QoQ (%) 4Q19 YoY (%) Consolidated Stock buyback 5.3 0.0 0.0% ↑ (0.3) 2.065.4% ↑ Dividends paid 30.5 18.1 68.5% ↑ 15.4 98.4% ↑ Capital Distribution 35.8 18.1 97.7% ↑ 15.1 137.0% ↑ (R$ million. last 12 months) 4Q20 3Q20 QoQ (%) 4Q19 YoY (%) Consolidated Stock buyback 5.3 (0.3) 2.065.4% ↑ 62.2 (91.5%) ↓ Dividends paid 48.6 33.5 45.2% ↑ 57.8 (15.9%) ↓ Capital Distribution 53.9 33.2 62.3% ↑ 120.0 (55.1%) ↓ (R$ million) December 20 September 20 QoQ (%) December 19 YoY (%) Consolidated Change in Available Cash (97.4) (132.1) 26.3% ↑ 94.1 (203.4%) ↓ (-) Change in Gross Debt 5.0 (195.1) 102.5% ↑ 125.6 (96.0%) ↓ (+) Capital Distribution 35.8 18.1 97.7% ↑ 15.1 137.0% ↑ Cash Generation¹ (66.6) 81.1 (182.1%) ↓ (16.4) (305.9%) ↓ Operating Cash Generation² (54.3) 111.5 (148.7%) ↓ (12.5) (332.5%) ↓ On-site (44.7) 119.3 (137.4%) ↓ (11.3) (296.8%) ↓ Off-site (9.6) (7.8) (23.3%) ↓ (1.3) (645.5%) ↓ (R$ million) 2020 2019 QoQ (%) Consolidated Change in Available Cash 235.0 214.9 9.4% ↑ (-) Change in Gross Debt 286.7 327.9 (12.6%) ↓ (+) Capital Distribution 53.9 120.0 (55.1%) ↓ Cash Generation¹ 2.2 6.9 (68.4%) ↓ Operating Cash Generation² 70.0 21.6 223.9% ↑ On-site 97.7 24.5 286.1% ↑ Off-site (27.7) (2.8) 0.0% ↑ 1. Cash Generation is obtained through the difference between the change in Available Cash and the change in Gross Debt, adjusted to the amounts of Stock Buyback, Dividends paid, Capital Reduction and non-operating effects. 2. Operating Cash Generation is a result of the company’s managerial calculation which neither reflects nor is compared with the figures reported in the financial statements.
  • 47.
    22 INCOME STATEMENT (R$ million)4Q20 3Q20 QoQ (%) 4Q19 YoY (%) 2020 2019 YoY (%) On-site Net Revenue 685.9 654.5 4.8% ↑ 543.1 26.3% ↑ 2,282.4 1,950.1 17.0% ↑ Operating Costs (476.4) (443.2) 7.5% ↑ (370.1) 28.7% ↑ (1,572.0) (1,302.0) 20.7% ↑ Gross Profit 209.5 211.3 (0.8%) ↓ 173.1 21.0% ↑ 710.4 648.1 9.6% ↑ Gross Margin 30.5% 32.3% (1.7 p.p.) ↓ 31.9% (1.3 p.p.) ↓ 31.1% 33.2% (2.1 p.p.) ↓ Operating Expenses (115.6) (116.7) (0.9%) ↓ (90.4) 27.9% ↑ (436.8) (357.3) 22.3% ↑ Selling Expenses (52.1) (55.6) (6.3%) ↓ (45.5) 14.7% ↑ (200.6) (162.5) 23.4% ↑ G&A Expenses (36.1) (40.2) (10.1%) ↓ (26.3) 37.4% ↑ (146.4) (117.1) 25.0% ↑ Other Operating Expenses/Revenue (21.0) (15.0) 39.5% ↑ (17.9) 16.8% ↑ (67.1) (60.5) 11.0% ↑ Depreciation and Amortization (6.0) (5.8) 4.1% ↑ (5.7) 5.0% ↑ (22.2) (20.4) 8.5% ↑ Equity Income (0.4) (0.1) (342.0%) ↓ 5.0 (107.7%) ↓ (0.5) 3.2 (114.8%) ↓ Operational Result 93.8 94.6 (0.7%) ↓ 82.7 13.5% ↑ 273.6 290.8 (5.9%) ↓ Financial Revenue 7.0 6.0 15.5% ↑ 16.7 (58.3%) ↓ 32.5 61.2 (46.9%) ↓ Financial Expenses (14.1) (12.8) 10.0% ↑ (12.8) 10.1% ↑ (55.6) (52.5) 6.0% ↑ Net Income before taxes on income tax and social contribution 86.8 87.8 (1.2%) ↓ 86.6 0.1% ↑ 250.4 299.5 (16.4%) ↓ Deferred taxes (2.4) 0.6 (496.9%) ↓ (0.6) (308.2%) ↓ (4.6) (3.9) (19.7%) ↓ Income Taxes and Social Contribution (10.5) (11.6) (9.2%) ↓ (9.8) 7.4% ↑ (37.2) (31.3) 19.1% ↑ Net Income after taxes on income tax and social contribution 73.8 76.8 (3.9%) ↓ 76.2 (3.2%) ↓ 208.6 264.4 (21.1%) ↓ (-) Minority Shareholders 0.9 (0.5) 285.0% ↑ (0.1) 1,803.8% ↑ 0.6 (0.9) 168.7% ↑ Net Income 74.7 76.3 (2.1%) ↓ 76.2 (2.0%) ↓ 209.2 263.5 (20.6%) ↓ Off-site Net Revenue 0.0 0.0 0.0% ↑ 0.0 0.0% ↑ 0.0 0.0 0.0% ↑ Operating Costs 0.0 0.0 0.0% ↑ 0.0 0.0% ↑ 0.0 0.0 0.0% ↑ Gross Profit 0.0 0.0 0.0% ↑ 0.0 0.0% ↑ 0.0 0.0 0.0% ↑ Gross Margin 0.0% 0.0% 0.0 p.p. 0.0% 0.0 p.p. 0.0% 0.0% 0.0 p.p. Operating Expenses (2.7) (5.8) (53.0%) ↓ (0.1) 0.0% ↑ (8.9) (0.1) 0.0% ↑ Selling Expenses (0.0) 0.0 0.0% ↑ 0.0 0.0% ↑ (0.0) 0.0 0.0% ↑ G&A Expenses (2.1) (5.7) (62.3%) ↓ (0.0) 0.0% ↑ (8.0) (0.0) 0.0% ↑ Other Operating Expenses/Revenue (0.4) (0.1) 289.8% ↑ (0.0) 0.0% ↑ (0.6) (0.0) 0.0% ↑ Depreciation and Amortization (0.2) (0.0) 236.1% ↑ (0.0) 0.0% ↑ (0.3) (0.0) 0.0% ↑ Equity Income 0.0 0.0 0.0% ↑ 0.0 0.0% ↑ 0.0 0.0 0.0% ↑ Operational Income/Result (2.7) (5.8) 53.0% ↑ (0.1) 0.0% ↑ (8.9) (0.1) 0.0% ↑ Financial Revenue 0.0 0.0 63.6% ↑ 0.0 0.0% ↑ 0.0 0.0 0.0% ↑ Financial Expenses (0.0) (0.0) 6.7% ↑ 0.1 105.7% ↑ (0.0) 0.1 0.0% ↑ Net Income before taxes on income tax and social contribution (2.7) (5.8) 53.1% ↑ 0.0 0.0% ↑ (8.9) 0.0 0.0% ↑ Deferred taxes 0.0 0.0 0.0% ↑ 0.0 0.0% ↑ 0.0 0.0 0.0% ↑ Income Taxes and Social Contribution 0.0 0.0 0.0% ↑ 0.0 0.0% ↑ 0.0 0.0 0.0% ↑ Net Income after taxes on income tax and social contribution (2.7) (5.8) 53.1% ↑ 0.0 0.0% ↑ (8.9) 0.0 0.0% ↑ (-) Minority Shareholders 0.0 0.0 0.0% ↑ 0.0 0.0% ↑ 0.0 0.0 0.0% ↑ Net Income (2.7) (5.8) 53.1% ↑ 0.0 0.0% ↑ (8.9) 0.0 0.0% ↑ Consolidated Net Revenue 685.9 654.5 4.8% ↑ 543.1 26.3% ↑ 2,282.4 1,950.1 17.0% ↑ Operating Costs (476.4) (443.2) 7.5% ↑ (370.1) 28.7% ↑ (1,572.0) (1,302.0) 20.7% ↑ Gross Profit 209.5 211.3 (0.8%) ↓ 173.1 21.0% ↑ 710.4 648.1 9.6% ↑ Gross Margin 30.5% 32.3% (1.7 p.p.) ↓ 31.9% (1.3 p.p.) ↓ 31.1% 33.2% (2.1 p.p.) ↓ Operating Expenses (118.4) (122.6) (3.4%) ↓ (90.4) 30.9% ↑ (445.7) (357.3) 24.7% ↑ Selling Expenses (52.1) (55.6) (6.3%) ↓ (45.5) 14.7% ↑ (200.6) (162.5) 23.4% ↑ G&A Expenses (38.3) (45.8) (16.5%) ↓ (26.3) 45.6% ↑ (154.4) (117.1) 31.9% ↑ Other Operating Expenses/Revenue (21.4) (15.1) 41.4% ↑ (18.0) 19.2% ↑ (67.8) (60.5) 12.0% ↑ Depreciation and Amortization (6.2) (5.8) 5.9% ↑ (5.8) 7.2% ↑ (22.5) (20.5) 9.7% ↑ Equity Income (0.4) (0.1) (342.0%) ↓ 5.0 (107.7%) ↓ (0.5) 3.2 (114.8%) ↓ Operational Income/Result 91.1 88.7 2.7% ↑ 82.6 10.2% ↑ 264.6 290.7 (9.0%) ↓ Financial Revenue 7.0 6.1 15.6% ↑ 16.7 (58.2%) ↓ 32.6 61.2 (46.8%) ↓ Financial Expenses (14.1) (12.8) 10.0% ↑ (12.7) 10.6% ↑ (55.6) (52.4) 6.1% ↑ Net Income before taxes on income tax and social contribution 84.0 82.0 2.5% ↑ 86.7 (3.0%) ↓ 241.6 299.5 (19.3%) ↓ Deferred taxes (2.4) 0.6 (496.9%) ↓ (0.6) (308.2%) ↓ (4.6) (3.9) (19.7%) ↓ Income Taxes and Social Contribution (10.5) (11.6) (9.2%) ↓ (9.8) 7.4% ↑ (37.2) (31.3) 19.1% ↑ Net Income after taxes on income tax and social contribution 71.0 71.0 0.1% ↑ 76.2 (6.8%) ↓ 199.7 264.4 (24.5%) ↓ (-) Minority Shareholders 0.9 (0.5) 285.0% ↑ (0.1) 1,803.8% ↑ 0.6 (0.9) 168.7% ↑ Net Income 72.0 70.5 2.1% ↑ 76.2 (5.6%) ↓ 200.3 263.5 (24.0%) ↓
  • 48.
    23 BALANCE SHEET (R$ million)December 20 September 20 QoQ (%) December 19 YoY (%) Consolidated Current Assets 2, 758.9 3,053.2 (9.6%) ↓ 2,506.4 10.1% ↑ Cash and cash equivalents 69.7 25.1 177.5% ↑ 48.4 44.2% ↑ Securities 1,235.7 1,377.7 (10.3%) ↓ 1,022.1 20.9% ↑ Receivables from clients 563.0 539.9 4.3%) ↓ 406.6 38.5% ↑ Properties for sale 777.7 1,015.5 (23.4%) ↓ 955.6 (18.6%) ↓ Other accounts receivables 112.8 95.0 18.6% ↑ 73.7 52.9% ↑ Non-Current Assets 1,292.6 906.6 42.6% ↑ 827.6 56.2% ↑ Receivables from Clients 348.8 258.0 35.2% ↑ 218.5 59.6% ↑ Properties for Sale 875.2 580.9 50.7% ↑ 537.0 63.0% ↑ Others 68.6 67.7 1.2% ↑ 72.1 (4.9%) ↓ Intangibles and Property and Equipment 143.2 107.1 33.8% ↑ 101.9 40.6% ↑ Investments 42.0 42.5 (1.2%) ↓ 42.6 (1.4%) ↓ Total Assets 4,236.7 4,109.4 3.1% ↑ 3,478.5 21.8% ↑ Current Liabilities 1,216.4 1,043.5 16.6% ↑ 579.0 110.1% ↑ Loans and financing 175.6 108.4 62.0% ↑ 8.5 1,961.9% ↑ Debentures 424.1 370.1 14.6% ↑ 5.6 7,475.0% ↑ Land obligations and customers’ advances 370.8 267.9 38.4% ↑ 340.9 8.8% ↑ Material and Service Suppliers 38.2 84.9 (55.1%) ↓ 38.9 (2.0%) ↓ Taxes and Contributions 23.6 29.3 (19.6%) ↓ 30.0 (21.6%) ↓ Others 184.2 182.8 0.7% ↑ 155.0 18.8% ↑ Non-current liabilities 1,502.2 1,585.4 (5.2%) ↓ 1,547.8 (2.9%) ↓ Loans and financing 158.9 225.2 (29.4%) ↓ 51.5 208.6% ↑ Debentures 398.5 448.4 (11.1%) ↓ 804.8 (50.5%) ↓ Land obligations and customers’ advances 806.6 824.8 (2.2%) ↓ 602.4 33.9% ↑ Deferred taxes 15.7 14.0 12.0% ↑ 11.8 32.7% ↑ Provision for Contingencies 32.3 27.6 17.0% ↑ 28.7 12.7% ↑ Other creditors 0.0 0.0 0.0% ↑ 0.0 0.0% ↑ Others 90.2 45.4 98.7% ↑ 48.6 85.5% ↑ Total Shareholders’ Equity 1,518.1 1,480.5 2.5% ↑ 1,351.7 12.3% ↑ Shareholders’ equity 1,517.6 1,479.1 2.6% ↑ 1,350.6 12.4% ↑ Minority shareholders 0.5 1.4 (64.8%) ↓ 1.1 (54.9%) ↓ Total Liabilities and Shareholders’ Equity 4,236.7 4,109.4 3.1% ↑ 3,478.5 21.8% ↑
  • 49.
    24 CASH FLOW STATEMENT (R$million) 4Q20 3Q20 QoQ (%) 4Q19 YoY (%) 2020 2019 YoY (%) Consolidated Cash from (used in) operating activities (48.6) 94.2 (151.6%) ↓ (0.1) (78,325.8%) ↓ 94.4 68.8 36.6% ↑ Net Income (Loss) before taxes 84.0 82.0 2.5% ↑ 86.7 (3.0%) ↓ 241.6 299.5 (19.3%) ↓ Expenses/revenues causing no impact on working capital 0.0 0.0 0.0% ↑ 0.0 0.0% ↑ 0.0 0.0 0.0% ↑ Depreciation and amortization 3.2 9.6 (66.5%) ↓ 9.0 (64.1%) ↓ 30.1 31.7 (5.0%) ↓ Provision (reversal) for doubtful accounts and cancellations 15.0 (6.3) 337.8% ↑ 8.7 71.5% ↑ 41.5 11.3 265.7% ↑ Present value adjustment 0.7 (1.6) 143.6% ↑ 0.9 (22.4%) ↓ (2.2) (2.6) 14.7% ↑ Impairment 2.0 (2.6) 180.2% ↑ (3.1) 166.8% ↑ (1.0) (6.0) 82.6% ↑ Equity Income 0.4 0.1 342.0% ↑ (5.0) 107.7% ↑ 0.5 (3.2) 114.8% ↑ Provision for contingencies 10.2 (3.7) 375.2% ↑ 3.5 191.4% ↑ 9.5 (4.9) 294.4% ↑ Unrealized interests and charges, net (1.2) 9.5 (112.7%) ↓ 4.6 (126.5%) ↓ 32.9 16.8 96.0% ↑ Warranty provision 18.7 1.6 1,077.5% ↑ 4.4 326.6% ↑ 21.4 6.5 232.1% ↑ Profit sharing provision (1.0) 1.9 (153.3%) ↓ 1.8 (154.6%) ↓ 12.3 15.0 (17.7%) ↓ Stock option plan expenses 6.0 6.0 (0.3%) ↓ 2.9 106.4% ↑ 18.7 8.7 116.5% ↑ Write-off of property and equipment and intangible 8.7 (3.2) 370.9% ↑ 0.0 0.0% ↑ 5.5 0.0 0.0% ↑ Other provisions (2.5) (0.7) (255.7%) ↓ (0.5) (356.9%) ↓ (3.4) (1.6) (105.4%) ↓ Leasing 0.0 (4.5) 100.0% ↑ 0.0 0.0% ↑ 0.0 0.0 0.0% ↑ Deferred taxes (11.6) (1.3) (760.2%) ↓ (0.3) (4,227.0%) ↓ (9.7) 0.8 (1.394.0%) ↓ Clients (128.3) (39.8) (222.1%) ↓ (15.7) (717.4%) ↓ (324.1) (165.2) (96.2%) ↓ Properties for sale (66.5) (31.5) (111.1%) ↓ (179.5) 63.0% ↑ (139.0) (422.4) 67.1% ↑ Other accounts receivable (13.0) (4.6) (183.1%) ↓ (27.6) 52.8% ↑ (29.2) (49.1) 40.6% ↑ Suppliers (46.8) 31.1 (250.4%) ↓ (21.0) (122.7%) ↓ (0.8) 17.5 (104.4%) ↓ Taxes and contributions 0.2 (10.3) 102.3% ↑ 1.4 (83.4%) ↓ (2.4) 2.2 (208.6%) ↓ Salaries, payroll charges and bonus provision (16.9) 9.8 (272.9%) ↓ (7.1) (136.4%) ↓ (5.7) (10.8) 47.2% ↑ Obligations for purchase of real estate properties 86.1 65.5 31.5% ↑ 140.7 (38.8%) ↓ 212.6 353.3 (39.8%) ↓ Other accounts payable 14.8 5.9 151.6% ↑ 4.0 267.6% ↑ 21.9 1.0 2.054.3% ↑ Current account operations (0.0) 0.4 (112.8%) ↓ (0.2) 76.2% ↑ 0.6 0.7 (25.1%) ↓ Taxes paid (11.0) (18.9) 41.8% ↑ (8.6) (27.6%) ↓ (37.7) (30.3) (24.5%) ↓ Cash from (used in) investment activities, net 138.6 121.0 14.6% ↑ (110.9) 225.0% ↑ (249.8) (209.2) (19.4%) ↓ Investment activities 0.0 0.0 0.0% ↑ 0.0 0.0% ↑ 0.0 0.0 0.0% ↑ Purchase of property and equipment (8.4) (12.7) 34.1% ↑ (12.0) 29.8% ↑ (46.6) (44.8) (3.9%) ↓ Investments/redemption of securities 155.8 133.7 16.5% ↑ (98.9) 257.4% ↑ (194.4) (164.3) (18.3%) ↓ Increase in investments (0.1) 0.0 0.0% ↑ 0.0 0.0% ↑ (0.1) 0.0 0.0% ↑ Dividends received 0.0 0.0 0.0% ↑ 0.0 0.0% ↑ 0.0 0.0 0.0% ↑ Cash from (used in) financing activities, net (45.4) (216.2) 79.0% ↑ 100.4 (145.2%) ↓ 177.2 154.4 14.8% ↑ Stock Buyback (5.3) 0.0 0.0% ↑ 0.3 (2,065.4%) ↓ (5.3) (62.2) 91.5% ↑ Capital Increase 0.0 0.0 0.0% ↑ 0.0 0.0% ↑ 0.0 0.0 0.0% ↑ Capital Reserve Increase (0.3) 9.1 (103.0%) ↓ 1.4 (119.9%) ↓ 0.8 5.5 (85.3%) ↓ Dividends Paid (30.5) (18.1) (68.5%) ↓ (15.4) (98.4%) ↓ (48.6) (57.8) 15.9% ↑ Loans and financing increase 0.8 57.8 (98.7%) ↓ 202.1 (99.6%) ↓ 648.7 693.5 (6.5%) ↓ Amortization of loans and financing (7.8) (263.9) 97.0% ↑ (86.6) 91.0% ↑ (413.0) (418.0) 1.2% ↑ Lease payments (2.1) (0.9) (125.7%) ↓ (0.9) (127.7%) ↓ (4.8) (3.8) (28.1%) ↓ Loan operations (0.2) (0.2) 3.3% ↑ (0.5) 56.8% ↑ (0.6) (2.9) 78.6% ↑ Net increase (decrease) in cash and cash equivalents 44.6 (0.9) 4,800.5% ↑ (10.6) 522.8% ↑ 21.4 14.1 52.0% ↑ At the beginning of the period 25.1 26.1 (3.6%) ↓ 58.9 (57.3%) ↓ 48.4 34.3 41.0% ↑ At the end of the period 69.7 25.1 177.5% ↑ 48.4 44.2% ↑ 69.7 48.4 44.2% ↑
  • 50.
    25 INVESTOR RELATIONS Renan BarbosaSanches CFO and Investor Relations Officer Alvaro Kaue Investor Relations Manager Bruno Souza Investor Relations Specialist Investor Relations Tel.: +55 (11) 3111-9909 E-mail: ri@tenda.com Website: ri.tenda.com MEDIA RELATIONS NOVAPR Marilia Paiotti Tel.: +55 (11) 5180-9079 E-mail: marilia.paiotti@novapr.com.br ABOUT TENDA Tenda (B3: TEND3), one of the main homebuilders in Brazil, is listed under Novo Mercado, B3’s highest corporate governance level. With a focus on affordable housing, it concentrates its activities in nine metropolitan areas of Brazil, with projects aimed within the bracket 2 of “Programa Casa Verde e Amarela” (PCVA) federal government housing program.