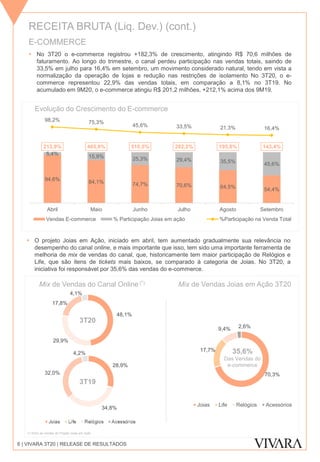
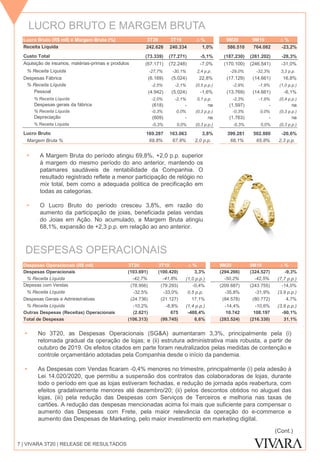
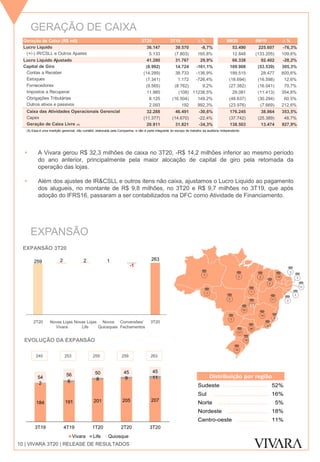
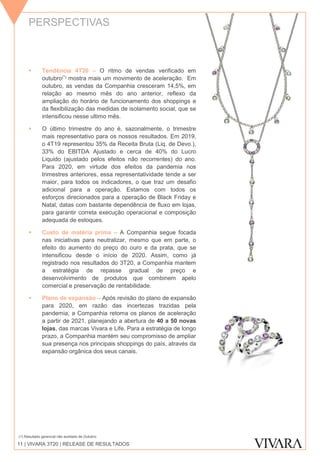
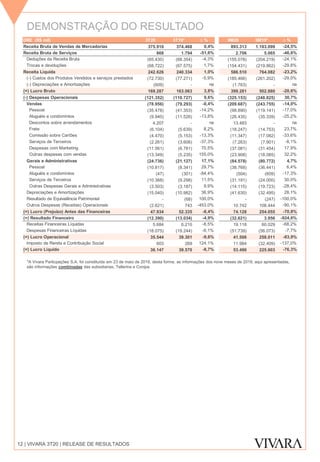
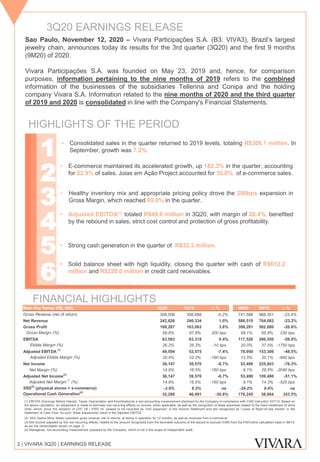
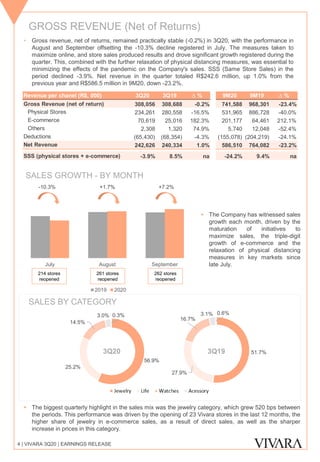
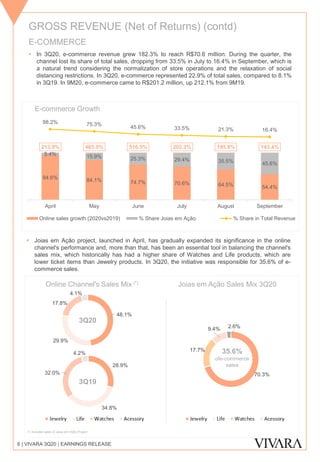
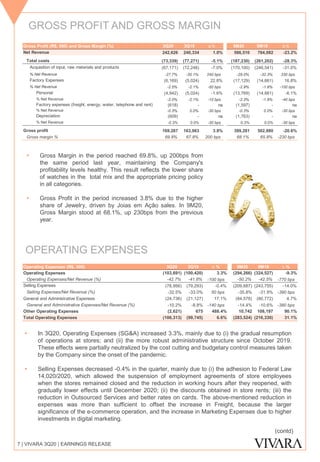
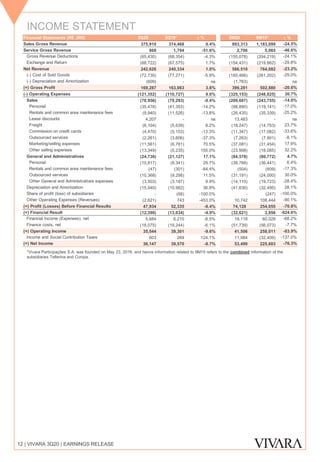
SlideShare uma empresa Scribd logo
1 de 32
Baixar para ler offline
Release de Resultados
Terceiro Trimestre de 2020
VIDEOCONFERÊNCIA DE RESULTADOS
Sexta-feira, 13 de novembro de 2020
Português
Horário: 10h00 (Horário de Brasília)
Dados de Conexão
https://choruscall.com.br/vivara/3t20.htm
Inglês
Horário: 8h00 (Horário de Nova York)
Dados para conexão
https://choruscall.com.br/vivara/3q20.htm
DIVULGAÇÃO DE RESULTADOS DO 3T20
São Paulo, 12 de novembro de 2020 - A Vivara Participações S.A. (B3: VIVA3), a maior
rede de joalherias do Brasil, divulga os resultados do 3º trimestre de 2020 e o acumulado
nos nove meses de 2020.
A Vivara Participações S.A. foi constituída no dia 23 de maio de 2019 e, por esta razão, para
permitir a comparabilidade, as informações dos nove meses de 2019, aqui apresentadas,
referem-se à informação combinada dos negócios das subsidiarias Tellerina e Conipa e da
holding, Vivara S.A.. Já as informações referentes aos nove meses de 2020, bem como as
do terceiro trimestre de 2019 e 2020 são consolidadas em linha com as Demonstrações
Financeiras da Companhia.
DESTAQUES DO PERÍODO
3
4
5
1
2
• O e-commerce manteve o ritmo acelerado, com crescimento de 182,3% no trimestre,
representando 22,9% do faturamento. Projeto Joias em Ação registrou 35,6% de
participação nas vendas do e-commerce.
• O EBITDA Ajustado(1) totalizou R$ 49,6 milhões, no 3T20, com margem de 20,4%,
beneficiado pela retomada dos níveis de vendas, rígido controle de despesas e
proteção de rentabilidade bruta.
DESTAQUES FINANCEIROS
(1) EBITDA (Earnings before Interest, Taxes and Depreciation and Amortization) é uma medição não contábil divulgada pela Companhia em consonância com a Instrução CVM nº 527/12. A
partir do cálculo acima, é realizado o ajuste para eliminação de efeitos não recorrentes no resultado, quando aplicável, bem como o reconhecimento das despesas de arrendamento, referente
à parcela fixa do aluguel das lojas, que a partir da adoção do CPC06/IFRS16, deixaram de ser registradas como “despesas de aluguel” na Demonstração de Resultados e passaram a ser
reconhecidas como “Arrendamento do Direito de Uso, na Demonstração de Fluxo de Caixa. Assim, os ajustes geram o EBITDA Ajustado.
(2) SSS - vendas em mesmas lojas (Same Store Sales), considera a receita bruta líquida de devoluções, de lojas com 12 meses de operação, além de incluir as receitas de e-commerce.
(3) Lucro Líquido Ajustado pelo efeito não recorrentes, referente ao reconhecido do ganho da ação de exclusão do ICMS da base de PIS/Confins no período acumulado em 9M19, conforme
conciliação apresentada na página 8.
(4) Medição gerencial, não contábil, elaborada pela Companhia, e não é parte integrante do escopo de trabalho da auditoria independente.
2 | VIVARA 3T20 | RELEASE DE RESULTADOS
• Boa composição de estoques e adequada política de precificação garantiu expansão
de +2,0 p.p de Margem Bruta, que atingiu 69,8%, no trimestre.
• Balanço sólido, com ampla liquidez, encerrando o trimestre com caixa de R$ 612,2
milhões e R$ 220,0 milhões de recebíveis de cartão de crédito.
6
• Forte geração de caixa no trimestre, com adição de R$ 32,3 milhões.
• As vendas consolidadas do trimestre retomaram ao mesmo patamar de 2019,
registrando R$ 308,1 milhões. Em setembro, o crescimento foi de +7,2%.
Principais Indicadores Financeiros (R$ mil) 3T20 3T19 ∆ % 9M20 9M19 ∆ %
Receita Bruta (liq. de devoluções) 308.056 308.688 -0,2% 741.588 968.301 -23,4%
Receita Líquida 242.626 240.334 1,0% 586.510 764.082 -23,2%
Lucro bruto 169.287 163.063 3,8% 399.281 502.880 -20,6%
Margem Bruta (%) 69,8% 67,8% 2,0 p.p. 68,1% 65,8% 2,3 p.p.
EBITDA 63.583 63.318 0,4% 117.520 286.550 -59,0%
Margem Ebitda (%) 26,2% 26,3% (0,1 p.p.) 20,0% 37,5% (17,5 p.p.)
EBITDA Ajustado
(1)
49.594 53.575 -7,4% 78.950 153.306 -48,5%
Margem Ebitda Ajustada (%) 20,4% 22,3% (1,9 p.p.) 13,5% 20,1% (6,6 p.p.)
Lucro Líquido 36.147 39.570 -8,7% 53.490 225.603 -76,3%
Margem Liquida (%) 14,9% 16,5% (1,6 p.p.) 9,1% 29,5% (20,4 p.p.)
Lucro Líquido Ajustado(3)
36.147 39.570 -8,7% 53.490 109.480 -51,1%
Margem Liquida Ajustada (%) 14,9% 16,5% (1,6 p.p.) 9,1% 14,3% (5,2 p.p.)
SSS
(2)
(lojas físicas + e-commerce) -3,9% 8,5% na -24,2% 9,4% na
Geração de Caixa Operacional(4)
32.288 46.491 -30,6% 176.245 38.864 353,5%
MENSAGEM DA ADMINISTRAÇÃO
 Os resultados do terceiro trimestre de 2020 trazem um significado especial para nós da
Vivara: primeiro, porque fecha o primeiro ciclo de divulgações da Vivara como empresa
listada e, depois, porque, foi a partir desse trimestre que começamos a identificar sinais
mais claros da retomada da operação, após o momento mais desafiador que já
enfrentamos.
 Os últimos 12 meses foram muito intensos para nós, saímos de um ambiente de
Companhia fechada para almejar sonhos mais arrojados, buscar mais profissionalização,
avanços em governança e novos caminhos de crescimento. Em poucos meses após
iniciarmos a estruturação do IPO, começamos a transitar em um ambiente tão novo, de
muita visibilidade, que até então não estávamos acostumados. Temos muito para agradecer
aos nossos acionistas que acreditaram no projeto da Vivara e tem nos ajudado a construir
esse novo ciclo da nossa história.
 No meio de tudo isso, uma pandemia se instaurou e nos vimos diante de um cenário nunca
vivido: mais um desafio novo a ser enfrentado. Diante deste cenário vimos as bases do
negócio fazer toda a diferença e, em agosto, após cinco meses desde o fechamento das
lojas, começamos a ver sinais mais claros de retomada, com as vendas voltando aos
patamares pré-pandemia. Mês após mês temos visto o time engajado para superar os
obstáculos, entregando mais que o esperado.
 No terceiro trimestre, nossa receita voltou ao mesmo nível do mesmo período de 2019, com
setembro já aprontando para um crescimento de 7,2%, com SSS positivo. O e-commerce
segue crescendo de forma consistente, absorvendo, em parte, o fluxo ainda comprometido
nas lojas físicas. A expansão da Margem Bruta é outro ponto de destaque do trimestre,
foram 2.0 p.p. de expansão, em um cenário de aumento significativo de custo de matéria-
prima, com a categoria de joias figurando como grande destaque do período. Crescemos
Margem Bruta em todas as categorias e canais, o que mostra a resiliência dos nossos
produtos e a força do nosso modelo de negócio verticalizado, que nos permite gerir os
custos de forma mais assertiva. Entregar Margem EBITDA Ajustada de 20,4% e Margem
Líquida de 14,9%, em um trimestre ainda afetado pelas medidas de isolamento, realmente é
um resultado a ser comemorado. Agora, estamos prestes a entrar na principal sazonalidade
de vendas da Companhia e estamos bem posicionados para os desafios: nossa plataforma
de e-commerce foi aprimorada; o app Vivara também recebeu melhorias; temos produtos
muito competitivos em todas as categorias e uma estratégia bem estruturada para passar
por mais esse período, ganhando market share e com a marca ainda mais fortalecida.
 Seguimos focados nos projetos de longo prazo: em 2021, retomaremos para a expansão
orgânica mais acelerada, com a perspectiva de adicionar entre 40 a 50 novas lojas, de
Vivara e Life; o projeto de estruturação da marca Life, também voltou para o seu curso, com
novas inciativas para aprimorar operação, treinamentos mais direcionados, estratégia
renovada para produto e marketing, tudo está se desenvolvendo para alavancarmos a Life
de forma estruturada. A estratégia omni também se torna foco estratégico para nós,
investimos fortemente em projetos de renovação tecnológica que serão importantes para
nos garantir bases sólidas para uma transformação digital.
 Estamos felizes com o trabalho feito até aqui, mas sabemos que temos um longo caminho
pela frente. A retomada definitiva virá e estamos bem posicionados para as oportunidades
de consolidação e preparados para voltar ainda mais fortalecidos para reforçar nossa
posição de liderança de mercado.
3 | VIVARA 2T20 | RELEASE DE RESULTADOS
Marcio Kaufman
CEO
56,9%
25,2%
14,5%
3,0% 0,3%
Joias Life Relógios Acessórios Serviços
Julho Agosto Setembro
2019 2020
RECEITA BRUTA (Liq. Dev.)
+7,2%
4 | VIVARA 3T20 | RELEASE DE RESULTADOS
+1,7%
• A receita bruta, líquida de devoluções, ficou praticamente estável (-0,2%), no 3T20, com a
performance de agosto e setembro compensando a queda de -10,3% ainda registrada em julho. As
medidas adotadas para maximizar as vendas tanto do canal online, quanto das lojas físicas
surtiram efeito e garantiram essa importante evolução ao longo do trimestre. Isso, combinado ao
aumento da flexibilização das medidas de isolamento, foi fundamental para minimizar os efeitos da
pandemia nas vendas da Companhia. O SSS (Same Store Sales) do período foi de -3,9%. A receita
líquida do período atingiu R$ 242,6 milhões, +1,0% maior que o ano anterior e R$ 586,5 milhões,
no acumulado, com retração de -23,2%.
EVOLUÇÃO DAS VENDAS - MÊS A MÊS
 A Companhia tem registrado
importante evolução mês a mês,
como resultado da maturação das
iniciativas de maximização de
vendas, e-commerce com
crescimento acelerado de três
dígitos e ampliação da
flexibilização das medidas de
isolamento nas principais praças,
a partir do final de julho.
3T20 3T19
VENDA POR CATEGORIA
 Quanto ao mix de vendas, o grande destaque do trimestre foi a categoria de joias, que ganhou 5,2 p.p.
na comparação dos períodos. Esse desempenho da categoria é explicado pela adição de 23 novas
lojas Vivara nos últimos 12 meses, pela maior participação de joias nas vendas do e-commerce, em
razão das vendas diretas, bem como pelo aumento de preços mais relevante nessa categoria.
-10,3%
214 Lojas
Reabertas
261 Lojas
Reabertas
262 Lojas
Reabertas
Receita por canal (R$ mil) 3T20 3T19 ∆ % 9M20 9M19 ∆ %
Receita Bruta (Liq. de devoluções) 308.056 308.688 -0,2% 741.588 968.301 -23,4%
Lojas Físicas 234.261 280.558 -16,5% 531.965 886.728 -40,0%
E-commerce 70.619 25.016 182,3% 201.177 64.461 212,1%
Outros 2.308 1.320 74,9% 5.740 12.048 -52,4%
Deduções (65.430) (68.354) -4,3% (155.078) (204.219) -24,1%
Receita Líquida 242.626 240.334 1,0% 586.510 764.082 -23,2%
SSS (lojas físicas + e-commerce) -3,9% 8,5% na -24,2% 9,4% na
51,7%
27,9%
16,7%
3,1% 0,6%
RECEITA BRUTA (Liq. Dev.) (cont.)
5 | VIVARA 3T20 | RELEASE DE RESULTADOS
LOJAS FÍSICAS
 Iniciamos o processo de reabertura gradual das lojas no final do mês de abril e encerramos o
3T20 com praticamente 100% do parque reaberto, com exceção da Loja no Terminal 3 do
Aeroporto de Guarulhos que continua fechada. Ao final de julho, eram 214 lojas reabertas em
agosto eram 261 e 262 ao final de setembro. No mês de Setembro, tivemos alguns recuos
pontuais na dinâmica de flexibilização em praças do Paraná e interior de São Paulo. Ainda
assim, registramos crescimento de 7,2% nas vendas consolidadas e decréscimo de -3,2% nas
vendas de lojas físicas.
 O SSS, considerando apenas lojas físicas, evoluiu de -100,0% em abril para -11,0%, em
setembro, mesmo com restrição de operação e redução do horário de funcionamento em todas
as praças. No 3T20, a receita das lojas físicas, recuou -16,5%, representando 76,0% das
receitas totais. No 3T19, as lojas foram responsáveis por 90,9% da receita total.
 É importante ainda ressaltar que essa evolução se dá mesmo em uma cenário de redução
significativa no horário de funcionamento dos shoppings e ampla restrição no fluxo de clientes nas
lojas. Além disso, as vendas do projeto Joias em Ação são registradas no faturamento do e-
commerce, e no 3T20 atingiram R$ 25,2 milhões. Apenas de forma ilustrativa, considerando esse
efeito, a vendas das lojas físicas já estariam com recuo de -7,5% em relação ao 3T19, sendo que
em setembro já estariam com crescimento de +3,9%.
Evolução mensal do desempenho das lojas
298
13.949
45.208
57.100
84.115
93.046
1,1%
23,9%
53,1%
65,7%
77,8%
82,3%
Abril Maio Junho Julho Agosto Setembro
Receita de lojas físicas %Lojas/Rec. Total
09 Lojas
Reabertas
26 Lojas
Reabertas
186 Lojas
Reabertas
214 Lojas
Abertas
261 Lojas
Abertas
262 Lojas
Abertas
Mix de Vendas de Lojas Físicas
60,3%
23,5%
13,5%
2,7%
54,7%
27,0%
15,3%
3,0%
Joias
Life
Relógios
Acessório
3T20 3T19
-3,2%
-12,5%
-32,9%
-63,7%
-89,7%
-99,7%
RECEITA BRUTA (Liq. Dev.) (cont.)
6 | VIVARA 3T20 | RELEASE DE RESULTADOS
E-COMMERCE
 No 3T20 o e-commerce registrou +182,3% de crescimento, atingindo R$ 70,6 milhões de
faturamento. Ao longo do trimestre, o canal perdeu participação nas vendas totais, saindo de
33,5% em julho para 16,4% em setembro, um movimento considerado natural, tendo em vista a
normalização da operação de lojas e redução nas restrições de isolamento No 3T20, o e-
commerce representou 22,9% das vendas totais, em comparação a 8,1% no 3T19. No
acumulado em 9M20, o e-commerce atingiu R$ 201,2 milhões, +212,1% acima dos 9M19.
 O projeto Joias em Ação, iniciado em abril, tem aumentado gradualmente sua relevância no
desempenho do canal online, e mais importante que isso, tem sido uma importante ferramenta de
melhoria de mix de vendas do canal, que, historicamente tem maior participação de Relógios e
Life, que são itens de tickets mais baixos, se comparado à categoria de Joias. No 3T20, a
iniciativa foi responsável por 35,6% das vendas do e-commerce.
Evolução do Crescimento do E-commerce
94,6%
84,1% 74,7% 70,6% 64,5% 54,4%
5,4% 15,9% 25,3% 29,4% 35,5% 45,6%
213,9% 465,9% 510,5% 202,2% 195,8% 143,4%
98,2% 75,3%
45,6% 33,5% 21,3% 16,4%
Abril Maio Junho Julho Agosto Setembro
Vendas E-commerce % Participação Joias em ação %Participação na Venda Total
Mix de Vendas do Canal Online (*)
48,1%
29,9%
17,8%
4,1%
28,9%
34,8%
32,0%
4,2%
3T20
3T19
(*) Inclui as vendas do Projeto Joias em Ação
Mix de Vendas Joias em Ação 3T20
35,6%
Das Vendas do
e-commerce
70,3%
17,7%
9,4% 2,6%
Joias Life Relógios Acessórios
LUCRO BRUTO E MARGEM BRUTA
 A Margem Bruta do período atingiu 69,8%, +2,0 p.p. superior
à margem do mesmo período do ano anterior, mantendo os
patamares saudáveis de rentabilidade da Companhia. O
resultado registrado reflete a menor participação de relógio no
mix total, bem como a adequada politica de precificação em
todas as categorias.
 O Lucro Bruto do período cresceu 3,8%, em razão do
aumento da participação de joias, beneficiada pelas vendas
do Joias em Ação. No acumulado, a Margem Bruta atingiu
68,1%, expansão de +2,3 p.p. em relação ao ano anterior.
DESPESAS OPERACIONAIS
 No 3T20, as Despesas Operacionais (SG&A) aumentaram 3,3%, principalmente pela (i)
retomada gradual da operação de lojas; e (ii) estrutura administrativa mais robusta, a partir de
outubro de 2019. Os efeitos citados em parte foram neutralizados pelas medidas de contenção e
controle orçamentário adotadas pela Companhia desde o início da pandemia.
 As Despesas com Vendas ficaram -0,4% menores no trimestre, principalmente (i) pela adesão à
Lei 14.020/2020, que permitiu a suspensão dos contratos das colaboradoras de lojas, durante
todo o período em que as lojas estiveram fechadas, e redução de jornada após reabertura, com
efeitos gradativamente menores até dezembro/20; (ii) pelos descontos obtidos no aluguel das
lojas, (iii) pela redução das Despesas com Serviços de Terceiros e melhoria nas taxas de
cartões. A redução das despesas mencionadas acima foi mais que suficiente para compensar o
aumento das Despesas com Frete, pela maior relevância da operação do e-commerce e
aumento das Despesas de Marketing, pelo maior investimento em marketing digital.
7 | VIVARA 3T20 | RELEASE DE RESULTADOS
(Cont.)
Lucro Bruto (R$ mil) e Margem Bruta (%) 3T20 3T19 ∆ % 9M20 9M19 ∆ %
Receita Líquida 242.626 240.334 1,0% 586.510 764.082 -23,2%
Custo Total (73.339) (77.271) -5,1% (187.230) (261.202) -28,3%
Aquisição de insumos, matérias-primas e produtos (67.171) (72.248) -7,0% (170.100) (246.541) -31,0%
% Receita Líquida -27,7% -30,1% 2,4 p.p. -29,0% -32,3% 3,3 p.p.
Despesas Fábrica (6.169) (5.024) 22,8% (17.129) (14.661) 16,8%
% Receita Líquida -2,5% -2,1% (0,5 p.p.) -2,9% -1,9% (1,0 p.p.)
Pessoal (4.942) (5.024) -1,6% (13.769) (14.661) -6,1%
% Receita Líquida -2,0% -2,1% 0,1 p.p. -2,3% -1,9% (0,4 p.p.)
Despesas gerais da fábrica (618) - na (1.597) - na
% Receita Líquida -0,3% 0,0% (0,3 p.p.) -0,3% 0,0% (0,3 p.p.)
Depreciação (609) - na (1.763) - na
% Receita Líquida -0,3% 0,0% (0,3 p.p.) -0,3% 0,0% (0,3 p.p.)
Lucro Bruto 169.287 163.063 3,8% 399.281 502.880 -20,6%
Margem Bruta % 69,8% 67,8% 2,0 p.p. 68,1% 65,8% 2,3 p.p.
Despesas Operacionais (R$ mil) 3T20 3T19 ∆ % 9M20 9M19 ∆ %
Despesas Operacionais (103.691) (100.420) 3,3% (294.266) (324.527) -9,3%
% Receita Líquida -42,7% -41,8% (1,0 p.p.) -50,2% -42,5% (7,7 p.p.)
Depesas com Vendas (78.956) (79.293) -0,4% (209.687) (243.755) -14,0%
% Receita Líquida -32,5% -33,0% 0,5 p.p. -35,8% -31,9% (3,9 p.p.)
Despesas Gerais e Administrativas (24.736) (21.127) 17,1% (84.578) (80.772) 4,7%
% Receita Líquida -10,2% -8,8% (1,4 p.p.) -14,4% -10,6% (3,8 p.p.)
Outras Despesas (Receitas) Operacionais (2.621) 675 -488,4% 10.742 108.197 -90,1%
Total de Despesas (106.313) (99.745) 6,6% (283.524) (216.330) 31,1%
DESPESAS OPERACIONAIS (Cont.)
 As Despesas Gerais e Administrativas apresentaram crescimento de 17,1%, principalmente, (i)
pela maior estrutura administrativa, reflexo do reforço de áreas estratégicas da Companhia e
beneficio gerado pela adesão à Lei 14.020/2020, efeito que deverá ser verificado até
dezembro/20; (ii) aumento das Despesas com Serviços de Terceiros, em função dos projetos de
aceleração digital, melhorias tecnológicas e consultorias diversas, necessárias para implantação
da estratégia de longo prazo.
 As despesas relacionadas, exclusivamente, ao enfrentamento da pandemia afetaram as
Despesas com Vendas, Gerais e Administrativas em -R$ 1,2 milhão no 3T20.
 As Outras Despesas (Receitas) Operacionais registraram -R$ 2,6 milhões no trimestre,
principalmente pela adequação das provisões.
8 | VIVARA 3T20 | RELEASE DE RESULTADOS
• Mesmo com a operação ainda impactada pelo fechamento das lojas, principalmente em julho,
quando as vendas ainda recuaram -10,3%, a Companhia encerrou o trimestre com o EBITDA
Ajustado de R$ 49,6 milhões, com Margem EBITDA Ajustada de 20,4%, como resultado da
efetividade das iniciativas de maximização das vendas, da expansão da Margem Bruta e do rígido
controle de gastos.
• No acumulado, o EBITDA Ajustado atingiu R$ 78,9 milhões, com margem de 13,5%.
EBITDA AJUSTADO E MARGEM EBITDA AJUSTADA
(4) A parcela fixa das despesas de aluguel, aqui apresentadas, estão contabilizadas na Demonstração de Fluxo de Caixa, como “Arrendamento do Direito de Uso”, como efeito da adoção
do IFRS16. Informações mais detalhadas a respeito da norma contábil podem ser encontradas na Nota Explicativa 24, das Demonstrações Contábeis da Companhia.
LUCRO LÍQUIDO E MARGEM LÍQUIDA
• A Companhia registrou Lucro Líquido de R$ 36,1 milhões no 3T20, em razão do desempenho
operacional do período, pelo menor volume de correção monetária sobre o saldo de impostos a
recuperar e imposto diferido.
• Apresentamos Lucro Líquido Ajustado, para o desempenho acumulado nos 9M19, excluindo o efeito
não recorrente, referente ao ganho total da ação de exclusão do ICMS da base de PIS/Cofins, no
montante de R$ 116,1 milhões, reconhecido no 2T19.
Reconciliação do EBITDA (R$ mil) 3T20 3T19 ∆ % 9M20 9M19 ∆ %
Lucro Liquido 36.147 39.570 -8,7% 53.490 225.603 -76,3%
(+) IR/CSLL (603) (269) 124,1% (11.984) 32.409 -137,0%
(+) Resultado financeiro 12.390 13.034 -4,9% 32.621 (3.956) 924,6%
(+) Depreciação e Amortização 15.649 10.982 42,5% 43.393 32.495 33,5%
EBITDA Total 63.583 63.318 0,4% 117.520 286.550 -59,0%
(-) Despesa de aluguel ( IFRS16)
(4)
(13.989) (9.743) 43,6% (38.570) (29.586) 30,4%
(+) Efeitos não recorrentes - - na - (103.658) na
EBITDA AJUSTADO 49.594 53.575 -7,4% 78.950 153.306 -48,5%
Margem Ebitda Ajustada (%) 20,4% 22,3% (1,9 p.p.) 13,5% 20,1% (6,6 p.p.)
Reconciliação do Lucro Líquido Ajustado (R$ mil) 3T20 3T19 ∆ % 9M20 9M19 ∆ %
Lucro Líquido 36.147 39.570 -8,7% 53.490 225.603 -76,3%
Margem Lìquida (%) 14,9% 16,5% (1,6 p.p.) 9,1% 29,5% (70,9 p.p.)
Efeito Não Recorrente - - na - (116.123) na
Lucro Líquido Ajustado 36.147 39.570 -8,7% 53.490 109.480 -51,1%
Margem Líquida Ajustada (%) 14,9% 16,5% (1,6 p.p.) 9,1% 14,3% (5,2 p.p.)
9 | VIVARA 3T20 | RELEASE DE RESULTADOS
ENDIVIDAMENTO
 No 3T20, o índice de endividamento total da Companhia foi de -1,4x, como reflexo da geração de
caixa operacional, bem como pelo alongamento da dívida e disciplina financeira que garantiu a
preservação dos recursos no período.
INVESTIMENTOS - CAPEX
 Os investimentos no trimestre totalizaram R$
11,4 milhões, -22,4% menor que os
investimentos do mesmo período do ano
anterior, principalmente, (i) pela revisão do
plano de expansão para 2020, reduzindo a
alocação de investimentos em novas lojas;
(ii) maior volume de investimentos em
sistemas e TI, principalmente, para projetos
de renovação tecnológica, importantes para
estruturar a estratégia de omnicanalidade.
 No 3T20, a Companhia inaugurou cinco (05)
novas operações, sendo 02 lojas Vivara, 02
loja Life e 01 quiosque e encerrou a atividade
de um (01) quiosque Life, que foi convertido
em loja, encerrando o período com 263
pontos de vendas, dos quais 207 são lojas
Vivara, 11 lojas Life e 45 são quiosques.
Investimentos (R$ mil) 3T20 3T19 ∆ % 9M20 9M19 ∆ %
Capex Total 11.378 14.670 -22,4% 37.742 25.389 48,7%
Novas lojas 2.314 6.451 -64,1% 21.182 9.545 121,9%
Reformas e Manutenção 2.436 910 167,8% 6.698 3.633 84,4%
Fábrica 966 3.053 -68,4% 2.219 4.346 -48,9%
Sistemas/TI 5.662 3.185 77,8% 7.626 4.762 60,2%
Outros 0 1.071 -100,0% 17 3.104 -99,4%
CAPEX/Receita Líquida (%) 4,7% 6,1% (1,4 p.p.) 6,4% 3,3% 3,1 p.p.
Dívida Líquida (R$ mil) 9M20 1S20 ∆ % 2019 ∆ %
Empréstimos e financiamentos 330.019 320.500 3,0% 270.354 22,1%
Caixa e Equivalentes de Caixa e Títulos e
Valores Mobiliários 612.245 584.679 4,7% 435.844 40,5%
Caixa Líquido (282.226) (264.179) -6,8% (165.490) -70,5%
EBITDA Ajustado LTM (últimos 12 meses) 197.779 211.030 -6,3% 272.134 -27,3%
Divida Líquida/Ebitda Ajustado 1,4x- 1,3x- na 0,6x- na
259 2632 2 1
-1
184 191 201 205 207
2 6 8 9 1154
56 50 45 45
3T19 4T19 1T20 2T20 3T20
Vivara Life Quiosque
10 | VIVARA 3T20 | RELEASE DE RESULTADOS
 A Vivara gerou R$ 32,3 milhões de caixa no 3T20, -R$ 14,2 milhões inferior ao mesmo período
do ano anterior, principalmente pela maior alocação de capital de giro pela retomada da
operação das lojas.
 Além dos ajustes de IR&CSLL e outros itens não caixa, ajustamos o Lucro Liquido ao pagamento
dos alugueis, no montante de R$ 9,8 milhões, no 3T20 e R$ 9,7 milhões no 3T19, que após
adoção do IFRS16, passaram a ser contabilizados na DFC como Atividade de Financiamento.
GERAÇÃO DE CAIXA
(5) Essa é uma medição gerencial, não contábil, elaborada pela Companhia, e não é parte integrante do escopo de trabalho da auditoria independente.
EXPANSÃO
2T20 Novas Lojas Novas Lojas Novos Conversões/ 3T20
Vivara Life Quiosques Fechamentos
EXPANSÃO 3T20
263259259253240
EVOLUÇÃO DA EXPANSÃO
Sudeste 52%
Sul 16%
Norte 5%
Nordeste 18%
Centro-oeste 11%
Distribuição por região
Geração de Caixa (R$ mil) 3T20 3T19 ∆ % 9M20 9M19 ∆ %
Lucro Liquido 36.147 39.570 -8,7% 53.490 225.607 -76,3%
(+/-) IR/CSLL e Outros Ajustes 5.133 (7.803) 165,8% 12.848 (133.205) 109,6%
Lucro Liquido Ajustado 41.280 31.767 29,9% 66.338 92.402 -28,2%
Capital de Giro (8.992) 14.724 -161,1% 109.908 (53.539) 305,3%
Contas a Receber (14.289) 38.733 -136,9% 199.515 28.477 600,6%
Estoques (7.341) 1.172 -726,4% (18.694) (16.598) 12,6%
Fornecedores (9.565) (8.762) 9,2% (27.382) (16.041) 70,7%
Impostos a Recuperar 11.985 (108) 11238,5% 29.081 (11.413) 354,8%
Obrigações Tributárias 8.125 (16.504) 149,2% (48.637) (30.294) 60,5%
Outros ativos e passivos 2.093 192 992,3% (23.976) (7.669) 212,6%
Caixa das Atividades Operacionais Gerencial 32.288 46.491 -30,6% 176.245 38.864 353,5%
Capex (11.377) (14.670) -22,4% (37.742) (25.389) 48,7%
Geração de Caixa Livre (5) 20.911 31.821 -34,3% 138.503 13.474 927,9%
PERSPECTIVAS
11 | VIVARA 3T20 | RELEASE DE RESULTADOS
 Tendência 4T20 – O ritmo de vendas verificado em
outubro(*) mostra mais um movimento de aceleração. Em
outubro, as vendas da Companhia cresceram 14,5%, em
relação ao mesmo mês do ano anterior, reflexo da
ampliação do horário de funcionamento dos shoppings e
da flexibilização das medidas de isolamento social, que se
intensificou nesse ultimo mês.
 O último trimestre do ano é, sazonalmente, o trimestre
mais representativo para os nossos resultados. Em 2019,
o 4T19 representou 35% da Receita Bruta (Liq. de Devo.),
33% do EBITDA Ajustado e cerca de 40% do Lucro
Liquido (ajustado pelos efeitos não recorrentes) do ano.
Para 2020, em virtude dos efeitos da pandemia nos
trimestres anteriores, essa representatividade tende a ser
maior, para todos os indicadores, o que traz um desafio
adicional para a operação. Estamos com todos os
esforços direcionados para a operação de Black Friday e
Natal, datas com bastante dependência de fluxo em lojas,
para garantir correta execução operacional e composição
adequada de estoques.
 Custo de matéria prima – A Companhia segue focada
nas iniciativas para neutralizar, mesmo que em parte, o
efeito do aumento do preço do ouro e da prata, que se
intensificou desde o início de 2020. Assim, como já
registrado nos resultados do 3T20, a Companhia mantem
a estratégia de repasse gradual de preço e
desenvolvimento de produtos que combinem apelo
comercial e preservação de rentabilidade.
 Plano de expansão – Após revisão do plano de expansão
para 2020, em razão das incertezas trazidas pela
pandemia, a Companhia retoma os planos de aceleração
a partir de 2021, planejando a abertura de 40 a 50 novas
lojas, das marcas Vivara e Life. Para a estratégia de longo
prazo, a Companhia mantém seu compromisso de ampliar
sua presença nos principais shoppings do país, através da
expansão orgânica dos seus canais.
(1) Resultado gerencial não auditado de Outubro.
DEMONSTRAÇÃO DO RESULTADO
12 | VIVARA 3T20 | RELEASE DE RESULTADOS
*
DRE (R$ mil) 3T20 3T19* ∆ % 9M20 9M19* ∆ %
Receita Bruta de Vendas de Mercadorias 375.910 374.468 0,4% 893.313 1.183.099 -24,5%
Receita Bruta de Serviços 868 1.794 -51,6% 2.706 5.065 -46,6%
Deduções da Receita Bruta (65.430) (68.354) -4,3% (155.078) (204.219) -24,1%
Trocas e devoluções (68.722) (67.575) 1,7% (154.431) (219.862) -29,8%
Receita Líquida 242.626 240.334 1,0% 586.510 764.082 -23,2%
(-) Custos dos Produtos Vendidos e serviços prestados (72.730) (77.271) -5,9% (185.466) (261.202) -29,0%
(-) Depreciações e Amortizações (609) - na (1.763) - na
(=) Lucro Bruto 169.287 163.063 3,8% 399.281 502.880 -20,6%
(-) Despesas Operacionais (121.352) (110.727) 9,6% (325.153) (248.825) 30,7%
Vendas (78.956) (79.293) -0,4% (209.687) (243.755) -14,0%
Pessoal (35.478) (41.353) -14,2% (98.890) (119.141) -17,0%
Aluguéis e condomínios (9.940) (11.526) -13,8% (26.435) (35.339) -25,2%
Descontos sobre arrendamentos 4.207 - na 13.483 - na
Frete (6.104) (5.639) 8,2% (18.247) (14.753) 23,7%
Comissão sobre Cartões (4.470) (5.153) -13,3% (11.347) (17.082) -33,6%
Serviços de Terceiros (2.261) (3.606) -37,3% (7.263) (7.901) -8,1%
Despesas com Marketing (11.561) (6.781) 70,5% (37.081) (31.454) 17,9%
Outras despesas com vendas (13.349) (5.235) 155,0% (23.908) (18.085) 32,2%
Gerais e Administrativas (24.736) (21.127) 17,1% (84.578) (80.772) 4,7%
Pessoal (10.817) (8.341) 29,7% (38.768) (36.441) 6,4%
Aluguéis e condomínios (47) (301) -84,4% (504) (609) -17,3%
Serviços de Terceiros (10.368) (9.298) 11,5% (31.191) (24.000) 30,0%
Outras Despesas Gerais e Administrativas (3.503) (3.187) 9,9% (14.115) (19.723) -28,4%
Depreciações e Amortizações (15.040) (10.982) 36,9% (41.630) (32.495) 28,1%
Resultado de Equivalência Patrimonial - (68) 100,0% - (247) -100,0%
Outros Despesas (Receitas) Operacionais (2.621) 743 -453,0% 10.742 108.444 -90,1%
(=) Lucro (Prejuizo) Antes das Financeiras 47.934 52.335 -8,4% 74.128 254.055 -70,8%
(=) Resultado Financeiro (12.390) (13.034) -4,9% (32.621) 3.956 -924,6%
Receitas Financeiras Líquidas 5.684 6.210 -8,5% 19.118 60.029 -68,2%
Despesas Financeiras Líquidas (18.075) (19.244) -6,1% (51.739) (56.073) -7,7%
(=) Lucro Operacional 35.544 39.301 -9,6% 41.506 258.011 -83,9%
Imposto de Renda e Contribuição Social 603 269 124,1% 11.984 (32.409) -137,0%
(=) Lucro Líquido 36.147 39.570 -8,7% 53.490 225.603 -76,3%
*A Vivara Particpações S.A. foi constituída em 23 de maio de 2019, desta forma, as informações dos nove meses de 2019, aqui apresentadas,
são informações combinadas das subsidiarias, Tellerina e Conipa.
BALANÇO PATRIMONIAL
13 | VIVARA 3T20 | RELEASE DE RESULTADOS
Balanço Patrimonial (R$ mil) 9M20 2019
CIRCULANTE
Caixa e equivalentes de caixa 519.414 435.844
Títulos e valores mobiliários 65.815 -
Contas a receber 226.696 425.833
Contas a receber partes relacionadas - -
Estoques 367.381 348.034
Impostos a recuperar 93.961 95.247
Despesas pagas antecipadamente e outros créditos 3.106 7.669
Instrumentos derivativos ativo 21.412 6.796
Total do ativo circulante 1.297.785 1.319.425
NÃO CIRCULANTE
Títulos e valores mobiliários 27.016 -
Depósitos judiciais 13.542 13.680
Imposto de renda e contribuição social diferidos 92.139 54.200
Instrumentos derivativos ativo - 2.715
Impostos a recuperar 132.062 168.344
Investimentos - -
Imobilizado 334.211 311.620
Intangível 13.904 9.546
Total do ativo não circulante 612.873 560.104
ATIVO TOTAL 1.910.659 1.879.529
CIRCULANTE
Fornecedores 9.039 36.421
Empréstimos e financiamentos 275.019 190.934
Partes relacionadas 22 88
Obrigações trabalhistas e previdenciárias 42.977 65.175
Obrigações tributárias 42.099 86.778
Parcelamento de tributos 353 457
Arrendamentos a pagar 21.226 14.856
Arrendamentos direito de uso a pagar 28.806 24.119
Juros sobre capital próprio a pagar 35.563 8.124
Outras obrigações 22.338 31.862
Total do passivo circulante 477.442 458.813
NÃO CIRCULANTE
Obrigações trabalhistas e previdenciárias 6.954 9.193
Empréstimos e financiamentos 55.000 79.420
Parcelamento de tributos 1.622 1.865
Provisão para riscos cíveis, trabalhistas e tributários 17.195 15.234
Arrendamentos direito de uso a pagar 236.672 225.281
Total do passivo não circulante 317.442 330.992
PATRIMÔNIO LÍQUIDO
Capital social 1.052.340 1.052.340
Reservas de lucros 9.945 37.384
Lucros acumulados 53.490 -
Outras resultados abrangentes - -
Total do patrimônio líquido 1.115.775 1.089.724
TOTAL DO PASSIVO E PATRIMÔNIO LÍQUIDO 1.910.659 1.879.529
FLUXO DE CAIXA
14 | VIVARA 3T20 | RELEASE DE RESULTADOS
*A Vivara Particpações S.A. foi constituída em 23 de maio de 2019, desta forma, as informações dos nove meses de 2019, aqui apresentadas,
são informações combinadas das subsidiarias, Tellerina e Conipa.
*
Fluxo de Caixa (R$ mil) 3T20 3T19* ∆ % 9M20 9M19* ∆ %
Lucro Líquido 36.147 39.570 -8,7% 53.490 225.607 -76,3%
Ajustes do Lucro Líquido 22.698 20.607 10,1% 54.572 (62.998) 186,6%
Lucro Líquido Ajustado 58.844 60.177 -2,2% 108.062 162.609 -33,5%
Variação nos ativos e passivos operacionais:
Contas a receber (14.289) 38.733 -136,9% 199.515 28.477 600,6%
Estoques (7.341) 1.172 -726,4% (18.694) (16.598) -12,6%
Fornecedores (9.565) (8.762) -9,2% (27.382) (16.041) -70,7%
Impostos a Recuperar 11.985 (108) 11238,5% 29.081 (11.413) 354,8%
Obrigações Tributárias 8.125 (16.504) 149,2% (48.637) (30.294) -60,5%
Outros ativos e passivos 2.093 1.049 99,5% (23.976) (7.669) -212,6%- -
Caixa das atividades operacionais 49.852 75.759 -34,2% 217.970 109.070 99,8%
Imposto de Renda e Contribuição Social (5.636) (11.086) 49,2% (9.127) (26.195) 65,2%
Juros pagos de emprestimos e financiamentos (2.147) (7.581) 71,7% (7.510) (14.425) 47,9%
Juros pagos de arrendamentos de direito de uso (7.483) - na (16.548) - na- -
Caixa liquido das atividades operacionais 34.587 57.091 -39,4% 184.785 68.450 170,0%
Imobilizado (8.219) (11.933) 31,1% (33.716) (20.622) -63,5%
Intangivel (3.158) (2.737) -15,4% (4.027) (4.767) 15,5%
Outros (92.831) 2.430 -3919,5% (92.831) 1.645 na- -
Caixa das atividades de Investimentos (104.208) (12.239) -751,4% (130.573) (23.744) -449,9%
Dividendos e JCP - - - - (67.418) 100,0%
Empréstimos e financiamentos 6.656 (14.551) 145,7% 16.285 57.542 -71,7%
Arrendamento do Direito de Uso (2.299) (9.743) 76,4% (8.539) (29.586) 71,1%
Outros - 1.282 -100,0% 21.612 2.605 729,5%- -
Caixa das atividades de financiamento 4.356 (23.011) 118,9% 29.359 (36.857) 179,7%- -
AUMENTO (REDUÇÃO) DE CAIXA E EQUIVALENTE DE CAIXA (65.264) 21.841 -398,8% 83.570 7.848 964,8%- -
Saldo Inicial de caixa e equivalente de caixa 584.679 66.726 776,2% 435.844 84.781 414,1%
Saldo final de caixa e equivalente de caixa 519.414 87.704 492,2% 519.414 87.704 492,2%
 EBITDA Ajustado e Margem EBITDA Ajustada - O EBITDA (Earnings Before Interest, Taxes,
Depreciation and Amortization) ou LAJIDA (Lucros Antes de Juros, Impostos, Depreciações e
Amortizações) é uma medição não contábil divulgada pela Companhia em consonância com a
Instrução CVM nº 527/12. A partir do cálculo acima, é realizado o ajuste para eliminação de efeitos
não recorrentes no resultado e, para melhor comparabilidade, exclui-se também o efeito da
adoção do CPC06/IFRS16, que entrou em vigor em 1 de janeiro de 2019, os ajustes geram o
EBITDA Ajustado. Efeitos não recorrentes são caracterizados por efeitos pontuais que acontecem
no resultado da Companhia. Por estes montantes não fazerem parte recorrente do resultado, a
Companhia opta em realizar o ajuste para que no “EBITDA Ajustado” apareçam apenas números
recorrentes. A Companhia utiliza o EBITDA Ajustado como medida de performance para efeito
gerencial e para comparação com empresas similares.
 Dívida Líquida - A Dívida Líquida aqui apresentada é resultante do somatório dos empréstimos
de curto e longo prazos presentes no Passivo Circulante e no Passivo Não Circulante da
Companhia subtraídos da soma de Caixa e Equivalentes de Caixa com Títulos e Valores
Mobiliários presentes no Ativo Circulante e no Ativo Não Circulante da Companhia.
 A Companhia entende que o Índice de Dívida Líquida/EBITDA Ajustado auxilia na avaliação da
alavancagem e liquidez. O EBITDA Ajustado LTM é a somatória dos últimos 12 meses (Last
Twelve Months EBITDA) e também representa uma alternativa da geração operacional de caixa.
 O EBITDA Ajustado, a Dívida Líquida, o indicador Dívida Líquida/EBITDA Ajustado LTM e
Geração de Caixa Operacional apresentadas neste documento não são medidas de lucro em
conformidade com as práticas contábeis adotadas no Brasil e não representa os fluxos de caixa
dos períodos apresentados e, portanto, não é uma medida alternativa aos resultados ou fluxos de
caixa
 Geração de Caixa Operacional aqui apresentada é uma medição gerencial, resultante do fluxo
de caixa de atividades operacionais apresentados na Demonstração de Fluxo de Caixa (DFC),
ajustada pelo “Arrendamento do direito de uso”, que a partir de adoção do CPC06/IFRS16 passou
a ser contabilizado na DFC, como atividade de financiamento.
As afirmações contidas neste documento relacionadas a perspectivas sobre os negócios, projeções
sobre resultados operacionais e financeiros e aquelas relacionadas a perspectivas de crescimento da
Vivara S.A. são meramente projeções e, como tais, são baseadas exclusivamente nas expectativas
da Diretoria sobre o futuro dos negócios. Essas expectativas dependem, substancialmente, das
condições de mercado, do desempenho da economia brasileira, do setor e dos mercados
internacionais e, portanto, sujeitas à mudança sem aviso prévio.
Todas as variações aqui apresentadas são calculadas com base nos números em milhares de reais,
assim como os arredondamentos.
O presente relatório de desempenho inclui dados contábeis e não contábeis tais como, operacionais,
financeiros pro forma e projeções com base na expectativa da Administração da Companhia. Os
dados não contábeis não foram objeto de revisão por parte dos auditores independentes da
Companhia.
RELAÇÕES COM INVESTIDORES
Otavio Lyra – Diretor Financeiro e de Relações com Investidores
Melina Rodrigues – Gerente de RI
Andressa Nunes – Analista de RI
E-mail: ri@vivara.com.br
Tel.: 11 3896-2736 /11 3896-2721
MEDIÇÕES NÃO CONTÁBEIS
AVISO LEGAL
15 | VIVARA 3T20 | RELEASE DE RESULTADOS
Earnings Release
Third Quarter of 2020
CONFERENCE CALL
Friday, November 13, 2020
English
Time: 8 a.m. (New York)
Connection data
https://choruscall.com.br/vivara/3q20.htm
Portuguese
Time: 10 a.m. (Brasília)
Connection data
https://choruscall.com.br/vivara/3t20.htm
3Q20 EARNINGS RELEASE
Sao Paulo, November 12, 2020 – Vivara Participações S.A. (B3: VIVA3), Brazil’s largest
jewelry chain, announces today its results for the 3rd quarter (3Q20) and the first 9 months
(9M20) of 2020.
Vivara Participações S.A. was founded on May 23, 2019 and, hence, for comparison
purposes, information pertaining to the nine months of 2019 refers to the combined
information of the businesses of the subsidiaries Tellerina and Conipa and the holding
company Vivara S.A. Information related to the nine months of 2020 and the third quarter
of 2019 and 2020 is consolidated in line with the Company's Financial Statements.
HIGHLIGHTS OF THE PERIOD
3
4
5
1
2
• E-commerce maintained its accelerated growth, up 182.3% in the quarter, accounting
for 22.9% of sales. Joias em Ação Project accounted for 35.6% of e-commerce sales.
• Adjusted EBITDA(1) totaled R$49.6 million in 3Q20, with margin of 20.4%, benefited
by the rebound in sales, strict cost control and protection of gross profitability.
FINANCIAL HIGHLIGHTS
(1) EBITDA (Earnings Before Interest, Taxes, Depreciation and Amortization)is a non-accounting measurement disclosed by the Company in compliance with CVM Instruction 527/12. Based on
the above calculation, an adjustment is made to eliminate non-recurring effects on income, when applicable, as well as the recognition of lease expenses related to the fixed installment of store
rents, which, since the adoption of CPC 06 / IFRS 16, ceased to be recorded as “rent expenses” in the Income Statement and are recognized as “Lease of Right-of-Use Assets” in the
Statement of Cash Flow. As such, these adjustments result in the Adjusted EBITDA.
(2) SSS (Same-Store Sales) considers gross revenue, net of returns, at stores in operation for 12 months, as well as revenues from e-commerce.
(3) Net Income adjusted by the non-recurring effects, related to the amount recognized from the favorable outcome of the lawsuit to exclude ICMS from the PIS/Cofins calculation base in 9M19,
as per the reconciliation shown on page 8.
(4) Managerial, non-accounting measurement prepared by the Company, which is not in the scope of independent audit.
2 | VIVARA 3Q20 | EARNINGS RELEASE
• Healthy inventory mix and appropriate pricing policy drove the 200bps expansion in
Gross Margin, which reached 69.8% in the quarter.
• Solid balance sheet with high liquidity, closing the quarter with cash of R$612.2
million and R$220.0 million in credit card receivables.
6
• Strong cash generation in the quarter of R$32.3 million.
• Consolidated sales in the quarter returned to 2019 levels, totaling R$308.1 million. In
September, growth was 7.2%.
Main Key Ratios (R$, 000) 3Q20 3Q19 ∆ % 9M20 9M19 ∆ %
Gross Revenue (net of return) 308,056 308,688 -0.2% 741,588 968,301 -23.4%
Net Revenue 242,626 240,334 1.0% 586,510 764,082 -23.2%
Gross Profit 169,287 163,063 3.8% 399,281 502,880 -20.6%
Gross Margin (%) 69.8% 67.8% 200 bps 68.1% 65.8% 230 bps
EBITDA 63,583 63,318 0.4% 117,520 286,550 -59.0%
Ebitda Margin (%) 26.2% 26.3% -10 bps 20.0% 37.5% -1750 bps
Adjusted EBITDA
(1)
49,594 53,575 -7.4% 78,950 153,306 -48.5%
Adjusted Ebitda Margin (%) 20.4% 22.3% -190 bps 13.5% 20.1% -660 bps
Net Income 36,147 39,570 -8.7% 53,490 225,603 -76.3%
Net Margin (%) 14.9% 16.5% -160 bps 9.1% 29.5% -2040 bps
Adjusted Net Income(3)
36,147 39,570 -8.7% 53,490 109,480 -51.1%
Adjusted Net Margin (*)
(%) 14.9% 16.5% -160 bps 9.1% 14.3% -520 bps
SSS
(2)
(physical stores + e-commerce) -3.9% 8.5% na -24.2% 9.4% na
Operational Cash Generation(4)
32,288 46,491 -30.6% 176,245 38,864 353.5%
▪ The 3Q20 results have a special meaning for us at Vivara: first, because this quarter closes
Vivara's first disclosure cycle as a listed company and then, because it is from this quarter
that we started to observe clearer signs of our operations picking up after the most
challenging period we have ever faced.
▪ The last 12 months were very busy for us: we emerged from being a closely held company to
pursue more audacious dreams, seeking more professionalization and new growth avenues.
Within a few months after our IPO preparations, we were entering a new, highly visible
environment that we were not used to. We are very grateful to our shareholders who believed
in Vivara’s plans and who have helped us to script this new chapter in our history.
▪ In the midst of it all, a pandemic struck and we were facing a scenario never seen before: yet
another challenge to overcome. In this scenario, we saw that a solid business foundation
makes all the difference and, in August, five months after the closure of stores, we started to
see clearer signs of resumption, with sales returning to pre-pandemic levels. Month after
month, we have seen the team constantly engaged in overcoming obstacles and exceeding
expectations.
▪ In the third quarter, our revenue returned to the same level as in 2019, with September
registering growth of 7.2%, matched by positive SSS. E-commerce continues to grow
consistently, partially offsetting the still weak customer traffic at stores. The gross margin
expansion of 200bps is another highlight of the quarter, in a scenario of significant increase in
raw material costs, with the jewelry category standing out during the period. We grew gross
margin across all categories and channels, which shows the resilience of our products and
the strength of our verticalized business model, which enables us to manage costs more
efficiently. Delivering Adjusted EBITDA Margin of 20.4% and Net Margin of 14.9% in a quarter
still affected by physical distancing measures is indeed a result to be celebrated. We are now
entering the Company's main sales season and are well positioned for the challenges: we
improved our e-commerce platform and the Vivara app; we have highly competitive products
in all categories and a well-defined strategy to pass through this period, gaining market share,
with the brand even more strengthened.
▪ We remain focused on our long-term projects: in 2021, we will resume accelerated organic
expansion and plan to open about 40 to 50 Vivara and Life stores; the project to structure the
Life brand is already back on course, with new initiatives to streamline operations, more
focused training and a revamped product and marketing strategy to leverage the Life brand in
a more structured manner. The omnichannel strategy has also become our strategic focus -
we invested heavily in technological renovation projects that will be important for laying the
solid groundwork for our digital transformation.
▪ We are pleased with our efforts so far, but we know that we have a long way to go. Definitive
resumption will indeed come along, and we are well positioned to seize opportunities for
consolidation and are prepared to return even stronger to cement our market leadership.
3 | VIVARA 3Q20 | EARNINGS RELEASE
Marcio Kaufman
CEO
MESSAGE FROM THE MANAGEMENT
56.9%
25.2%
14.5%
3.0% 0.3%
GROSS REVENUE (Net of Returns)
+7.2%
4 | VIVARA 3Q20 | EARNINGS RELEASE
+1.7%
• Gross revenue, net of returns, remained practically stable (-0.2%) in 3Q20, with the performance in
August and September offsetting the -10.3% decline registered in July. The measures taken to
maximize online, and store sales produced results and drove significant growth registered during the
quarter. This, combined with the further relaxation of physical distancing measures, was essential to
minimizing the effects of the pandemic on the Company's sales. SSS (Same Store Sales) in the
period declined -3.9%. Net revenue in the quarter totaled R$242.6 million, up 1.0% from the
previous year and R$586.5 million in 9M20, down -23.2%.
SALES GROWTH - BY MONTH
▪ The Company has witnessed sales
growth each month, driven by the
maturation of initiatives to
maximize sales, the triple-digit
growth of e-commerce and the
relaxation of physical distancing
measures in key markets since
late July.
3Q20 3Q19
SALES BY CATEGORY
▪ The biggest quarterly highlight in the sales mix was the jewelry category, which grew 520 bps between
the periods. This performance was driven by the opening of 23 Vivara stores in the last 12 months, the
higher share of jewelry in e-commerce sales, as a result of direct sales, as well as the sharper
increase in prices in this category.
-10.3%
214 stores
reopened
261 stores
reopened
262 stores
reopened
Revenue per chanel (R$, 000) 3Q20 3Q19 ∆ % 9M20 9M19 ∆ %
Gross Revenue (net of return) 308,056 308,688 -0.2% 741,588 968,301 -23.4%
Physical Stores 234,261 280,558 -16.5% 531,965 886,728 -40.0%
E-commerce 70,619 25,016 182.3% 201,177 64,461 212.1%
Others 2,308 1,320 74.9% 5,740 12,048 -52.4%
Deductions (65,430) (68,354) -4.3% (155,078) (204,219) -24.1%
Net Revenue 242,626 240,334 1.0% 586,510 764,082 -23.2%
SSS (physical stores + e-commerce) -3.9% 8.5% na -24.2% 9.4% na
July August September
2019 2020
51.7%
27.9%
16.7%
3.1% 0.6%
GROSS REVENUE (Net of Returns) (contd)
5 | VIVARA 3Q20 | EARNINGS RELEASE
PHYSICAL STORES
▪ We started to gradually reopen the stores in late April and ended 3Q20 with practically 100% of
the store network reopened, except the store at Terminal 3 of the Guarulhos Airport, which
remains closed. By the end of July, 214 stores had been reopened, followed by 261 in August and
262 in September. In September, a few cities in Paraná and in the interior region of São Paulo
occasionally tightened the distancing measures. Nevertheless, consolidated sales grew 7.2% and
physical store sales declined -3.2%.
▪ SSS, considering only physical stores, improved from -100.0% in April to -11.0% in September,
despite the restrictions on operations and the reduced business hours in all markets. In 3Q20,
revenue from physical stores declined -16.5%, representing 76.0% of total revenues. In 3Q19,
stores accounted for 90.9% of total revenues.
▪ Note that this growth occurred despite a scenario marked by significant reduction in the business
hours of shopping malls and broad restrictions on customer traffic at stores. Moreover, the sales of
the Joias em Ação project are booked under e-commerce revenue, and totaled R$25.2 million in
3Q20. For illustrative purposes only, considering this effect, sales at physical stores would have
decreased -7.5% from 3Q19, while in September they would have grown 3.9%.
Monthly performance of stores
9 stores
reopened
26 stores
reopened
186 stores
reopened
214 stores
opened
261 stores
opened
262 stores
opened
Sales Mix of Physical Stores
60.3%
23.5%
13.5%
2.7%
3Q20 3Q19
-3.2%
-12.5%
-32.9%
-63.7%
-89.7%
-99.7%
298
13,949
45,208
57,100
84,115
93,046
1.1%
23.9%
53.1%
65.7%
77.8%
82.3%
April May June July August September
Physical Stores Sales Growth (2020vs2019) % Stores/Total Revenue
54.7%
27.0%
15.3%
3.0%
Jewelry
Life
Watches
Acessory
GROSS REVENUE (Net of Returns) (contd)
6 | VIVARA 3Q20 | EARNINGS RELEASE
E-COMMERCE
▪ In 3Q20, e-commerce revenue grew 182.3% to reach R$70.6 million. During the quarter, the
channel lost its share of total sales, dropping from 33.5% in July to 16.4% in September, which is
a natural trend considering the normalization of store operations and the relaxation of social
distancing restrictions. In 3Q20, e-commerce represented 22.9% of total sales, compared to 8.1%
in 3Q19. In 9M20, e-commerce came to R$201.2 million, up 212.1% from 9M19.
▪ Joias em Ação project, launched in April, has gradually expanded its significance in the online
channel's performance and, more than that, has been an essential tool in balancing the channel's
sales mix, which historically has had a higher share of Watches and Life products, which are
lower ticket items than Jewelry products. In 3Q20, the initiative was responsible for 35.6% of e-
commerce sales.
E-commerce Growth
Online Channel's Sales Mix (*)
48.1%
29.9%
17.8%
4.1%
28.9%
34.8%
32.0%
4.2%
3Q20
3Q19
(*) Includes sales of Joias em Ação Project
Joias em Ação Sales Mix 3Q20
35.6%
ofe-commerce
sales
70.3%
17.7%
9.4% 2.6%
94.6% 84.1% 74.7% 70.6% 64.5% 54.4%
5.4% 15.9% 25.3% 29.4% 35.5% 45.6%
213.9% 465.9% 510.5% 202.2% 195.8% 143.4%
98.2% 75.3%
45.6% 33.5% 21.3% 16.4%
April May June July August September
Online sales growth (2020vs2019) % Share Joias em Ação % Share in Total Revenue
GROSS PROFIT AND GROSS MARGIN
▪ Gross Margin in the period reached 69.8%, up 200bps from
the same period last year, maintaining the Company's
profitability levels healthy. This result reflects the lower share
of watches in the total mix and the appropriate pricing policy
in all categories.
▪ Gross Profit in the period increased 3.8% due to the higher
share of Jewelry, driven by Joias em Ação sales. In 9M20,
Gross Margin stood at 68.1%, up 230bps from the previous
year.
OPERATING EXPENSES
▪ In 3Q20, Operating Expenses (SG&A) increased 3.3%, mainly due to (i) the gradual resumption
of operations at stores; and (ii) the more robust administrative structure since October 2019.
These effects were partially neutralized by the cost cutting and budgetary control measures taken
by the Company since the onset of the pandemic.
▪ Selling Expenses decreased -0.4% in the quarter, mainly due to (i) the adhesion to Federal Law
14,020/2020, which allowed the suspension of employment agreements of store employees
when the stores remained closed and the reduction in working hours after they reopened, with
gradually lower effects until December 2020; (ii) the discounts obtained in store rents; (iii) the
reduction in Outsourced Services and better rates on cards. The above-mentioned reduction in
expenses was more than sufficient to offset the increase in Freight, because the larger
significance of the e-commerce operation, and the increase in Marketing Expenses due to higher
investments in digital marketing.
7 | VIVARA 3Q20 | EARNINGS RELEASE
(contd)
Gross Profit (R$, 000) and Gross Margin (%) 3Q20 3Q19 Δ % 9M20 9M19 Δ %
Net Revenue 242,626 240,334 1.0% 586,510 764,082 -23.2%
Total costs (73,339) (77,271) -5.1% (187,230) (261,202) -28.3%
Acquisition of input, raw materials and products (67,171) (72,248) -7.0% (170,100) (246,541) -31.0%
% Net Revenue -27.7% -30.1% 240 bps -29.0% -32.3% 330 bps
Factory Expenses (6,169) (5,024) 22.8% (17,129) (14,661) 16.8%
% Net Revenue -2.5% -2.1% -50 bps -2.9% -1.9% -100 bps
Personal (4,942) (5,024) -1.6% (13,769) (14,661) -6.1%
% Net Revenue -2.0% -2.1% -10 bps -2.3% -1.9% -40 bps
Factory expenses (freight, energy, water, telephone and rent) (618) - na (1,597) - na
% Net Revenue -0.3% 0.0% -30 bps -0.3% 0.0% -30 bps
Depreciation (609) - na (1,763) - na
% Net Revenue -0.3% 0.0% -30 bps -0.3% 0.0% -30 bps
Gross profit 169,287 163,063 3.8% 399,281 502,880 -20.6%
Gross margin % 69.8% 67.8% 200 bps 68.1% 65.8% -230 bps
Operating Expenses (R$, 000) 3Q20 3Q19 ∆ % 9M20 9M19 ∆ %
Operating Expenses (103,691) (100,420) 3.3% (294,266) (324,527) -9.3%
Operating Expenses/Net Revenue (%) -42.7% -41.8% -100 bps -50.2% -42.5% -770 bps
Selling Expenses (78,956) (79,293) -0.4% (209,687) (243,755) -14.0%
Selling Expenses/Net Revenue (%) -32.5% -33.0% 50 bps -35.8% -31.9% -390 bps
General and Administrative Expenses (24,736) (21,127) 17.1% (84,578) (80,772) 4.7%
General and Administrative Expenses/Net Revenue (%) -10.2% -8.8% -140 bps -14.4% -10.6% -380 bps
Other Operating Expenses (2,621) 675 488.4% 10,742 108,197 90.1%
Total Operating Expenses (106,313) (99,745) 6.6% (283,524) (216,330) 31.1%
OPERATING EXPENSES (contd)
▪ General and Administrative Expenses increased 17.1%, mainly due to (i) the larger
administrative structure, reflecting the strengthening of strategic areas, and the benefits obtained
by adhering to Federal Law 14,020/2020, whose effects will be observed until December 2020;
(ii) the increase in Outsourced Services, due to digital acceleration projects, technological
improvements and miscellaneous consulting services, necessary for rolling out the long-term
strategy.
▪ Expenses solely related to facing the pandemic affected Selling, General and Administrative
Expenses by R$1.2 million in 3Q20.
▪ Other Operating Expenses (Income) reached -R$2.6 million in the quarter, mainly due to the
adequacy in the provisions.
8 | VIVARA 3Q20 | EARNINGS RELEASE
• Though operations were affected by store closures, especially in July, when sales declined -10.3%,
the Company ended the quarter close with Adjusted EBITDA of R$49.6 million and Adjusted
EBITDA Margin of 20.4%, thanks to the successful initiatives to maximize sales, and the
expansion of Gross Margin, and costs control.
• In 9M20, Adjusted EBITDA reached R$78.9 million, with margin of 13.5%.
ADJUSTED EBITDA AND ADJUSTED EBITDA MARGIN
(4) The fixed portion of rent expenses, shown here, is booked in the Statement of Cash Flows as "Lease of Right-of-Use Assets," due to the adoption of IFRS 16. More detailed information
on the accounting standard is available in Note 24 to the Financial Statements of the Company.
NET INCOME AND NET MARGIN
• The Company registered Net Income of R$36.1 million in 3Q20, reflecting the operational
performance during the period, as well as the lower inflation adjustment on recoverable taxes and
deferred taxes.
• We present Adjusted Net Income for 9M19, excluding the non-recurring effect of the favorable
outcome of the lawsuit to exclude ICMS from the PIS/Cofins base, in the amount of R$116.1 million,
recognized in 2Q19.
EBITDA Reconciliation (R$, 000) 3Q20 3Q19 ∆ % 9M20 9M19 ∆ %
Net Income 36,147 39,570 -8.7% 53,490 225,603 -76.3%
(+) Income and Social Contribution Taxes (603) (269) 124.1% (11,984) 32,409 -137.0%
(+) Financial Result 12,390 13,034 -4.9% 32,621 (3,956) 924.6%
(+) Depreciation and Amortization 15,649 10,982 42.5% 43,393 32,495 33.5%
Total EBITDA 63,583 63,318 0.4% 117,520 286,550 -59.0%
(-) Rental expense (IFRS16)
(4)
(13,989) (9,743) -43.6% (38,570) (29,586) -30.4%
(+) Non-recurring effect - - na - (103,658) na
Adjusted EBITDA 49,594 53,575 -7.4% 78,950 153,306 -48.5%
Adjusted EBITDA Margin (%) 20.4% 22.3% -190 bps 13.5% 20.1% -660 bps
Reconciliation of Adjusted Net Income (R$, 000) 3Q20 3Q19 ∆ % 9M20 9M19 ∆ %
Net Income 36,147 39,570 -8.7% 53,490 225,603 -76.3%
Net Margin (%) 14.9% 16.5% -160 bps 9.1% 29.5% -7090 bps
Non-recurring effect - - na - (116,123) na
Adjusted Net Income 36,147 39,570 -8.7% 53,490 109,480 -51.1%
Adjusted Net Margin (%) 14.9% 16.5% -160 bps 9.1% 14.3% -520 bps
9 | VIVARA 3Q20 | EARNINGS RELEASE
DEBT
▪ In 3Q20, the Company's debt ratio stood at -1.4x, reflecting the operating cash generation, the
lengthening of debt maturities and the financial discipline that ensured the preservation of funds
during the period.
CAPEX
▪ Capital expenditure totaled R$11.4 million in
the quarter, down 22.4% from the same
period last year, mainly due to (i) the revision
of the expansion plan for 2020, reducing the
allocation of investments in new stores; (ii)
higher investments in systems and IT,
especially for technological upgrade projects,
which are important for rolling out the
omnichannel strategy.
▪ In 3Q20, the Company inaugurated 5 new
operations - 2 Vivara stores, 2 Life stores and
1 kiosk - and closed 1 Life kiosk, which was
converted into a store, ending the period with
263 points of sale, which include 207 Vivara
stores, 11 Life stores and 45 kiosks.
Net Debt (R$, 000) 9M20 1H20 ∆ % 2019 ∆ %
Borrowings and financings 330,019 320,500 3.0% 270,354 22.1%
Cash and cash equivalents and Securities 612,245 584,679 4.7% 435,844 40.5%
Net Debt (282,226) (264,179) -6.8% (165,490) -70.5%
Adjusted EBITDA LTM (last twelve months) 197,779 211,030 -6.3% 272,134 -27.3%
Net Debt/Adjusted Ebitda 1.4x- 1.3x- na 0.6x- na
Investments (R$, 000) 3Q20 3Q19 ∆ % 9M20 9M19 ∆ %
Total Capex 11,378 14,670 -22.4% 37,742 25,389 48.7%
New Stores 2,314 6,451 -64.1% 21,182 9,545 121.9%
Reforms and Maintenance 2,436 910 167.8% 6,698 3,633 84.4%
Factory 966 3,053 -68.4% 2,219 4,346 -48.9%
Systems/IT 5,662 3,185 77.8% 7,626 4,762 60.2%
Others 0 1,071 -100.0% 17 3,104 -99.4%
CAPEX/Net Revenue (%) 4.7% 6.1% -140 bps 6.4% 3.3% -310 bps
259 2632 2 1
-1
10 | VIVARA 3Q20 | EARNINGS RELEASE
▪ Vivara generated cash of R$32.3 million in 3Q20, R$14.2 million lower than in the same period
last year, mainly due to the higher allocation of working capital with the resumption of store
operations.
▪ Apart from the adjustments to income tax (IR) and social contribution (CSLL) and other non-cash
items, we adjusted Net Income to rent payments in the amount of R$9.8 million in 3Q20 and
R$9.7 million in 3Q19, which, after the adoption of IFRS 16, are being booked in the consolidated
financial statements as Financing Activity.
CASH GENERATION
(4) This is a managerial, non-accounting measurement prepared by the Company, which is not in the scope of independent audit.
EXPANSION
2Q20 New Stores New Stores New Conversions/ 3Q20
Vivara Life Kiosks Closures
3Q20 EXPANSION
263259259253240
EXPANSION
Cash Flow (R$, 000) 3Q20 3Q19 ∆ % 9M20 9M19 ∆ %
Net Income 36,147 39,570 -8.7% 53,490 225,607 -76.3%
(+/-) Income and Social Contribution Taxes/Others 5,133 (7,803) 165.8% 12,848 (133,205) 109.6%
Adjusted Net Income 41,280 31,767 29.9% 66,338 92,402 -28.2%
Working Capital (8,992) 14,724 -161.1% 109,908 (53,539) 305.3%
Trade receivables (14,289) 38,733 -136.9% 199,515 28,477 600.6%
Inventories (7,341) 1,172 -726.4% (18,694) (16,598) 12.6%
Trade payables (9,565) (8,762) 9.2% (27,382) (16,041) 70.7%
Recoverable taxes 11,985 (108) 11238.5% 29,081 (11,413) 354.8%
Taxes payable 8,125 (16,504) 149.2% (48,637) (30,294) 60.5%
Other assets and liabilities 2,093 192 992.3% (23,976) (7,669) 212.6%
Cash from Management Operating Activities 32,288 46,491 -30.6% 176,245 38,864 353.5%
Capex (11,377) (14,670) -22.4% (37,742) (25,389) 48.7%
Freee Cash Generation (5) 20,911 31,821 -34.3% 138,503 13,474 927.9%
184 191 201 205 207
2 6 8 9 1154
56 50 45 45
3Q19 4Q19 1Q20 2Q20 3Q20
Vivara Life Kioks
Southeast 52%
South 16%
North 5%
Northeast 18%
Midwest 11%
Distribution by region
OUTLOOK
11 | VIVARA 3Q20 | EARNINGS RELEASE
▪ 4Q20 Trend – Pace of sales in October(*) shows
acceleration for the sixth straight month since the
pandemic broke out. In October, the Company's sales
grew 14,5% in relation to the same month last year,
reflecting the longer business hours at shopping malls and
the relaxation of physical distancing measures, which
intensified last month.
▪ The final quarter of the year is seasonally the most
significant for our results. In 2019, the 4th quarter
accounted for 35% of Gross Revenue, 33% of Adjusted
EBITDA and around 40% of Net Income (adjusted for non-
recurring effects) in the year. In 2020, due to the effects of
the pandemic on previous quarter, this share should be
higher in all indicators, which brings additional operational
challenges. All our efforts are focused on Black Friday and
Christmas, two dates that depend highly on customer
traffic at stores, to ensure optimum operations and an
adequate inventory composition.
▪ Raw material costs – The Company remains focused on
initiatives to offset, even if partially, the effect of the sharp
increase in gold and silver prices since the start of 2020.
Hence, as already announced in the 3Q20 results, the
Company maintains its strategy of gradually passing
through the price increase and developing products that
combine commercial appeal and profitability.
▪ Expansion plan: After revising the 2020 expansion plan in
view of uncertainties brought on by the pandemic, the
Company is resuming plans to accelerate growth in 2021
and is planning to open about 40 to 50, of Vivara and Life
stores. For the long-term strategy, the Company maintains
its commitment to expanding its presence in leading
shopping malls across Brazil through organic expansion of
its channels.
(1) Unaudited managerial result in October.
INCOME STATEMENT
12 | VIVARA 3Q20 | EARNINGS RELEASE
*
*Vivara Participações S.A. was founded on May 23, 2019, and hence information related to 9M19 refers to the combined information of the
subsidiaries Tellerina and Conipa.
Financial Statements (R$ ,000) 3Q20 3Q19* ∆ % 9M20 9M19* ∆ %
Sales Gross Revenue 375,910 374,468 0.4% 893,313 1,183,099 -24.5%
Service Gross Revenue 868 1,794 -51.6% 2,706 5,065 -46.6%
Gross Revenue Deductions (65,430) (68,354) -4.3% (155,078) (204,219) -24.1%
Exchange and Return (68,722) (67,575) 1.7% (154,431) (219,862) -29.8%
Net Revenue 242,626 240,334 1.0% 586,510 764,082 -23.2%
(-) Cost of Sold Goods (72,730) (77,271) -5.9% (185,466) (261,202) -29.0%
(-) Depreciation and Amortization (609) - na (1,763) - na
(=) Gross Profit 169,287 163,063 3.8% 399,281 502,880 -20.6%
(-) Operating Expenses (121,352) (110,727) 9.6% (325,153) (248,825) 30.7%
Sales (78,956) (79,293) -0.4% (209,687) (243,755) -14.0%
Personal (35,478) (41,353) -14.2% (98,890) (119,141) -17.0%
Rentals and common area maintenance fees (9,940) (11,526) -13.8% (26,435) (35,339) -25.2%
Lease discounts 4,207 - na 13,483 - na
Freight (6,104) (5,639) 8.2% (18,247) (14,753) 23.7%
Commission on credit cards (4,470) (5,153) -13.3% (11,347) (17,082) -33.6%
Outsourced services (2,261) (3,606) -37.3% (7,263) (7,901) -8.1%
Marketing/selling expenses (11,561) (6,781) 70.5% (37,081) (31,454) 17.9%
Other selling expenses (13,349) (5,235) 155.0% (23,908) (18,085) 32.2%
General and Administratives (24,736) (21,127) 17.1% (84,578) (80,772) 4.7%
Personal (10,817) (8,341) 29.7% (38,768) (36,441) 6.4%
Rentals and common area maintenance fees (47) (301) -84.4% (504) (609) -17.3%
Outsourced services (10,368) (9,298) 11.5% (31,191) (24,000) 30.0%
Other General and Administratives expenses (3,503) (3,187) 9.9% (14,115) (19,723) -28.4%
Depreciation and Amortization (15,040) (10,982) 36.9% (41,630) (32,495) 28.1%
Share of profit (loss) of subsidiaries - (68) -100.0% - (247) -100.0%
Other Operating Expenses (Revenues) (2,621) 743 -453.0% 10,742 108,444 -90.1%
(=) Profit (Losses) Before Financial Results 47,934 52,335 -8.4% 74,128 254,055 -70.8%
(=) Financial Result (12,390) (13,034) -4.9% (32,621) 3,956 -924.6%
Financial Income (Expenses), net 5,684 6,210 -8.5% 19,118 60,029 -68.2%
Finance costs, net (18,075) (19,244) -6.1% (51,739) (56,073) -7.7%
(=) Operating Income 35,544 39,301 -9.6% 41,506 258,011 -83.9%
Income and Social Contribution Taxes 603 269 124.1% 11,984 (32,409) -137.0%
(=) Net Income 36,147 39,570 -8.7% 53,490 225,603 -76.3%
BALANCE SHEET
13 | VIVARA 3Q20 | EARNINGS RELEASE
Balance Sheet (R$, 000) 9M20 2019
CURRENT ASSETS
Cash and cash equivalents 519,414 435,844
Securities 65,815 -
Trade receivables 226,696 425,833
Due from related parties - -
Inventories 367,381 348,034
Recoverable taxes 93,961 95,247
Prepaid expenses and other receivables 3,106 7,669
Derivatives 21,412 6,796
Total current assets 1,297,785 1,319,425
NONCURRENT ASSETS
Securities 27,016 -
Escrow deposits 13,542 13,680
Deferred income tax and social contribution 92,139 54,200
Derivatives - 2,715
Recoverable taxes 132,062 168,344
Investments - -
Property, plant and equipment 334,211 311,620
Intangible assets 13,904 9,546
Total noncurrent assets 612,873 560,104
TOTAL ASSETS 1,910,659 1,879,529
CIRCULANTE
Trade payables 9,039 36,421
Borrowings and financing 275,019 190,934
Due to related parties 22 88
Payroll and related taxes 42,977 65,175
Taxes payable 42,099 86,778
Taxes in installments 353 457
Leases payable 21,226 14,856
Leasing liabilities 28,806 24,119
Interest on capital 35,563 8,124
Other payables 22,338 31,862
Total current liabilities 477,442 458,813
NONCURRENT LIABILITIES
Labor and social security obligations 6,954 9,193
Borrowings and financing 55,000 79,420
Taxes in installments 1,622 1,865
Provision for civil, labor and tax risks 17,195 15,234
Leasing liabilities 236,672 225,281
Total noncurrent liabilities 317,442 330,992
EQUITY
Capital 1,052,340 1,052,340
Legal reserve 9,945 37,384
Earnings reserves 53,490 -
Retained earnings (accumulated losses) - -
Total equity 1,115,775 1,089,724
TOTAL LIABILITIES AND EQUITY 1,910,659 1,879,529
CASH FLOW
14 | VIVARA 3Q20 | EARNINGS RELEASE
*Vivara Participações S.A. was founded on May 23, 2019, and hence information related to 9M19 refers to the combined information of the
subsidiaries Tellerina and Conipa.
*
Cash Flow (R$ ,000) 3Q20 3Q19 ∆ % 9M20 9M19* ∆ %
Net Income 36,147 39,570 -8.7% 53,490 225,607 -76.3%
Adjust of Net Income 22,698 20,607 10.1% 54,572 (62,998) 186.6%
Adjusted profit for the year 58,844 60,177 -2.2% 108,062 162,609 -33.5%
Increase (decrease) in operating assets and liabilities:
Trade receivables (14,289) 38,733 -136.9% 199,515 28,477 600.6%
Inventories (7,341) 1,172 -726.4% (18,694) (16,598) -12.6%
Trade payables (9,565) (8,762) -9.2% (27,382) (16,041) -70.7%
Recoverable taxes 11,985 (108) 11238.5% 29,081 (11,413) 354.8%
Taxes payable 8,125 (16,504) 149.2% (48,637) (30,294) -60.5%
Other assets and liabilities 2,093 1,049 99.5% (23,976) (7,669) -212.6%- - - -
Cash provided by operating activities 49,852 75,759 -34.2% 217,970 109,070 99.8%
Income tax and social contribution paid (5,636) (11,086) 49.2% (9,127) (26,195) 65.2%
Paid interest on borrowing and financing (2,147) (7,581) 71.7% (7,510) (14,425) 47.9%
Interest paid on leasing liabilities (7,483) - na (16,548) - na- - - -
Net cash provided by operating activities 34,587 57,091 -39.4% 184,785 68,450 170.0%
Property, plant and equipment (8,219) (11,933) 31.1% (33,716) (20,622) -63.5%
Intangible assets (3,158) (2,737) -15.4% (4,027) (4,767) 15.5%
Others (92,831) 2,430 na (92,831) 1,645 na- - - -
Cash Flow from Investments (104,208) (12,239) -751.4% (130,573) (23,744) -449.9%
Interest on capital / Dividends paid - - - - (67,418) 100.0%
Borrowings and financings 6,656 (14,551) 145.7% 16,285 57,542 -71.7%
Righ-of-use leases (2,299) (9,743) 76.4% (8,539) (29,586) 71.1%
Others - 1,282 na 21,612 2,605 729.5%3,630,176 -100.0% - - -
Cash flow from financing activities 4,356 (23,011) 118.9% 29,359 (36,857) 179.7%
INCREASE (DECREASE) IN CASH AND CASH EQUIV. (65,264) 21,841 -398.8% 83,570 7,848 964.8%-
Opening balance of cash and cash equivalents 584,679 66,726 776.2% 435,844 84,781 414.1%
Closing balance of cash and cash equivalents 519,414 87,704 492.2% 519,414 87,704 492.2%
▪ Adjusted EBITDA and Adjusted EBITDA Margin - Earnings Before Interest, Taxes, Depreciation
and Amortization (EBITDA) is a non-accounting measurement disclosed by the Company in
compliance with CVM Instruction 527/12. The above calculation is adjusted to eliminate non-
recurring effects from the result and, for better comparison, the effects of the adoption of CPC
06/IFRS 16, which came into effect on January 1, 2019, are excluded as well, which result in
Adjusted EBITDA. Non-recurring effects are characterized by one-time effects on the Company's
result. Since these amounts are not a recurrent portion of the result, the Company chooses to
make the adjustment so that Adjusted EBITDA considers only recurring numbers. The Company
uses Adjusted EBITDA as a measure of performance for managerial effect and for comparison with
peers.
▪ Net Debt - The Net Debt shown here is the result of the sum of short- and long-term loans in
Current Liabilities and Non-Current Liabilities of the Company, deducted from the sum of Cash and
Cash Equivalents and Securities under the Current Assets and Non-Current Assets of the
Company.
▪ The Company believes that the Net Debt/Adjusted EBITDA ratio helps in assessing its leverage
and liquidity. LTM Adjusted EBITDA is the sum of Last Twelve Months EBITDA and is also an
alternative to operational cash generation.
▪ Adjusted EBITDA, Net Debt, Net Debt/LTM Adjusted EBITDA and Operational Cash
Generation presented in this release are not profitability measures as per the accounting practices
adopted in Brazil and do not represent the cash flow during the periods and, hence, must not be
considered as alternative measures to results or cash flows
▪ Operating Cash Generation shown here is a managerial measurement, resulting from the cash
flow from operating activities presented in the Statement of Cash Flow (adjusted by “Lease of
Right-of-Use Assets,” which, after the adoption of CPC 06 / IFRS 16, is being booked in the
Statement of Cash Flow as financing activity.
The statements contained in this release related to the business outlook, operating and financial
projections and growth prospects of Vivara S.A. are merely projections and as such are based
exclusively on the expectations of the Company’s management concerning the future of the business.
Such forward-looking statements depend substantially on changes in market conditions, the
performance of the Brazilian economy, the industry and international markets and are, therefore,
subject to change without prior notice.
All variations presented herein are calculated based on numbers in thousands of reais, as well as
rounded figures.
This report includes accounting and non-accounting data, such as pro forma operating and financial
information and projections based on expectations of the Company's Management. Note that the non-
accounting figures have not been reviewed by the Company’s independent auditors.
INVESTOR RELATIONS
Otavio Lyra – CFO and Investor Relations Officer
Melina Rodrigues – IR Manager
Andressa Nunes – IR Analyst
E-mail: ri@vivara.com.br
Phone: 11 3896-2736 /11 3896-2721
NON-ACCOUNTING MEASURES
DISCLAIMER
15 | VIVARA 3Q20 | EARNINGS RELEASE
024805000101011 (1)

Mais conteúdo relacionado

Mais procurados

Clipping Fevereiro 2010 4
Clipping Fevereiro 2010 4Clipping Fevereiro 2010 4
Clipping Fevereiro 2010 4Ricardo Pastore
 
Como minimizar os impactos da COVID-19 - Agricultura
Como minimizar os impactos da COVID-19 - AgriculturaComo minimizar os impactos da COVID-19 - Agricultura
Como minimizar os impactos da COVID-19 - AgriculturaGabrielNunes201
 
Clipping do Varejo 25072011
Clipping do Varejo 25072011Clipping do Varejo 25072011
Clipping do Varejo 25072011Ricardo Pastore
 
Como minimizar os impactos da COVID-19 - Segmento Farmacêutico
Como minimizar os impactos da COVID-19 - Segmento FarmacêuticoComo minimizar os impactos da COVID-19 - Segmento Farmacêutico
Como minimizar os impactos da COVID-19 - Segmento FarmacêuticoGabrielNunes201
 
Planejamento Estratégico 2020-2022
Planejamento Estratégico 2020-2022Planejamento Estratégico 2020-2022
Planejamento Estratégico 2020-2022TIM RI
 
Impactos da Covid-19 nas empresas abertas brasileiras em 2020
Impactos da Covid-19 nas empresas abertas brasileiras em 2020Impactos da Covid-19 nas empresas abertas brasileiras em 2020
Impactos da Covid-19 nas empresas abertas brasileiras em 2020GabrielNunes201
 

Mais procurados (15)

10. panorama comex mg out2011
10. panorama comex mg out201110. panorama comex mg out2011
10. panorama comex mg out2011
 
09. panorama comex mg set2011
09. panorama comex mg set201109. panorama comex mg set2011
09. panorama comex mg set2011
 
024910000101011 (1)
024910000101011 (1)024910000101011 (1)
024910000101011 (1)
 
010456000101011
010456000101011010456000101011
010456000101011
 
Clipping Fevereiro 2010 4
Clipping Fevereiro 2010 4Clipping Fevereiro 2010 4
Clipping Fevereiro 2010 4
 
Como minimizar os impactos da COVID-19 - Agricultura
Como minimizar os impactos da COVID-19 - AgriculturaComo minimizar os impactos da COVID-19 - Agricultura
Como minimizar os impactos da COVID-19 - Agricultura
 
Merithu v3
Merithu v3Merithu v3
Merithu v3
 
021130000101011 (3)
021130000101011 (3)021130000101011 (3)
021130000101011 (3)
 
Apimec 2010
Apimec 2010Apimec 2010
Apimec 2010
 
Fecomércio divulga o resultado das vendas de Material Escolar
Fecomércio divulga o resultado das vendas de Material EscolarFecomércio divulga o resultado das vendas de Material Escolar
Fecomércio divulga o resultado das vendas de Material Escolar
 
020338000101011
020338000101011020338000101011
020338000101011
 
Clipping do Varejo 25072011
Clipping do Varejo 25072011Clipping do Varejo 25072011
Clipping do Varejo 25072011
 
Como minimizar os impactos da COVID-19 - Segmento Farmacêutico
Como minimizar os impactos da COVID-19 - Segmento FarmacêuticoComo minimizar os impactos da COVID-19 - Segmento Farmacêutico
Como minimizar os impactos da COVID-19 - Segmento Farmacêutico
 
Planejamento Estratégico 2020-2022
Planejamento Estratégico 2020-2022Planejamento Estratégico 2020-2022
Planejamento Estratégico 2020-2022
 
Impactos da Covid-19 nas empresas abertas brasileiras em 2020
Impactos da Covid-19 nas empresas abertas brasileiras em 2020Impactos da Covid-19 nas empresas abertas brasileiras em 2020
Impactos da Covid-19 nas empresas abertas brasileiras em 2020
 

Semelhante a 024805000101011 (1)

Semelhante a 024805000101011 (1) (20)

025372000101011.pdf
025372000101011.pdf025372000101011.pdf
025372000101011.pdf
 
025038000101011 (7).pdfjjasgdaiooajslasooa
025038000101011 (7).pdfjjasgdaiooajslasooa025038000101011 (7).pdfjjasgdaiooajslasooa
025038000101011 (7).pdfjjasgdaiooajslasooa
 
025011000101011 (2).pdf
025011000101011 (2).pdf025011000101011 (2).pdf
025011000101011 (2).pdf
 
locaweb ri
locaweb rilocaweb ri
locaweb ri
 
024805000101011 (1)
024805000101011 (1)024805000101011 (1)
024805000101011 (1)
 
meliuz 4T22
meliuz 4T22meliuz 4T22
meliuz 4T22
 
grupo mateus 4t22
grupo mateus 4t22grupo mateus 4t22
grupo mateus 4t22
 
Press Releases 2 T06
Press Releases 2 T06Press Releases 2 T06
Press Releases 2 T06
 
022799000101011 (1)
022799000101011 (1)022799000101011 (1)
022799000101011 (1)
 
019909000101011 (1)
019909000101011 (1)019909000101011 (1)
019909000101011 (1)
 
024228000101011 (1)
024228000101011 (1)024228000101011 (1)
024228000101011 (1)
 
1 t21 boas3_boa_vitsa_er
1 t21 boas3_boa_vitsa_er1 t21 boas3_boa_vitsa_er
1 t21 boas3_boa_vitsa_er
 
Relatorio kpmg-vulcabras-2010-ifrs-01.03.2011
Relatorio kpmg-vulcabras-2010-ifrs-01.03.2011Relatorio kpmg-vulcabras-2010-ifrs-01.03.2011
Relatorio kpmg-vulcabras-2010-ifrs-01.03.2011
 
CAMIL 1T23
CAMIL 1T23CAMIL 1T23
CAMIL 1T23
 
Resultado do 3° trimestre da Via Varejo
Resultado do 3° trimestre da Via VarejoResultado do 3° trimestre da Via Varejo
Resultado do 3° trimestre da Via Varejo
 
alpargatas 4t22
alpargatas 4t22alpargatas 4t22
alpargatas 4t22
 
Apimec 2009
Apimec 2009Apimec 2009
Apimec 2009
 
MAGAZINE LUIZA - RESULTADOS 4T23 E 2023 - LUCRO
MAGAZINE LUIZA - RESULTADOS 4T23 E 2023 - LUCROMAGAZINE LUIZA - RESULTADOS 4T23 E 2023 - LUCRO
MAGAZINE LUIZA - RESULTADOS 4T23 E 2023 - LUCRO
 
Aliansce resultado
Aliansce resultadoAliansce resultado
Aliansce resultado
 
016306000101011 (1)
016306000101011 (1)016306000101011 (1)
016306000101011 (1)
 

Mais de RenanDantasdosSantos (20)

025038000101011 (1).pdf
025038000101011 (1).pdf025038000101011 (1).pdf
025038000101011 (1).pdf
 
026620000101011 (1).pdf
026620000101011 (1).pdf026620000101011 (1).pdf
026620000101011 (1).pdf
 
002437000101011 (14).pdf
002437000101011 (14).pdf002437000101011 (14).pdf
002437000101011 (14).pdf
 
011312000101011 (14).pdf
011312000101011 (14).pdf011312000101011 (14).pdf
011312000101011 (14).pdf
 
020257000101011 (7).pdf
020257000101011 (7).pdf020257000101011 (7).pdf
020257000101011 (7).pdf
 
025291000101011 (11).pdf
025291000101011 (11).pdf025291000101011 (11).pdf
025291000101011 (11).pdf
 
004030000101011 (7).pdf
004030000101011 (7).pdf004030000101011 (7).pdf
004030000101011 (7).pdf
 
018376000101011 (8).pdf
018376000101011 (8).pdf018376000101011 (8).pdf
018376000101011 (8).pdf
 
006505000101011 (9).pdf
006505000101011 (9).pdf006505000101011 (9).pdf
006505000101011 (9).pdf
 
021610000101011 (13).pdf
021610000101011 (13).pdf021610000101011 (13).pdf
021610000101011 (13).pdf
 
021431000101011 (4).pdf
021431000101011 (4).pdf021431000101011 (4).pdf
021431000101011 (4).pdf
 
024090000101011 (7).pdf
024090000101011 (7).pdf024090000101011 (7).pdf
024090000101011 (7).pdf
 
63610be5-33d2-4cea-8e87-4d9eb5b0a975.pdf
63610be5-33d2-4cea-8e87-4d9eb5b0a975.pdf63610be5-33d2-4cea-8e87-4d9eb5b0a975.pdf
63610be5-33d2-4cea-8e87-4d9eb5b0a975.pdf
 
74281cd6-8f39-458e-a648-d2bb855120bd.pdf
74281cd6-8f39-458e-a648-d2bb855120bd.pdf74281cd6-8f39-458e-a648-d2bb855120bd.pdf
74281cd6-8f39-458e-a648-d2bb855120bd.pdf
 
008133000101011 (10).pdf
008133000101011 (10).pdf008133000101011 (10).pdf
008133000101011 (10).pdf
 
024821000101011 (7).pdf
024821000101011 (7).pdf024821000101011 (7).pdf
024821000101011 (7).pdf
 
026247000101011 (3).pdf
026247000101011 (3).pdf026247000101011 (3).pdf
026247000101011 (3).pdf
 
020125000101011 (6).pdf
020125000101011 (6).pdf020125000101011 (6).pdf
020125000101011 (6).pdf
 
003069000101011 (8).pdf
003069000101011 (8).pdf003069000101011 (8).pdf
003069000101011 (8).pdf
 
png2pdf.pdf
png2pdf.pdfpng2pdf.pdf
png2pdf.pdf
 

024805000101011 (1)

  • 1. Release de Resultados Terceiro Trimestre de 2020 VIDEOCONFERÊNCIA DE RESULTADOS Sexta-feira, 13 de novembro de 2020 Português Horário: 10h00 (Horário de Brasília) Dados de Conexão https://choruscall.com.br/vivara/3t20.htm Inglês Horário: 8h00 (Horário de Nova York) Dados para conexão https://choruscall.com.br/vivara/3q20.htm
  • 2. DIVULGAÇÃO DE RESULTADOS DO 3T20 São Paulo, 12 de novembro de 2020 - A Vivara Participações S.A. (B3: VIVA3), a maior rede de joalherias do Brasil, divulga os resultados do 3º trimestre de 2020 e o acumulado nos nove meses de 2020. A Vivara Participações S.A. foi constituída no dia 23 de maio de 2019 e, por esta razão, para permitir a comparabilidade, as informações dos nove meses de 2019, aqui apresentadas, referem-se à informação combinada dos negócios das subsidiarias Tellerina e Conipa e da holding, Vivara S.A.. Já as informações referentes aos nove meses de 2020, bem como as do terceiro trimestre de 2019 e 2020 são consolidadas em linha com as Demonstrações Financeiras da Companhia. DESTAQUES DO PERÍODO 3 4 5 1 2 • O e-commerce manteve o ritmo acelerado, com crescimento de 182,3% no trimestre, representando 22,9% do faturamento. Projeto Joias em Ação registrou 35,6% de participação nas vendas do e-commerce. • O EBITDA Ajustado(1) totalizou R$ 49,6 milhões, no 3T20, com margem de 20,4%, beneficiado pela retomada dos níveis de vendas, rígido controle de despesas e proteção de rentabilidade bruta. DESTAQUES FINANCEIROS (1) EBITDA (Earnings before Interest, Taxes and Depreciation and Amortization) é uma medição não contábil divulgada pela Companhia em consonância com a Instrução CVM nº 527/12. A partir do cálculo acima, é realizado o ajuste para eliminação de efeitos não recorrentes no resultado, quando aplicável, bem como o reconhecimento das despesas de arrendamento, referente à parcela fixa do aluguel das lojas, que a partir da adoção do CPC06/IFRS16, deixaram de ser registradas como “despesas de aluguel” na Demonstração de Resultados e passaram a ser reconhecidas como “Arrendamento do Direito de Uso, na Demonstração de Fluxo de Caixa. Assim, os ajustes geram o EBITDA Ajustado. (2) SSS - vendas em mesmas lojas (Same Store Sales), considera a receita bruta líquida de devoluções, de lojas com 12 meses de operação, além de incluir as receitas de e-commerce. (3) Lucro Líquido Ajustado pelo efeito não recorrentes, referente ao reconhecido do ganho da ação de exclusão do ICMS da base de PIS/Confins no período acumulado em 9M19, conforme conciliação apresentada na página 8. (4) Medição gerencial, não contábil, elaborada pela Companhia, e não é parte integrante do escopo de trabalho da auditoria independente. 2 | VIVARA 3T20 | RELEASE DE RESULTADOS • Boa composição de estoques e adequada política de precificação garantiu expansão de +2,0 p.p de Margem Bruta, que atingiu 69,8%, no trimestre. • Balanço sólido, com ampla liquidez, encerrando o trimestre com caixa de R$ 612,2 milhões e R$ 220,0 milhões de recebíveis de cartão de crédito. 6 • Forte geração de caixa no trimestre, com adição de R$ 32,3 milhões. • As vendas consolidadas do trimestre retomaram ao mesmo patamar de 2019, registrando R$ 308,1 milhões. Em setembro, o crescimento foi de +7,2%. Principais Indicadores Financeiros (R$ mil) 3T20 3T19 ∆ % 9M20 9M19 ∆ % Receita Bruta (liq. de devoluções) 308.056 308.688 -0,2% 741.588 968.301 -23,4% Receita Líquida 242.626 240.334 1,0% 586.510 764.082 -23,2% Lucro bruto 169.287 163.063 3,8% 399.281 502.880 -20,6% Margem Bruta (%) 69,8% 67,8% 2,0 p.p. 68,1% 65,8% 2,3 p.p. EBITDA 63.583 63.318 0,4% 117.520 286.550 -59,0% Margem Ebitda (%) 26,2% 26,3% (0,1 p.p.) 20,0% 37,5% (17,5 p.p.) EBITDA Ajustado (1) 49.594 53.575 -7,4% 78.950 153.306 -48,5% Margem Ebitda Ajustada (%) 20,4% 22,3% (1,9 p.p.) 13,5% 20,1% (6,6 p.p.) Lucro Líquido 36.147 39.570 -8,7% 53.490 225.603 -76,3% Margem Liquida (%) 14,9% 16,5% (1,6 p.p.) 9,1% 29,5% (20,4 p.p.) Lucro Líquido Ajustado(3) 36.147 39.570 -8,7% 53.490 109.480 -51,1% Margem Liquida Ajustada (%) 14,9% 16,5% (1,6 p.p.) 9,1% 14,3% (5,2 p.p.) SSS (2) (lojas físicas + e-commerce) -3,9% 8,5% na -24,2% 9,4% na Geração de Caixa Operacional(4) 32.288 46.491 -30,6% 176.245 38.864 353,5%
  • 3. MENSAGEM DA ADMINISTRAÇÃO  Os resultados do terceiro trimestre de 2020 trazem um significado especial para nós da Vivara: primeiro, porque fecha o primeiro ciclo de divulgações da Vivara como empresa listada e, depois, porque, foi a partir desse trimestre que começamos a identificar sinais mais claros da retomada da operação, após o momento mais desafiador que já enfrentamos.  Os últimos 12 meses foram muito intensos para nós, saímos de um ambiente de Companhia fechada para almejar sonhos mais arrojados, buscar mais profissionalização, avanços em governança e novos caminhos de crescimento. Em poucos meses após iniciarmos a estruturação do IPO, começamos a transitar em um ambiente tão novo, de muita visibilidade, que até então não estávamos acostumados. Temos muito para agradecer aos nossos acionistas que acreditaram no projeto da Vivara e tem nos ajudado a construir esse novo ciclo da nossa história.  No meio de tudo isso, uma pandemia se instaurou e nos vimos diante de um cenário nunca vivido: mais um desafio novo a ser enfrentado. Diante deste cenário vimos as bases do negócio fazer toda a diferença e, em agosto, após cinco meses desde o fechamento das lojas, começamos a ver sinais mais claros de retomada, com as vendas voltando aos patamares pré-pandemia. Mês após mês temos visto o time engajado para superar os obstáculos, entregando mais que o esperado.  No terceiro trimestre, nossa receita voltou ao mesmo nível do mesmo período de 2019, com setembro já aprontando para um crescimento de 7,2%, com SSS positivo. O e-commerce segue crescendo de forma consistente, absorvendo, em parte, o fluxo ainda comprometido nas lojas físicas. A expansão da Margem Bruta é outro ponto de destaque do trimestre, foram 2.0 p.p. de expansão, em um cenário de aumento significativo de custo de matéria- prima, com a categoria de joias figurando como grande destaque do período. Crescemos Margem Bruta em todas as categorias e canais, o que mostra a resiliência dos nossos produtos e a força do nosso modelo de negócio verticalizado, que nos permite gerir os custos de forma mais assertiva. Entregar Margem EBITDA Ajustada de 20,4% e Margem Líquida de 14,9%, em um trimestre ainda afetado pelas medidas de isolamento, realmente é um resultado a ser comemorado. Agora, estamos prestes a entrar na principal sazonalidade de vendas da Companhia e estamos bem posicionados para os desafios: nossa plataforma de e-commerce foi aprimorada; o app Vivara também recebeu melhorias; temos produtos muito competitivos em todas as categorias e uma estratégia bem estruturada para passar por mais esse período, ganhando market share e com a marca ainda mais fortalecida.  Seguimos focados nos projetos de longo prazo: em 2021, retomaremos para a expansão orgânica mais acelerada, com a perspectiva de adicionar entre 40 a 50 novas lojas, de Vivara e Life; o projeto de estruturação da marca Life, também voltou para o seu curso, com novas inciativas para aprimorar operação, treinamentos mais direcionados, estratégia renovada para produto e marketing, tudo está se desenvolvendo para alavancarmos a Life de forma estruturada. A estratégia omni também se torna foco estratégico para nós, investimos fortemente em projetos de renovação tecnológica que serão importantes para nos garantir bases sólidas para uma transformação digital.  Estamos felizes com o trabalho feito até aqui, mas sabemos que temos um longo caminho pela frente. A retomada definitiva virá e estamos bem posicionados para as oportunidades de consolidação e preparados para voltar ainda mais fortalecidos para reforçar nossa posição de liderança de mercado. 3 | VIVARA 2T20 | RELEASE DE RESULTADOS Marcio Kaufman CEO
  • 4. 56,9% 25,2% 14,5% 3,0% 0,3% Joias Life Relógios Acessórios Serviços Julho Agosto Setembro 2019 2020 RECEITA BRUTA (Liq. Dev.) +7,2% 4 | VIVARA 3T20 | RELEASE DE RESULTADOS +1,7% • A receita bruta, líquida de devoluções, ficou praticamente estável (-0,2%), no 3T20, com a performance de agosto e setembro compensando a queda de -10,3% ainda registrada em julho. As medidas adotadas para maximizar as vendas tanto do canal online, quanto das lojas físicas surtiram efeito e garantiram essa importante evolução ao longo do trimestre. Isso, combinado ao aumento da flexibilização das medidas de isolamento, foi fundamental para minimizar os efeitos da pandemia nas vendas da Companhia. O SSS (Same Store Sales) do período foi de -3,9%. A receita líquida do período atingiu R$ 242,6 milhões, +1,0% maior que o ano anterior e R$ 586,5 milhões, no acumulado, com retração de -23,2%. EVOLUÇÃO DAS VENDAS - MÊS A MÊS  A Companhia tem registrado importante evolução mês a mês, como resultado da maturação das iniciativas de maximização de vendas, e-commerce com crescimento acelerado de três dígitos e ampliação da flexibilização das medidas de isolamento nas principais praças, a partir do final de julho. 3T20 3T19 VENDA POR CATEGORIA  Quanto ao mix de vendas, o grande destaque do trimestre foi a categoria de joias, que ganhou 5,2 p.p. na comparação dos períodos. Esse desempenho da categoria é explicado pela adição de 23 novas lojas Vivara nos últimos 12 meses, pela maior participação de joias nas vendas do e-commerce, em razão das vendas diretas, bem como pelo aumento de preços mais relevante nessa categoria. -10,3% 214 Lojas Reabertas 261 Lojas Reabertas 262 Lojas Reabertas Receita por canal (R$ mil) 3T20 3T19 ∆ % 9M20 9M19 ∆ % Receita Bruta (Liq. de devoluções) 308.056 308.688 -0,2% 741.588 968.301 -23,4% Lojas Físicas 234.261 280.558 -16,5% 531.965 886.728 -40,0% E-commerce 70.619 25.016 182,3% 201.177 64.461 212,1% Outros 2.308 1.320 74,9% 5.740 12.048 -52,4% Deduções (65.430) (68.354) -4,3% (155.078) (204.219) -24,1% Receita Líquida 242.626 240.334 1,0% 586.510 764.082 -23,2% SSS (lojas físicas + e-commerce) -3,9% 8,5% na -24,2% 9,4% na 51,7% 27,9% 16,7% 3,1% 0,6%
  • 5. RECEITA BRUTA (Liq. Dev.) (cont.) 5 | VIVARA 3T20 | RELEASE DE RESULTADOS LOJAS FÍSICAS  Iniciamos o processo de reabertura gradual das lojas no final do mês de abril e encerramos o 3T20 com praticamente 100% do parque reaberto, com exceção da Loja no Terminal 3 do Aeroporto de Guarulhos que continua fechada. Ao final de julho, eram 214 lojas reabertas em agosto eram 261 e 262 ao final de setembro. No mês de Setembro, tivemos alguns recuos pontuais na dinâmica de flexibilização em praças do Paraná e interior de São Paulo. Ainda assim, registramos crescimento de 7,2% nas vendas consolidadas e decréscimo de -3,2% nas vendas de lojas físicas.  O SSS, considerando apenas lojas físicas, evoluiu de -100,0% em abril para -11,0%, em setembro, mesmo com restrição de operação e redução do horário de funcionamento em todas as praças. No 3T20, a receita das lojas físicas, recuou -16,5%, representando 76,0% das receitas totais. No 3T19, as lojas foram responsáveis por 90,9% da receita total.  É importante ainda ressaltar que essa evolução se dá mesmo em uma cenário de redução significativa no horário de funcionamento dos shoppings e ampla restrição no fluxo de clientes nas lojas. Além disso, as vendas do projeto Joias em Ação são registradas no faturamento do e- commerce, e no 3T20 atingiram R$ 25,2 milhões. Apenas de forma ilustrativa, considerando esse efeito, a vendas das lojas físicas já estariam com recuo de -7,5% em relação ao 3T19, sendo que em setembro já estariam com crescimento de +3,9%. Evolução mensal do desempenho das lojas 298 13.949 45.208 57.100 84.115 93.046 1,1% 23,9% 53,1% 65,7% 77,8% 82,3% Abril Maio Junho Julho Agosto Setembro Receita de lojas físicas %Lojas/Rec. Total 09 Lojas Reabertas 26 Lojas Reabertas 186 Lojas Reabertas 214 Lojas Abertas 261 Lojas Abertas 262 Lojas Abertas Mix de Vendas de Lojas Físicas 60,3% 23,5% 13,5% 2,7% 54,7% 27,0% 15,3% 3,0% Joias Life Relógios Acessório 3T20 3T19 -3,2% -12,5% -32,9% -63,7% -89,7% -99,7%
  • 6. RECEITA BRUTA (Liq. Dev.) (cont.) 6 | VIVARA 3T20 | RELEASE DE RESULTADOS E-COMMERCE  No 3T20 o e-commerce registrou +182,3% de crescimento, atingindo R$ 70,6 milhões de faturamento. Ao longo do trimestre, o canal perdeu participação nas vendas totais, saindo de 33,5% em julho para 16,4% em setembro, um movimento considerado natural, tendo em vista a normalização da operação de lojas e redução nas restrições de isolamento No 3T20, o e- commerce representou 22,9% das vendas totais, em comparação a 8,1% no 3T19. No acumulado em 9M20, o e-commerce atingiu R$ 201,2 milhões, +212,1% acima dos 9M19.  O projeto Joias em Ação, iniciado em abril, tem aumentado gradualmente sua relevância no desempenho do canal online, e mais importante que isso, tem sido uma importante ferramenta de melhoria de mix de vendas do canal, que, historicamente tem maior participação de Relógios e Life, que são itens de tickets mais baixos, se comparado à categoria de Joias. No 3T20, a iniciativa foi responsável por 35,6% das vendas do e-commerce. Evolução do Crescimento do E-commerce 94,6% 84,1% 74,7% 70,6% 64,5% 54,4% 5,4% 15,9% 25,3% 29,4% 35,5% 45,6% 213,9% 465,9% 510,5% 202,2% 195,8% 143,4% 98,2% 75,3% 45,6% 33,5% 21,3% 16,4% Abril Maio Junho Julho Agosto Setembro Vendas E-commerce % Participação Joias em ação %Participação na Venda Total Mix de Vendas do Canal Online (*) 48,1% 29,9% 17,8% 4,1% 28,9% 34,8% 32,0% 4,2% 3T20 3T19 (*) Inclui as vendas do Projeto Joias em Ação Mix de Vendas Joias em Ação 3T20 35,6% Das Vendas do e-commerce 70,3% 17,7% 9,4% 2,6% Joias Life Relógios Acessórios
  • 7. LUCRO BRUTO E MARGEM BRUTA  A Margem Bruta do período atingiu 69,8%, +2,0 p.p. superior à margem do mesmo período do ano anterior, mantendo os patamares saudáveis de rentabilidade da Companhia. O resultado registrado reflete a menor participação de relógio no mix total, bem como a adequada politica de precificação em todas as categorias.  O Lucro Bruto do período cresceu 3,8%, em razão do aumento da participação de joias, beneficiada pelas vendas do Joias em Ação. No acumulado, a Margem Bruta atingiu 68,1%, expansão de +2,3 p.p. em relação ao ano anterior. DESPESAS OPERACIONAIS  No 3T20, as Despesas Operacionais (SG&A) aumentaram 3,3%, principalmente pela (i) retomada gradual da operação de lojas; e (ii) estrutura administrativa mais robusta, a partir de outubro de 2019. Os efeitos citados em parte foram neutralizados pelas medidas de contenção e controle orçamentário adotadas pela Companhia desde o início da pandemia.  As Despesas com Vendas ficaram -0,4% menores no trimestre, principalmente (i) pela adesão à Lei 14.020/2020, que permitiu a suspensão dos contratos das colaboradoras de lojas, durante todo o período em que as lojas estiveram fechadas, e redução de jornada após reabertura, com efeitos gradativamente menores até dezembro/20; (ii) pelos descontos obtidos no aluguel das lojas, (iii) pela redução das Despesas com Serviços de Terceiros e melhoria nas taxas de cartões. A redução das despesas mencionadas acima foi mais que suficiente para compensar o aumento das Despesas com Frete, pela maior relevância da operação do e-commerce e aumento das Despesas de Marketing, pelo maior investimento em marketing digital. 7 | VIVARA 3T20 | RELEASE DE RESULTADOS (Cont.) Lucro Bruto (R$ mil) e Margem Bruta (%) 3T20 3T19 ∆ % 9M20 9M19 ∆ % Receita Líquida 242.626 240.334 1,0% 586.510 764.082 -23,2% Custo Total (73.339) (77.271) -5,1% (187.230) (261.202) -28,3% Aquisição de insumos, matérias-primas e produtos (67.171) (72.248) -7,0% (170.100) (246.541) -31,0% % Receita Líquida -27,7% -30,1% 2,4 p.p. -29,0% -32,3% 3,3 p.p. Despesas Fábrica (6.169) (5.024) 22,8% (17.129) (14.661) 16,8% % Receita Líquida -2,5% -2,1% (0,5 p.p.) -2,9% -1,9% (1,0 p.p.) Pessoal (4.942) (5.024) -1,6% (13.769) (14.661) -6,1% % Receita Líquida -2,0% -2,1% 0,1 p.p. -2,3% -1,9% (0,4 p.p.) Despesas gerais da fábrica (618) - na (1.597) - na % Receita Líquida -0,3% 0,0% (0,3 p.p.) -0,3% 0,0% (0,3 p.p.) Depreciação (609) - na (1.763) - na % Receita Líquida -0,3% 0,0% (0,3 p.p.) -0,3% 0,0% (0,3 p.p.) Lucro Bruto 169.287 163.063 3,8% 399.281 502.880 -20,6% Margem Bruta % 69,8% 67,8% 2,0 p.p. 68,1% 65,8% 2,3 p.p. Despesas Operacionais (R$ mil) 3T20 3T19 ∆ % 9M20 9M19 ∆ % Despesas Operacionais (103.691) (100.420) 3,3% (294.266) (324.527) -9,3% % Receita Líquida -42,7% -41,8% (1,0 p.p.) -50,2% -42,5% (7,7 p.p.) Depesas com Vendas (78.956) (79.293) -0,4% (209.687) (243.755) -14,0% % Receita Líquida -32,5% -33,0% 0,5 p.p. -35,8% -31,9% (3,9 p.p.) Despesas Gerais e Administrativas (24.736) (21.127) 17,1% (84.578) (80.772) 4,7% % Receita Líquida -10,2% -8,8% (1,4 p.p.) -14,4% -10,6% (3,8 p.p.) Outras Despesas (Receitas) Operacionais (2.621) 675 -488,4% 10.742 108.197 -90,1% Total de Despesas (106.313) (99.745) 6,6% (283.524) (216.330) 31,1%
  • 8. DESPESAS OPERACIONAIS (Cont.)  As Despesas Gerais e Administrativas apresentaram crescimento de 17,1%, principalmente, (i) pela maior estrutura administrativa, reflexo do reforço de áreas estratégicas da Companhia e beneficio gerado pela adesão à Lei 14.020/2020, efeito que deverá ser verificado até dezembro/20; (ii) aumento das Despesas com Serviços de Terceiros, em função dos projetos de aceleração digital, melhorias tecnológicas e consultorias diversas, necessárias para implantação da estratégia de longo prazo.  As despesas relacionadas, exclusivamente, ao enfrentamento da pandemia afetaram as Despesas com Vendas, Gerais e Administrativas em -R$ 1,2 milhão no 3T20.  As Outras Despesas (Receitas) Operacionais registraram -R$ 2,6 milhões no trimestre, principalmente pela adequação das provisões. 8 | VIVARA 3T20 | RELEASE DE RESULTADOS • Mesmo com a operação ainda impactada pelo fechamento das lojas, principalmente em julho, quando as vendas ainda recuaram -10,3%, a Companhia encerrou o trimestre com o EBITDA Ajustado de R$ 49,6 milhões, com Margem EBITDA Ajustada de 20,4%, como resultado da efetividade das iniciativas de maximização das vendas, da expansão da Margem Bruta e do rígido controle de gastos. • No acumulado, o EBITDA Ajustado atingiu R$ 78,9 milhões, com margem de 13,5%. EBITDA AJUSTADO E MARGEM EBITDA AJUSTADA (4) A parcela fixa das despesas de aluguel, aqui apresentadas, estão contabilizadas na Demonstração de Fluxo de Caixa, como “Arrendamento do Direito de Uso”, como efeito da adoção do IFRS16. Informações mais detalhadas a respeito da norma contábil podem ser encontradas na Nota Explicativa 24, das Demonstrações Contábeis da Companhia. LUCRO LÍQUIDO E MARGEM LÍQUIDA • A Companhia registrou Lucro Líquido de R$ 36,1 milhões no 3T20, em razão do desempenho operacional do período, pelo menor volume de correção monetária sobre o saldo de impostos a recuperar e imposto diferido. • Apresentamos Lucro Líquido Ajustado, para o desempenho acumulado nos 9M19, excluindo o efeito não recorrente, referente ao ganho total da ação de exclusão do ICMS da base de PIS/Cofins, no montante de R$ 116,1 milhões, reconhecido no 2T19. Reconciliação do EBITDA (R$ mil) 3T20 3T19 ∆ % 9M20 9M19 ∆ % Lucro Liquido 36.147 39.570 -8,7% 53.490 225.603 -76,3% (+) IR/CSLL (603) (269) 124,1% (11.984) 32.409 -137,0% (+) Resultado financeiro 12.390 13.034 -4,9% 32.621 (3.956) 924,6% (+) Depreciação e Amortização 15.649 10.982 42,5% 43.393 32.495 33,5% EBITDA Total 63.583 63.318 0,4% 117.520 286.550 -59,0% (-) Despesa de aluguel ( IFRS16) (4) (13.989) (9.743) 43,6% (38.570) (29.586) 30,4% (+) Efeitos não recorrentes - - na - (103.658) na EBITDA AJUSTADO 49.594 53.575 -7,4% 78.950 153.306 -48,5% Margem Ebitda Ajustada (%) 20,4% 22,3% (1,9 p.p.) 13,5% 20,1% (6,6 p.p.) Reconciliação do Lucro Líquido Ajustado (R$ mil) 3T20 3T19 ∆ % 9M20 9M19 ∆ % Lucro Líquido 36.147 39.570 -8,7% 53.490 225.603 -76,3% Margem Lìquida (%) 14,9% 16,5% (1,6 p.p.) 9,1% 29,5% (70,9 p.p.) Efeito Não Recorrente - - na - (116.123) na Lucro Líquido Ajustado 36.147 39.570 -8,7% 53.490 109.480 -51,1% Margem Líquida Ajustada (%) 14,9% 16,5% (1,6 p.p.) 9,1% 14,3% (5,2 p.p.)
  • 9. 9 | VIVARA 3T20 | RELEASE DE RESULTADOS ENDIVIDAMENTO  No 3T20, o índice de endividamento total da Companhia foi de -1,4x, como reflexo da geração de caixa operacional, bem como pelo alongamento da dívida e disciplina financeira que garantiu a preservação dos recursos no período. INVESTIMENTOS - CAPEX  Os investimentos no trimestre totalizaram R$ 11,4 milhões, -22,4% menor que os investimentos do mesmo período do ano anterior, principalmente, (i) pela revisão do plano de expansão para 2020, reduzindo a alocação de investimentos em novas lojas; (ii) maior volume de investimentos em sistemas e TI, principalmente, para projetos de renovação tecnológica, importantes para estruturar a estratégia de omnicanalidade.  No 3T20, a Companhia inaugurou cinco (05) novas operações, sendo 02 lojas Vivara, 02 loja Life e 01 quiosque e encerrou a atividade de um (01) quiosque Life, que foi convertido em loja, encerrando o período com 263 pontos de vendas, dos quais 207 são lojas Vivara, 11 lojas Life e 45 são quiosques. Investimentos (R$ mil) 3T20 3T19 ∆ % 9M20 9M19 ∆ % Capex Total 11.378 14.670 -22,4% 37.742 25.389 48,7% Novas lojas 2.314 6.451 -64,1% 21.182 9.545 121,9% Reformas e Manutenção 2.436 910 167,8% 6.698 3.633 84,4% Fábrica 966 3.053 -68,4% 2.219 4.346 -48,9% Sistemas/TI 5.662 3.185 77,8% 7.626 4.762 60,2% Outros 0 1.071 -100,0% 17 3.104 -99,4% CAPEX/Receita Líquida (%) 4,7% 6,1% (1,4 p.p.) 6,4% 3,3% 3,1 p.p. Dívida Líquida (R$ mil) 9M20 1S20 ∆ % 2019 ∆ % Empréstimos e financiamentos 330.019 320.500 3,0% 270.354 22,1% Caixa e Equivalentes de Caixa e Títulos e Valores Mobiliários 612.245 584.679 4,7% 435.844 40,5% Caixa Líquido (282.226) (264.179) -6,8% (165.490) -70,5% EBITDA Ajustado LTM (últimos 12 meses) 197.779 211.030 -6,3% 272.134 -27,3% Divida Líquida/Ebitda Ajustado 1,4x- 1,3x- na 0,6x- na
  • 10. 259 2632 2 1 -1 184 191 201 205 207 2 6 8 9 1154 56 50 45 45 3T19 4T19 1T20 2T20 3T20 Vivara Life Quiosque 10 | VIVARA 3T20 | RELEASE DE RESULTADOS  A Vivara gerou R$ 32,3 milhões de caixa no 3T20, -R$ 14,2 milhões inferior ao mesmo período do ano anterior, principalmente pela maior alocação de capital de giro pela retomada da operação das lojas.  Além dos ajustes de IR&CSLL e outros itens não caixa, ajustamos o Lucro Liquido ao pagamento dos alugueis, no montante de R$ 9,8 milhões, no 3T20 e R$ 9,7 milhões no 3T19, que após adoção do IFRS16, passaram a ser contabilizados na DFC como Atividade de Financiamento. GERAÇÃO DE CAIXA (5) Essa é uma medição gerencial, não contábil, elaborada pela Companhia, e não é parte integrante do escopo de trabalho da auditoria independente. EXPANSÃO 2T20 Novas Lojas Novas Lojas Novos Conversões/ 3T20 Vivara Life Quiosques Fechamentos EXPANSÃO 3T20 263259259253240 EVOLUÇÃO DA EXPANSÃO Sudeste 52% Sul 16% Norte 5% Nordeste 18% Centro-oeste 11% Distribuição por região Geração de Caixa (R$ mil) 3T20 3T19 ∆ % 9M20 9M19 ∆ % Lucro Liquido 36.147 39.570 -8,7% 53.490 225.607 -76,3% (+/-) IR/CSLL e Outros Ajustes 5.133 (7.803) 165,8% 12.848 (133.205) 109,6% Lucro Liquido Ajustado 41.280 31.767 29,9% 66.338 92.402 -28,2% Capital de Giro (8.992) 14.724 -161,1% 109.908 (53.539) 305,3% Contas a Receber (14.289) 38.733 -136,9% 199.515 28.477 600,6% Estoques (7.341) 1.172 -726,4% (18.694) (16.598) 12,6% Fornecedores (9.565) (8.762) 9,2% (27.382) (16.041) 70,7% Impostos a Recuperar 11.985 (108) 11238,5% 29.081 (11.413) 354,8% Obrigações Tributárias 8.125 (16.504) 149,2% (48.637) (30.294) 60,5% Outros ativos e passivos 2.093 192 992,3% (23.976) (7.669) 212,6% Caixa das Atividades Operacionais Gerencial 32.288 46.491 -30,6% 176.245 38.864 353,5% Capex (11.377) (14.670) -22,4% (37.742) (25.389) 48,7% Geração de Caixa Livre (5) 20.911 31.821 -34,3% 138.503 13.474 927,9%
  • 11. PERSPECTIVAS 11 | VIVARA 3T20 | RELEASE DE RESULTADOS  Tendência 4T20 – O ritmo de vendas verificado em outubro(*) mostra mais um movimento de aceleração. Em outubro, as vendas da Companhia cresceram 14,5%, em relação ao mesmo mês do ano anterior, reflexo da ampliação do horário de funcionamento dos shoppings e da flexibilização das medidas de isolamento social, que se intensificou nesse ultimo mês.  O último trimestre do ano é, sazonalmente, o trimestre mais representativo para os nossos resultados. Em 2019, o 4T19 representou 35% da Receita Bruta (Liq. de Devo.), 33% do EBITDA Ajustado e cerca de 40% do Lucro Liquido (ajustado pelos efeitos não recorrentes) do ano. Para 2020, em virtude dos efeitos da pandemia nos trimestres anteriores, essa representatividade tende a ser maior, para todos os indicadores, o que traz um desafio adicional para a operação. Estamos com todos os esforços direcionados para a operação de Black Friday e Natal, datas com bastante dependência de fluxo em lojas, para garantir correta execução operacional e composição adequada de estoques.  Custo de matéria prima – A Companhia segue focada nas iniciativas para neutralizar, mesmo que em parte, o efeito do aumento do preço do ouro e da prata, que se intensificou desde o início de 2020. Assim, como já registrado nos resultados do 3T20, a Companhia mantem a estratégia de repasse gradual de preço e desenvolvimento de produtos que combinem apelo comercial e preservação de rentabilidade.  Plano de expansão – Após revisão do plano de expansão para 2020, em razão das incertezas trazidas pela pandemia, a Companhia retoma os planos de aceleração a partir de 2021, planejando a abertura de 40 a 50 novas lojas, das marcas Vivara e Life. Para a estratégia de longo prazo, a Companhia mantém seu compromisso de ampliar sua presença nos principais shoppings do país, através da expansão orgânica dos seus canais. (1) Resultado gerencial não auditado de Outubro.
  • 12. DEMONSTRAÇÃO DO RESULTADO 12 | VIVARA 3T20 | RELEASE DE RESULTADOS * DRE (R$ mil) 3T20 3T19* ∆ % 9M20 9M19* ∆ % Receita Bruta de Vendas de Mercadorias 375.910 374.468 0,4% 893.313 1.183.099 -24,5% Receita Bruta de Serviços 868 1.794 -51,6% 2.706 5.065 -46,6% Deduções da Receita Bruta (65.430) (68.354) -4,3% (155.078) (204.219) -24,1% Trocas e devoluções (68.722) (67.575) 1,7% (154.431) (219.862) -29,8% Receita Líquida 242.626 240.334 1,0% 586.510 764.082 -23,2% (-) Custos dos Produtos Vendidos e serviços prestados (72.730) (77.271) -5,9% (185.466) (261.202) -29,0% (-) Depreciações e Amortizações (609) - na (1.763) - na (=) Lucro Bruto 169.287 163.063 3,8% 399.281 502.880 -20,6% (-) Despesas Operacionais (121.352) (110.727) 9,6% (325.153) (248.825) 30,7% Vendas (78.956) (79.293) -0,4% (209.687) (243.755) -14,0% Pessoal (35.478) (41.353) -14,2% (98.890) (119.141) -17,0% Aluguéis e condomínios (9.940) (11.526) -13,8% (26.435) (35.339) -25,2% Descontos sobre arrendamentos 4.207 - na 13.483 - na Frete (6.104) (5.639) 8,2% (18.247) (14.753) 23,7% Comissão sobre Cartões (4.470) (5.153) -13,3% (11.347) (17.082) -33,6% Serviços de Terceiros (2.261) (3.606) -37,3% (7.263) (7.901) -8,1% Despesas com Marketing (11.561) (6.781) 70,5% (37.081) (31.454) 17,9% Outras despesas com vendas (13.349) (5.235) 155,0% (23.908) (18.085) 32,2% Gerais e Administrativas (24.736) (21.127) 17,1% (84.578) (80.772) 4,7% Pessoal (10.817) (8.341) 29,7% (38.768) (36.441) 6,4% Aluguéis e condomínios (47) (301) -84,4% (504) (609) -17,3% Serviços de Terceiros (10.368) (9.298) 11,5% (31.191) (24.000) 30,0% Outras Despesas Gerais e Administrativas (3.503) (3.187) 9,9% (14.115) (19.723) -28,4% Depreciações e Amortizações (15.040) (10.982) 36,9% (41.630) (32.495) 28,1% Resultado de Equivalência Patrimonial - (68) 100,0% - (247) -100,0% Outros Despesas (Receitas) Operacionais (2.621) 743 -453,0% 10.742 108.444 -90,1% (=) Lucro (Prejuizo) Antes das Financeiras 47.934 52.335 -8,4% 74.128 254.055 -70,8% (=) Resultado Financeiro (12.390) (13.034) -4,9% (32.621) 3.956 -924,6% Receitas Financeiras Líquidas 5.684 6.210 -8,5% 19.118 60.029 -68,2% Despesas Financeiras Líquidas (18.075) (19.244) -6,1% (51.739) (56.073) -7,7% (=) Lucro Operacional 35.544 39.301 -9,6% 41.506 258.011 -83,9% Imposto de Renda e Contribuição Social 603 269 124,1% 11.984 (32.409) -137,0% (=) Lucro Líquido 36.147 39.570 -8,7% 53.490 225.603 -76,3% *A Vivara Particpações S.A. foi constituída em 23 de maio de 2019, desta forma, as informações dos nove meses de 2019, aqui apresentadas, são informações combinadas das subsidiarias, Tellerina e Conipa.
  • 13. BALANÇO PATRIMONIAL 13 | VIVARA 3T20 | RELEASE DE RESULTADOS Balanço Patrimonial (R$ mil) 9M20 2019 CIRCULANTE Caixa e equivalentes de caixa 519.414 435.844 Títulos e valores mobiliários 65.815 - Contas a receber 226.696 425.833 Contas a receber partes relacionadas - - Estoques 367.381 348.034 Impostos a recuperar 93.961 95.247 Despesas pagas antecipadamente e outros créditos 3.106 7.669 Instrumentos derivativos ativo 21.412 6.796 Total do ativo circulante 1.297.785 1.319.425 NÃO CIRCULANTE Títulos e valores mobiliários 27.016 - Depósitos judiciais 13.542 13.680 Imposto de renda e contribuição social diferidos 92.139 54.200 Instrumentos derivativos ativo - 2.715 Impostos a recuperar 132.062 168.344 Investimentos - - Imobilizado 334.211 311.620 Intangível 13.904 9.546 Total do ativo não circulante 612.873 560.104 ATIVO TOTAL 1.910.659 1.879.529 CIRCULANTE Fornecedores 9.039 36.421 Empréstimos e financiamentos 275.019 190.934 Partes relacionadas 22 88 Obrigações trabalhistas e previdenciárias 42.977 65.175 Obrigações tributárias 42.099 86.778 Parcelamento de tributos 353 457 Arrendamentos a pagar 21.226 14.856 Arrendamentos direito de uso a pagar 28.806 24.119 Juros sobre capital próprio a pagar 35.563 8.124 Outras obrigações 22.338 31.862 Total do passivo circulante 477.442 458.813 NÃO CIRCULANTE Obrigações trabalhistas e previdenciárias 6.954 9.193 Empréstimos e financiamentos 55.000 79.420 Parcelamento de tributos 1.622 1.865 Provisão para riscos cíveis, trabalhistas e tributários 17.195 15.234 Arrendamentos direito de uso a pagar 236.672 225.281 Total do passivo não circulante 317.442 330.992 PATRIMÔNIO LÍQUIDO Capital social 1.052.340 1.052.340 Reservas de lucros 9.945 37.384 Lucros acumulados 53.490 - Outras resultados abrangentes - - Total do patrimônio líquido 1.115.775 1.089.724 TOTAL DO PASSIVO E PATRIMÔNIO LÍQUIDO 1.910.659 1.879.529
  • 14. FLUXO DE CAIXA 14 | VIVARA 3T20 | RELEASE DE RESULTADOS *A Vivara Particpações S.A. foi constituída em 23 de maio de 2019, desta forma, as informações dos nove meses de 2019, aqui apresentadas, são informações combinadas das subsidiarias, Tellerina e Conipa. * Fluxo de Caixa (R$ mil) 3T20 3T19* ∆ % 9M20 9M19* ∆ % Lucro Líquido 36.147 39.570 -8,7% 53.490 225.607 -76,3% Ajustes do Lucro Líquido 22.698 20.607 10,1% 54.572 (62.998) 186,6% Lucro Líquido Ajustado 58.844 60.177 -2,2% 108.062 162.609 -33,5% Variação nos ativos e passivos operacionais: Contas a receber (14.289) 38.733 -136,9% 199.515 28.477 600,6% Estoques (7.341) 1.172 -726,4% (18.694) (16.598) -12,6% Fornecedores (9.565) (8.762) -9,2% (27.382) (16.041) -70,7% Impostos a Recuperar 11.985 (108) 11238,5% 29.081 (11.413) 354,8% Obrigações Tributárias 8.125 (16.504) 149,2% (48.637) (30.294) -60,5% Outros ativos e passivos 2.093 1.049 99,5% (23.976) (7.669) -212,6%- - Caixa das atividades operacionais 49.852 75.759 -34,2% 217.970 109.070 99,8% Imposto de Renda e Contribuição Social (5.636) (11.086) 49,2% (9.127) (26.195) 65,2% Juros pagos de emprestimos e financiamentos (2.147) (7.581) 71,7% (7.510) (14.425) 47,9% Juros pagos de arrendamentos de direito de uso (7.483) - na (16.548) - na- - Caixa liquido das atividades operacionais 34.587 57.091 -39,4% 184.785 68.450 170,0% Imobilizado (8.219) (11.933) 31,1% (33.716) (20.622) -63,5% Intangivel (3.158) (2.737) -15,4% (4.027) (4.767) 15,5% Outros (92.831) 2.430 -3919,5% (92.831) 1.645 na- - Caixa das atividades de Investimentos (104.208) (12.239) -751,4% (130.573) (23.744) -449,9% Dividendos e JCP - - - - (67.418) 100,0% Empréstimos e financiamentos 6.656 (14.551) 145,7% 16.285 57.542 -71,7% Arrendamento do Direito de Uso (2.299) (9.743) 76,4% (8.539) (29.586) 71,1% Outros - 1.282 -100,0% 21.612 2.605 729,5%- - Caixa das atividades de financiamento 4.356 (23.011) 118,9% 29.359 (36.857) 179,7%- - AUMENTO (REDUÇÃO) DE CAIXA E EQUIVALENTE DE CAIXA (65.264) 21.841 -398,8% 83.570 7.848 964,8%- - Saldo Inicial de caixa e equivalente de caixa 584.679 66.726 776,2% 435.844 84.781 414,1% Saldo final de caixa e equivalente de caixa 519.414 87.704 492,2% 519.414 87.704 492,2%
  • 15.  EBITDA Ajustado e Margem EBITDA Ajustada - O EBITDA (Earnings Before Interest, Taxes, Depreciation and Amortization) ou LAJIDA (Lucros Antes de Juros, Impostos, Depreciações e Amortizações) é uma medição não contábil divulgada pela Companhia em consonância com a Instrução CVM nº 527/12. A partir do cálculo acima, é realizado o ajuste para eliminação de efeitos não recorrentes no resultado e, para melhor comparabilidade, exclui-se também o efeito da adoção do CPC06/IFRS16, que entrou em vigor em 1 de janeiro de 2019, os ajustes geram o EBITDA Ajustado. Efeitos não recorrentes são caracterizados por efeitos pontuais que acontecem no resultado da Companhia. Por estes montantes não fazerem parte recorrente do resultado, a Companhia opta em realizar o ajuste para que no “EBITDA Ajustado” apareçam apenas números recorrentes. A Companhia utiliza o EBITDA Ajustado como medida de performance para efeito gerencial e para comparação com empresas similares.  Dívida Líquida - A Dívida Líquida aqui apresentada é resultante do somatório dos empréstimos de curto e longo prazos presentes no Passivo Circulante e no Passivo Não Circulante da Companhia subtraídos da soma de Caixa e Equivalentes de Caixa com Títulos e Valores Mobiliários presentes no Ativo Circulante e no Ativo Não Circulante da Companhia.  A Companhia entende que o Índice de Dívida Líquida/EBITDA Ajustado auxilia na avaliação da alavancagem e liquidez. O EBITDA Ajustado LTM é a somatória dos últimos 12 meses (Last Twelve Months EBITDA) e também representa uma alternativa da geração operacional de caixa.  O EBITDA Ajustado, a Dívida Líquida, o indicador Dívida Líquida/EBITDA Ajustado LTM e Geração de Caixa Operacional apresentadas neste documento não são medidas de lucro em conformidade com as práticas contábeis adotadas no Brasil e não representa os fluxos de caixa dos períodos apresentados e, portanto, não é uma medida alternativa aos resultados ou fluxos de caixa  Geração de Caixa Operacional aqui apresentada é uma medição gerencial, resultante do fluxo de caixa de atividades operacionais apresentados na Demonstração de Fluxo de Caixa (DFC), ajustada pelo “Arrendamento do direito de uso”, que a partir de adoção do CPC06/IFRS16 passou a ser contabilizado na DFC, como atividade de financiamento. As afirmações contidas neste documento relacionadas a perspectivas sobre os negócios, projeções sobre resultados operacionais e financeiros e aquelas relacionadas a perspectivas de crescimento da Vivara S.A. são meramente projeções e, como tais, são baseadas exclusivamente nas expectativas da Diretoria sobre o futuro dos negócios. Essas expectativas dependem, substancialmente, das condições de mercado, do desempenho da economia brasileira, do setor e dos mercados internacionais e, portanto, sujeitas à mudança sem aviso prévio. Todas as variações aqui apresentadas são calculadas com base nos números em milhares de reais, assim como os arredondamentos. O presente relatório de desempenho inclui dados contábeis e não contábeis tais como, operacionais, financeiros pro forma e projeções com base na expectativa da Administração da Companhia. Os dados não contábeis não foram objeto de revisão por parte dos auditores independentes da Companhia. RELAÇÕES COM INVESTIDORES Otavio Lyra – Diretor Financeiro e de Relações com Investidores Melina Rodrigues – Gerente de RI Andressa Nunes – Analista de RI E-mail: ri@vivara.com.br Tel.: 11 3896-2736 /11 3896-2721 MEDIÇÕES NÃO CONTÁBEIS AVISO LEGAL 15 | VIVARA 3T20 | RELEASE DE RESULTADOS
  • 16.
  • 17. Earnings Release Third Quarter of 2020 CONFERENCE CALL Friday, November 13, 2020 English Time: 8 a.m. (New York) Connection data https://choruscall.com.br/vivara/3q20.htm Portuguese Time: 10 a.m. (Brasília) Connection data https://choruscall.com.br/vivara/3t20.htm
  • 18. 3Q20 EARNINGS RELEASE Sao Paulo, November 12, 2020 – Vivara Participações S.A. (B3: VIVA3), Brazil’s largest jewelry chain, announces today its results for the 3rd quarter (3Q20) and the first 9 months (9M20) of 2020. Vivara Participações S.A. was founded on May 23, 2019 and, hence, for comparison purposes, information pertaining to the nine months of 2019 refers to the combined information of the businesses of the subsidiaries Tellerina and Conipa and the holding company Vivara S.A. Information related to the nine months of 2020 and the third quarter of 2019 and 2020 is consolidated in line with the Company's Financial Statements. HIGHLIGHTS OF THE PERIOD 3 4 5 1 2 • E-commerce maintained its accelerated growth, up 182.3% in the quarter, accounting for 22.9% of sales. Joias em Ação Project accounted for 35.6% of e-commerce sales. • Adjusted EBITDA(1) totaled R$49.6 million in 3Q20, with margin of 20.4%, benefited by the rebound in sales, strict cost control and protection of gross profitability. FINANCIAL HIGHLIGHTS (1) EBITDA (Earnings Before Interest, Taxes, Depreciation and Amortization)is a non-accounting measurement disclosed by the Company in compliance with CVM Instruction 527/12. Based on the above calculation, an adjustment is made to eliminate non-recurring effects on income, when applicable, as well as the recognition of lease expenses related to the fixed installment of store rents, which, since the adoption of CPC 06 / IFRS 16, ceased to be recorded as “rent expenses” in the Income Statement and are recognized as “Lease of Right-of-Use Assets” in the Statement of Cash Flow. As such, these adjustments result in the Adjusted EBITDA. (2) SSS (Same-Store Sales) considers gross revenue, net of returns, at stores in operation for 12 months, as well as revenues from e-commerce. (3) Net Income adjusted by the non-recurring effects, related to the amount recognized from the favorable outcome of the lawsuit to exclude ICMS from the PIS/Cofins calculation base in 9M19, as per the reconciliation shown on page 8. (4) Managerial, non-accounting measurement prepared by the Company, which is not in the scope of independent audit. 2 | VIVARA 3Q20 | EARNINGS RELEASE • Healthy inventory mix and appropriate pricing policy drove the 200bps expansion in Gross Margin, which reached 69.8% in the quarter. • Solid balance sheet with high liquidity, closing the quarter with cash of R$612.2 million and R$220.0 million in credit card receivables. 6 • Strong cash generation in the quarter of R$32.3 million. • Consolidated sales in the quarter returned to 2019 levels, totaling R$308.1 million. In September, growth was 7.2%. Main Key Ratios (R$, 000) 3Q20 3Q19 ∆ % 9M20 9M19 ∆ % Gross Revenue (net of return) 308,056 308,688 -0.2% 741,588 968,301 -23.4% Net Revenue 242,626 240,334 1.0% 586,510 764,082 -23.2% Gross Profit 169,287 163,063 3.8% 399,281 502,880 -20.6% Gross Margin (%) 69.8% 67.8% 200 bps 68.1% 65.8% 230 bps EBITDA 63,583 63,318 0.4% 117,520 286,550 -59.0% Ebitda Margin (%) 26.2% 26.3% -10 bps 20.0% 37.5% -1750 bps Adjusted EBITDA (1) 49,594 53,575 -7.4% 78,950 153,306 -48.5% Adjusted Ebitda Margin (%) 20.4% 22.3% -190 bps 13.5% 20.1% -660 bps Net Income 36,147 39,570 -8.7% 53,490 225,603 -76.3% Net Margin (%) 14.9% 16.5% -160 bps 9.1% 29.5% -2040 bps Adjusted Net Income(3) 36,147 39,570 -8.7% 53,490 109,480 -51.1% Adjusted Net Margin (*) (%) 14.9% 16.5% -160 bps 9.1% 14.3% -520 bps SSS (2) (physical stores + e-commerce) -3.9% 8.5% na -24.2% 9.4% na Operational Cash Generation(4) 32,288 46,491 -30.6% 176,245 38,864 353.5%
  • 19. ▪ The 3Q20 results have a special meaning for us at Vivara: first, because this quarter closes Vivara's first disclosure cycle as a listed company and then, because it is from this quarter that we started to observe clearer signs of our operations picking up after the most challenging period we have ever faced. ▪ The last 12 months were very busy for us: we emerged from being a closely held company to pursue more audacious dreams, seeking more professionalization and new growth avenues. Within a few months after our IPO preparations, we were entering a new, highly visible environment that we were not used to. We are very grateful to our shareholders who believed in Vivara’s plans and who have helped us to script this new chapter in our history. ▪ In the midst of it all, a pandemic struck and we were facing a scenario never seen before: yet another challenge to overcome. In this scenario, we saw that a solid business foundation makes all the difference and, in August, five months after the closure of stores, we started to see clearer signs of resumption, with sales returning to pre-pandemic levels. Month after month, we have seen the team constantly engaged in overcoming obstacles and exceeding expectations. ▪ In the third quarter, our revenue returned to the same level as in 2019, with September registering growth of 7.2%, matched by positive SSS. E-commerce continues to grow consistently, partially offsetting the still weak customer traffic at stores. The gross margin expansion of 200bps is another highlight of the quarter, in a scenario of significant increase in raw material costs, with the jewelry category standing out during the period. We grew gross margin across all categories and channels, which shows the resilience of our products and the strength of our verticalized business model, which enables us to manage costs more efficiently. Delivering Adjusted EBITDA Margin of 20.4% and Net Margin of 14.9% in a quarter still affected by physical distancing measures is indeed a result to be celebrated. We are now entering the Company's main sales season and are well positioned for the challenges: we improved our e-commerce platform and the Vivara app; we have highly competitive products in all categories and a well-defined strategy to pass through this period, gaining market share, with the brand even more strengthened. ▪ We remain focused on our long-term projects: in 2021, we will resume accelerated organic expansion and plan to open about 40 to 50 Vivara and Life stores; the project to structure the Life brand is already back on course, with new initiatives to streamline operations, more focused training and a revamped product and marketing strategy to leverage the Life brand in a more structured manner. The omnichannel strategy has also become our strategic focus - we invested heavily in technological renovation projects that will be important for laying the solid groundwork for our digital transformation. ▪ We are pleased with our efforts so far, but we know that we have a long way to go. Definitive resumption will indeed come along, and we are well positioned to seize opportunities for consolidation and are prepared to return even stronger to cement our market leadership. 3 | VIVARA 3Q20 | EARNINGS RELEASE Marcio Kaufman CEO MESSAGE FROM THE MANAGEMENT
  • 20. 56.9% 25.2% 14.5% 3.0% 0.3% GROSS REVENUE (Net of Returns) +7.2% 4 | VIVARA 3Q20 | EARNINGS RELEASE +1.7% • Gross revenue, net of returns, remained practically stable (-0.2%) in 3Q20, with the performance in August and September offsetting the -10.3% decline registered in July. The measures taken to maximize online, and store sales produced results and drove significant growth registered during the quarter. This, combined with the further relaxation of physical distancing measures, was essential to minimizing the effects of the pandemic on the Company's sales. SSS (Same Store Sales) in the period declined -3.9%. Net revenue in the quarter totaled R$242.6 million, up 1.0% from the previous year and R$586.5 million in 9M20, down -23.2%. SALES GROWTH - BY MONTH ▪ The Company has witnessed sales growth each month, driven by the maturation of initiatives to maximize sales, the triple-digit growth of e-commerce and the relaxation of physical distancing measures in key markets since late July. 3Q20 3Q19 SALES BY CATEGORY ▪ The biggest quarterly highlight in the sales mix was the jewelry category, which grew 520 bps between the periods. This performance was driven by the opening of 23 Vivara stores in the last 12 months, the higher share of jewelry in e-commerce sales, as a result of direct sales, as well as the sharper increase in prices in this category. -10.3% 214 stores reopened 261 stores reopened 262 stores reopened Revenue per chanel (R$, 000) 3Q20 3Q19 ∆ % 9M20 9M19 ∆ % Gross Revenue (net of return) 308,056 308,688 -0.2% 741,588 968,301 -23.4% Physical Stores 234,261 280,558 -16.5% 531,965 886,728 -40.0% E-commerce 70,619 25,016 182.3% 201,177 64,461 212.1% Others 2,308 1,320 74.9% 5,740 12,048 -52.4% Deductions (65,430) (68,354) -4.3% (155,078) (204,219) -24.1% Net Revenue 242,626 240,334 1.0% 586,510 764,082 -23.2% SSS (physical stores + e-commerce) -3.9% 8.5% na -24.2% 9.4% na July August September 2019 2020 51.7% 27.9% 16.7% 3.1% 0.6%
  • 21. GROSS REVENUE (Net of Returns) (contd) 5 | VIVARA 3Q20 | EARNINGS RELEASE PHYSICAL STORES ▪ We started to gradually reopen the stores in late April and ended 3Q20 with practically 100% of the store network reopened, except the store at Terminal 3 of the Guarulhos Airport, which remains closed. By the end of July, 214 stores had been reopened, followed by 261 in August and 262 in September. In September, a few cities in Paraná and in the interior region of São Paulo occasionally tightened the distancing measures. Nevertheless, consolidated sales grew 7.2% and physical store sales declined -3.2%. ▪ SSS, considering only physical stores, improved from -100.0% in April to -11.0% in September, despite the restrictions on operations and the reduced business hours in all markets. In 3Q20, revenue from physical stores declined -16.5%, representing 76.0% of total revenues. In 3Q19, stores accounted for 90.9% of total revenues. ▪ Note that this growth occurred despite a scenario marked by significant reduction in the business hours of shopping malls and broad restrictions on customer traffic at stores. Moreover, the sales of the Joias em Ação project are booked under e-commerce revenue, and totaled R$25.2 million in 3Q20. For illustrative purposes only, considering this effect, sales at physical stores would have decreased -7.5% from 3Q19, while in September they would have grown 3.9%. Monthly performance of stores 9 stores reopened 26 stores reopened 186 stores reopened 214 stores opened 261 stores opened 262 stores opened Sales Mix of Physical Stores 60.3% 23.5% 13.5% 2.7% 3Q20 3Q19 -3.2% -12.5% -32.9% -63.7% -89.7% -99.7% 298 13,949 45,208 57,100 84,115 93,046 1.1% 23.9% 53.1% 65.7% 77.8% 82.3% April May June July August September Physical Stores Sales Growth (2020vs2019) % Stores/Total Revenue 54.7% 27.0% 15.3% 3.0% Jewelry Life Watches Acessory
  • 22. GROSS REVENUE (Net of Returns) (contd) 6 | VIVARA 3Q20 | EARNINGS RELEASE E-COMMERCE ▪ In 3Q20, e-commerce revenue grew 182.3% to reach R$70.6 million. During the quarter, the channel lost its share of total sales, dropping from 33.5% in July to 16.4% in September, which is a natural trend considering the normalization of store operations and the relaxation of social distancing restrictions. In 3Q20, e-commerce represented 22.9% of total sales, compared to 8.1% in 3Q19. In 9M20, e-commerce came to R$201.2 million, up 212.1% from 9M19. ▪ Joias em Ação project, launched in April, has gradually expanded its significance in the online channel's performance and, more than that, has been an essential tool in balancing the channel's sales mix, which historically has had a higher share of Watches and Life products, which are lower ticket items than Jewelry products. In 3Q20, the initiative was responsible for 35.6% of e- commerce sales. E-commerce Growth Online Channel's Sales Mix (*) 48.1% 29.9% 17.8% 4.1% 28.9% 34.8% 32.0% 4.2% 3Q20 3Q19 (*) Includes sales of Joias em Ação Project Joias em Ação Sales Mix 3Q20 35.6% ofe-commerce sales 70.3% 17.7% 9.4% 2.6% 94.6% 84.1% 74.7% 70.6% 64.5% 54.4% 5.4% 15.9% 25.3% 29.4% 35.5% 45.6% 213.9% 465.9% 510.5% 202.2% 195.8% 143.4% 98.2% 75.3% 45.6% 33.5% 21.3% 16.4% April May June July August September Online sales growth (2020vs2019) % Share Joias em Ação % Share in Total Revenue
  • 23. GROSS PROFIT AND GROSS MARGIN ▪ Gross Margin in the period reached 69.8%, up 200bps from the same period last year, maintaining the Company's profitability levels healthy. This result reflects the lower share of watches in the total mix and the appropriate pricing policy in all categories. ▪ Gross Profit in the period increased 3.8% due to the higher share of Jewelry, driven by Joias em Ação sales. In 9M20, Gross Margin stood at 68.1%, up 230bps from the previous year. OPERATING EXPENSES ▪ In 3Q20, Operating Expenses (SG&A) increased 3.3%, mainly due to (i) the gradual resumption of operations at stores; and (ii) the more robust administrative structure since October 2019. These effects were partially neutralized by the cost cutting and budgetary control measures taken by the Company since the onset of the pandemic. ▪ Selling Expenses decreased -0.4% in the quarter, mainly due to (i) the adhesion to Federal Law 14,020/2020, which allowed the suspension of employment agreements of store employees when the stores remained closed and the reduction in working hours after they reopened, with gradually lower effects until December 2020; (ii) the discounts obtained in store rents; (iii) the reduction in Outsourced Services and better rates on cards. The above-mentioned reduction in expenses was more than sufficient to offset the increase in Freight, because the larger significance of the e-commerce operation, and the increase in Marketing Expenses due to higher investments in digital marketing. 7 | VIVARA 3Q20 | EARNINGS RELEASE (contd) Gross Profit (R$, 000) and Gross Margin (%) 3Q20 3Q19 Δ % 9M20 9M19 Δ % Net Revenue 242,626 240,334 1.0% 586,510 764,082 -23.2% Total costs (73,339) (77,271) -5.1% (187,230) (261,202) -28.3% Acquisition of input, raw materials and products (67,171) (72,248) -7.0% (170,100) (246,541) -31.0% % Net Revenue -27.7% -30.1% 240 bps -29.0% -32.3% 330 bps Factory Expenses (6,169) (5,024) 22.8% (17,129) (14,661) 16.8% % Net Revenue -2.5% -2.1% -50 bps -2.9% -1.9% -100 bps Personal (4,942) (5,024) -1.6% (13,769) (14,661) -6.1% % Net Revenue -2.0% -2.1% -10 bps -2.3% -1.9% -40 bps Factory expenses (freight, energy, water, telephone and rent) (618) - na (1,597) - na % Net Revenue -0.3% 0.0% -30 bps -0.3% 0.0% -30 bps Depreciation (609) - na (1,763) - na % Net Revenue -0.3% 0.0% -30 bps -0.3% 0.0% -30 bps Gross profit 169,287 163,063 3.8% 399,281 502,880 -20.6% Gross margin % 69.8% 67.8% 200 bps 68.1% 65.8% -230 bps Operating Expenses (R$, 000) 3Q20 3Q19 ∆ % 9M20 9M19 ∆ % Operating Expenses (103,691) (100,420) 3.3% (294,266) (324,527) -9.3% Operating Expenses/Net Revenue (%) -42.7% -41.8% -100 bps -50.2% -42.5% -770 bps Selling Expenses (78,956) (79,293) -0.4% (209,687) (243,755) -14.0% Selling Expenses/Net Revenue (%) -32.5% -33.0% 50 bps -35.8% -31.9% -390 bps General and Administrative Expenses (24,736) (21,127) 17.1% (84,578) (80,772) 4.7% General and Administrative Expenses/Net Revenue (%) -10.2% -8.8% -140 bps -14.4% -10.6% -380 bps Other Operating Expenses (2,621) 675 488.4% 10,742 108,197 90.1% Total Operating Expenses (106,313) (99,745) 6.6% (283,524) (216,330) 31.1%
  • 24. OPERATING EXPENSES (contd) ▪ General and Administrative Expenses increased 17.1%, mainly due to (i) the larger administrative structure, reflecting the strengthening of strategic areas, and the benefits obtained by adhering to Federal Law 14,020/2020, whose effects will be observed until December 2020; (ii) the increase in Outsourced Services, due to digital acceleration projects, technological improvements and miscellaneous consulting services, necessary for rolling out the long-term strategy. ▪ Expenses solely related to facing the pandemic affected Selling, General and Administrative Expenses by R$1.2 million in 3Q20. ▪ Other Operating Expenses (Income) reached -R$2.6 million in the quarter, mainly due to the adequacy in the provisions. 8 | VIVARA 3Q20 | EARNINGS RELEASE • Though operations were affected by store closures, especially in July, when sales declined -10.3%, the Company ended the quarter close with Adjusted EBITDA of R$49.6 million and Adjusted EBITDA Margin of 20.4%, thanks to the successful initiatives to maximize sales, and the expansion of Gross Margin, and costs control. • In 9M20, Adjusted EBITDA reached R$78.9 million, with margin of 13.5%. ADJUSTED EBITDA AND ADJUSTED EBITDA MARGIN (4) The fixed portion of rent expenses, shown here, is booked in the Statement of Cash Flows as "Lease of Right-of-Use Assets," due to the adoption of IFRS 16. More detailed information on the accounting standard is available in Note 24 to the Financial Statements of the Company. NET INCOME AND NET MARGIN • The Company registered Net Income of R$36.1 million in 3Q20, reflecting the operational performance during the period, as well as the lower inflation adjustment on recoverable taxes and deferred taxes. • We present Adjusted Net Income for 9M19, excluding the non-recurring effect of the favorable outcome of the lawsuit to exclude ICMS from the PIS/Cofins base, in the amount of R$116.1 million, recognized in 2Q19. EBITDA Reconciliation (R$, 000) 3Q20 3Q19 ∆ % 9M20 9M19 ∆ % Net Income 36,147 39,570 -8.7% 53,490 225,603 -76.3% (+) Income and Social Contribution Taxes (603) (269) 124.1% (11,984) 32,409 -137.0% (+) Financial Result 12,390 13,034 -4.9% 32,621 (3,956) 924.6% (+) Depreciation and Amortization 15,649 10,982 42.5% 43,393 32,495 33.5% Total EBITDA 63,583 63,318 0.4% 117,520 286,550 -59.0% (-) Rental expense (IFRS16) (4) (13,989) (9,743) -43.6% (38,570) (29,586) -30.4% (+) Non-recurring effect - - na - (103,658) na Adjusted EBITDA 49,594 53,575 -7.4% 78,950 153,306 -48.5% Adjusted EBITDA Margin (%) 20.4% 22.3% -190 bps 13.5% 20.1% -660 bps Reconciliation of Adjusted Net Income (R$, 000) 3Q20 3Q19 ∆ % 9M20 9M19 ∆ % Net Income 36,147 39,570 -8.7% 53,490 225,603 -76.3% Net Margin (%) 14.9% 16.5% -160 bps 9.1% 29.5% -7090 bps Non-recurring effect - - na - (116,123) na Adjusted Net Income 36,147 39,570 -8.7% 53,490 109,480 -51.1% Adjusted Net Margin (%) 14.9% 16.5% -160 bps 9.1% 14.3% -520 bps
  • 25. 9 | VIVARA 3Q20 | EARNINGS RELEASE DEBT ▪ In 3Q20, the Company's debt ratio stood at -1.4x, reflecting the operating cash generation, the lengthening of debt maturities and the financial discipline that ensured the preservation of funds during the period. CAPEX ▪ Capital expenditure totaled R$11.4 million in the quarter, down 22.4% from the same period last year, mainly due to (i) the revision of the expansion plan for 2020, reducing the allocation of investments in new stores; (ii) higher investments in systems and IT, especially for technological upgrade projects, which are important for rolling out the omnichannel strategy. ▪ In 3Q20, the Company inaugurated 5 new operations - 2 Vivara stores, 2 Life stores and 1 kiosk - and closed 1 Life kiosk, which was converted into a store, ending the period with 263 points of sale, which include 207 Vivara stores, 11 Life stores and 45 kiosks. Net Debt (R$, 000) 9M20 1H20 ∆ % 2019 ∆ % Borrowings and financings 330,019 320,500 3.0% 270,354 22.1% Cash and cash equivalents and Securities 612,245 584,679 4.7% 435,844 40.5% Net Debt (282,226) (264,179) -6.8% (165,490) -70.5% Adjusted EBITDA LTM (last twelve months) 197,779 211,030 -6.3% 272,134 -27.3% Net Debt/Adjusted Ebitda 1.4x- 1.3x- na 0.6x- na Investments (R$, 000) 3Q20 3Q19 ∆ % 9M20 9M19 ∆ % Total Capex 11,378 14,670 -22.4% 37,742 25,389 48.7% New Stores 2,314 6,451 -64.1% 21,182 9,545 121.9% Reforms and Maintenance 2,436 910 167.8% 6,698 3,633 84.4% Factory 966 3,053 -68.4% 2,219 4,346 -48.9% Systems/IT 5,662 3,185 77.8% 7,626 4,762 60.2% Others 0 1,071 -100.0% 17 3,104 -99.4% CAPEX/Net Revenue (%) 4.7% 6.1% -140 bps 6.4% 3.3% -310 bps
  • 26. 259 2632 2 1 -1 10 | VIVARA 3Q20 | EARNINGS RELEASE ▪ Vivara generated cash of R$32.3 million in 3Q20, R$14.2 million lower than in the same period last year, mainly due to the higher allocation of working capital with the resumption of store operations. ▪ Apart from the adjustments to income tax (IR) and social contribution (CSLL) and other non-cash items, we adjusted Net Income to rent payments in the amount of R$9.8 million in 3Q20 and R$9.7 million in 3Q19, which, after the adoption of IFRS 16, are being booked in the consolidated financial statements as Financing Activity. CASH GENERATION (4) This is a managerial, non-accounting measurement prepared by the Company, which is not in the scope of independent audit. EXPANSION 2Q20 New Stores New Stores New Conversions/ 3Q20 Vivara Life Kiosks Closures 3Q20 EXPANSION 263259259253240 EXPANSION Cash Flow (R$, 000) 3Q20 3Q19 ∆ % 9M20 9M19 ∆ % Net Income 36,147 39,570 -8.7% 53,490 225,607 -76.3% (+/-) Income and Social Contribution Taxes/Others 5,133 (7,803) 165.8% 12,848 (133,205) 109.6% Adjusted Net Income 41,280 31,767 29.9% 66,338 92,402 -28.2% Working Capital (8,992) 14,724 -161.1% 109,908 (53,539) 305.3% Trade receivables (14,289) 38,733 -136.9% 199,515 28,477 600.6% Inventories (7,341) 1,172 -726.4% (18,694) (16,598) 12.6% Trade payables (9,565) (8,762) 9.2% (27,382) (16,041) 70.7% Recoverable taxes 11,985 (108) 11238.5% 29,081 (11,413) 354.8% Taxes payable 8,125 (16,504) 149.2% (48,637) (30,294) 60.5% Other assets and liabilities 2,093 192 992.3% (23,976) (7,669) 212.6% Cash from Management Operating Activities 32,288 46,491 -30.6% 176,245 38,864 353.5% Capex (11,377) (14,670) -22.4% (37,742) (25,389) 48.7% Freee Cash Generation (5) 20,911 31,821 -34.3% 138,503 13,474 927.9% 184 191 201 205 207 2 6 8 9 1154 56 50 45 45 3Q19 4Q19 1Q20 2Q20 3Q20 Vivara Life Kioks Southeast 52% South 16% North 5% Northeast 18% Midwest 11% Distribution by region
  • 27. OUTLOOK 11 | VIVARA 3Q20 | EARNINGS RELEASE ▪ 4Q20 Trend – Pace of sales in October(*) shows acceleration for the sixth straight month since the pandemic broke out. In October, the Company's sales grew 14,5% in relation to the same month last year, reflecting the longer business hours at shopping malls and the relaxation of physical distancing measures, which intensified last month. ▪ The final quarter of the year is seasonally the most significant for our results. In 2019, the 4th quarter accounted for 35% of Gross Revenue, 33% of Adjusted EBITDA and around 40% of Net Income (adjusted for non- recurring effects) in the year. In 2020, due to the effects of the pandemic on previous quarter, this share should be higher in all indicators, which brings additional operational challenges. All our efforts are focused on Black Friday and Christmas, two dates that depend highly on customer traffic at stores, to ensure optimum operations and an adequate inventory composition. ▪ Raw material costs – The Company remains focused on initiatives to offset, even if partially, the effect of the sharp increase in gold and silver prices since the start of 2020. Hence, as already announced in the 3Q20 results, the Company maintains its strategy of gradually passing through the price increase and developing products that combine commercial appeal and profitability. ▪ Expansion plan: After revising the 2020 expansion plan in view of uncertainties brought on by the pandemic, the Company is resuming plans to accelerate growth in 2021 and is planning to open about 40 to 50, of Vivara and Life stores. For the long-term strategy, the Company maintains its commitment to expanding its presence in leading shopping malls across Brazil through organic expansion of its channels. (1) Unaudited managerial result in October.
  • 28. INCOME STATEMENT 12 | VIVARA 3Q20 | EARNINGS RELEASE * *Vivara Participações S.A. was founded on May 23, 2019, and hence information related to 9M19 refers to the combined information of the subsidiaries Tellerina and Conipa. Financial Statements (R$ ,000) 3Q20 3Q19* ∆ % 9M20 9M19* ∆ % Sales Gross Revenue 375,910 374,468 0.4% 893,313 1,183,099 -24.5% Service Gross Revenue 868 1,794 -51.6% 2,706 5,065 -46.6% Gross Revenue Deductions (65,430) (68,354) -4.3% (155,078) (204,219) -24.1% Exchange and Return (68,722) (67,575) 1.7% (154,431) (219,862) -29.8% Net Revenue 242,626 240,334 1.0% 586,510 764,082 -23.2% (-) Cost of Sold Goods (72,730) (77,271) -5.9% (185,466) (261,202) -29.0% (-) Depreciation and Amortization (609) - na (1,763) - na (=) Gross Profit 169,287 163,063 3.8% 399,281 502,880 -20.6% (-) Operating Expenses (121,352) (110,727) 9.6% (325,153) (248,825) 30.7% Sales (78,956) (79,293) -0.4% (209,687) (243,755) -14.0% Personal (35,478) (41,353) -14.2% (98,890) (119,141) -17.0% Rentals and common area maintenance fees (9,940) (11,526) -13.8% (26,435) (35,339) -25.2% Lease discounts 4,207 - na 13,483 - na Freight (6,104) (5,639) 8.2% (18,247) (14,753) 23.7% Commission on credit cards (4,470) (5,153) -13.3% (11,347) (17,082) -33.6% Outsourced services (2,261) (3,606) -37.3% (7,263) (7,901) -8.1% Marketing/selling expenses (11,561) (6,781) 70.5% (37,081) (31,454) 17.9% Other selling expenses (13,349) (5,235) 155.0% (23,908) (18,085) 32.2% General and Administratives (24,736) (21,127) 17.1% (84,578) (80,772) 4.7% Personal (10,817) (8,341) 29.7% (38,768) (36,441) 6.4% Rentals and common area maintenance fees (47) (301) -84.4% (504) (609) -17.3% Outsourced services (10,368) (9,298) 11.5% (31,191) (24,000) 30.0% Other General and Administratives expenses (3,503) (3,187) 9.9% (14,115) (19,723) -28.4% Depreciation and Amortization (15,040) (10,982) 36.9% (41,630) (32,495) 28.1% Share of profit (loss) of subsidiaries - (68) -100.0% - (247) -100.0% Other Operating Expenses (Revenues) (2,621) 743 -453.0% 10,742 108,444 -90.1% (=) Profit (Losses) Before Financial Results 47,934 52,335 -8.4% 74,128 254,055 -70.8% (=) Financial Result (12,390) (13,034) -4.9% (32,621) 3,956 -924.6% Financial Income (Expenses), net 5,684 6,210 -8.5% 19,118 60,029 -68.2% Finance costs, net (18,075) (19,244) -6.1% (51,739) (56,073) -7.7% (=) Operating Income 35,544 39,301 -9.6% 41,506 258,011 -83.9% Income and Social Contribution Taxes 603 269 124.1% 11,984 (32,409) -137.0% (=) Net Income 36,147 39,570 -8.7% 53,490 225,603 -76.3%
  • 29. BALANCE SHEET 13 | VIVARA 3Q20 | EARNINGS RELEASE Balance Sheet (R$, 000) 9M20 2019 CURRENT ASSETS Cash and cash equivalents 519,414 435,844 Securities 65,815 - Trade receivables 226,696 425,833 Due from related parties - - Inventories 367,381 348,034 Recoverable taxes 93,961 95,247 Prepaid expenses and other receivables 3,106 7,669 Derivatives 21,412 6,796 Total current assets 1,297,785 1,319,425 NONCURRENT ASSETS Securities 27,016 - Escrow deposits 13,542 13,680 Deferred income tax and social contribution 92,139 54,200 Derivatives - 2,715 Recoverable taxes 132,062 168,344 Investments - - Property, plant and equipment 334,211 311,620 Intangible assets 13,904 9,546 Total noncurrent assets 612,873 560,104 TOTAL ASSETS 1,910,659 1,879,529 CIRCULANTE Trade payables 9,039 36,421 Borrowings and financing 275,019 190,934 Due to related parties 22 88 Payroll and related taxes 42,977 65,175 Taxes payable 42,099 86,778 Taxes in installments 353 457 Leases payable 21,226 14,856 Leasing liabilities 28,806 24,119 Interest on capital 35,563 8,124 Other payables 22,338 31,862 Total current liabilities 477,442 458,813 NONCURRENT LIABILITIES Labor and social security obligations 6,954 9,193 Borrowings and financing 55,000 79,420 Taxes in installments 1,622 1,865 Provision for civil, labor and tax risks 17,195 15,234 Leasing liabilities 236,672 225,281 Total noncurrent liabilities 317,442 330,992 EQUITY Capital 1,052,340 1,052,340 Legal reserve 9,945 37,384 Earnings reserves 53,490 - Retained earnings (accumulated losses) - - Total equity 1,115,775 1,089,724 TOTAL LIABILITIES AND EQUITY 1,910,659 1,879,529
  • 30. CASH FLOW 14 | VIVARA 3Q20 | EARNINGS RELEASE *Vivara Participações S.A. was founded on May 23, 2019, and hence information related to 9M19 refers to the combined information of the subsidiaries Tellerina and Conipa. * Cash Flow (R$ ,000) 3Q20 3Q19 ∆ % 9M20 9M19* ∆ % Net Income 36,147 39,570 -8.7% 53,490 225,607 -76.3% Adjust of Net Income 22,698 20,607 10.1% 54,572 (62,998) 186.6% Adjusted profit for the year 58,844 60,177 -2.2% 108,062 162,609 -33.5% Increase (decrease) in operating assets and liabilities: Trade receivables (14,289) 38,733 -136.9% 199,515 28,477 600.6% Inventories (7,341) 1,172 -726.4% (18,694) (16,598) -12.6% Trade payables (9,565) (8,762) -9.2% (27,382) (16,041) -70.7% Recoverable taxes 11,985 (108) 11238.5% 29,081 (11,413) 354.8% Taxes payable 8,125 (16,504) 149.2% (48,637) (30,294) -60.5% Other assets and liabilities 2,093 1,049 99.5% (23,976) (7,669) -212.6%- - - - Cash provided by operating activities 49,852 75,759 -34.2% 217,970 109,070 99.8% Income tax and social contribution paid (5,636) (11,086) 49.2% (9,127) (26,195) 65.2% Paid interest on borrowing and financing (2,147) (7,581) 71.7% (7,510) (14,425) 47.9% Interest paid on leasing liabilities (7,483) - na (16,548) - na- - - - Net cash provided by operating activities 34,587 57,091 -39.4% 184,785 68,450 170.0% Property, plant and equipment (8,219) (11,933) 31.1% (33,716) (20,622) -63.5% Intangible assets (3,158) (2,737) -15.4% (4,027) (4,767) 15.5% Others (92,831) 2,430 na (92,831) 1,645 na- - - - Cash Flow from Investments (104,208) (12,239) -751.4% (130,573) (23,744) -449.9% Interest on capital / Dividends paid - - - - (67,418) 100.0% Borrowings and financings 6,656 (14,551) 145.7% 16,285 57,542 -71.7% Righ-of-use leases (2,299) (9,743) 76.4% (8,539) (29,586) 71.1% Others - 1,282 na 21,612 2,605 729.5%3,630,176 -100.0% - - - Cash flow from financing activities 4,356 (23,011) 118.9% 29,359 (36,857) 179.7% INCREASE (DECREASE) IN CASH AND CASH EQUIV. (65,264) 21,841 -398.8% 83,570 7,848 964.8%- Opening balance of cash and cash equivalents 584,679 66,726 776.2% 435,844 84,781 414.1% Closing balance of cash and cash equivalents 519,414 87,704 492.2% 519,414 87,704 492.2%
  • 31. ▪ Adjusted EBITDA and Adjusted EBITDA Margin - Earnings Before Interest, Taxes, Depreciation and Amortization (EBITDA) is a non-accounting measurement disclosed by the Company in compliance with CVM Instruction 527/12. The above calculation is adjusted to eliminate non- recurring effects from the result and, for better comparison, the effects of the adoption of CPC 06/IFRS 16, which came into effect on January 1, 2019, are excluded as well, which result in Adjusted EBITDA. Non-recurring effects are characterized by one-time effects on the Company's result. Since these amounts are not a recurrent portion of the result, the Company chooses to make the adjustment so that Adjusted EBITDA considers only recurring numbers. The Company uses Adjusted EBITDA as a measure of performance for managerial effect and for comparison with peers. ▪ Net Debt - The Net Debt shown here is the result of the sum of short- and long-term loans in Current Liabilities and Non-Current Liabilities of the Company, deducted from the sum of Cash and Cash Equivalents and Securities under the Current Assets and Non-Current Assets of the Company. ▪ The Company believes that the Net Debt/Adjusted EBITDA ratio helps in assessing its leverage and liquidity. LTM Adjusted EBITDA is the sum of Last Twelve Months EBITDA and is also an alternative to operational cash generation. ▪ Adjusted EBITDA, Net Debt, Net Debt/LTM Adjusted EBITDA and Operational Cash Generation presented in this release are not profitability measures as per the accounting practices adopted in Brazil and do not represent the cash flow during the periods and, hence, must not be considered as alternative measures to results or cash flows ▪ Operating Cash Generation shown here is a managerial measurement, resulting from the cash flow from operating activities presented in the Statement of Cash Flow (adjusted by “Lease of Right-of-Use Assets,” which, after the adoption of CPC 06 / IFRS 16, is being booked in the Statement of Cash Flow as financing activity. The statements contained in this release related to the business outlook, operating and financial projections and growth prospects of Vivara S.A. are merely projections and as such are based exclusively on the expectations of the Company’s management concerning the future of the business. Such forward-looking statements depend substantially on changes in market conditions, the performance of the Brazilian economy, the industry and international markets and are, therefore, subject to change without prior notice. All variations presented herein are calculated based on numbers in thousands of reais, as well as rounded figures. This report includes accounting and non-accounting data, such as pro forma operating and financial information and projections based on expectations of the Company's Management. Note that the non- accounting figures have not been reviewed by the Company’s independent auditors. INVESTOR RELATIONS Otavio Lyra – CFO and Investor Relations Officer Melina Rodrigues – IR Manager Andressa Nunes – IR Analyst E-mail: ri@vivara.com.br Phone: 11 3896-2736 /11 3896-2721 NON-ACCOUNTING MEASURES DISCLAIMER 15 | VIVARA 3Q20 | EARNINGS RELEASE