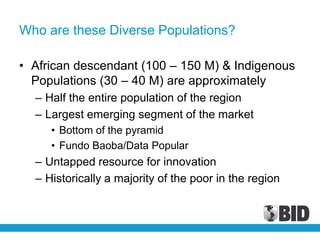
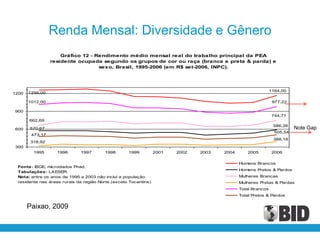
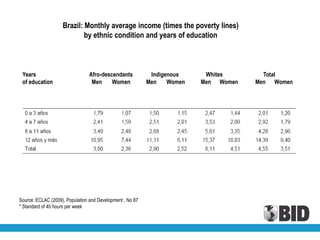
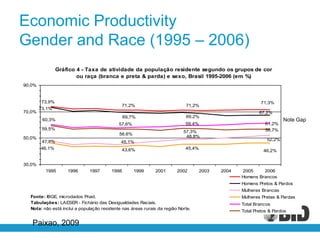
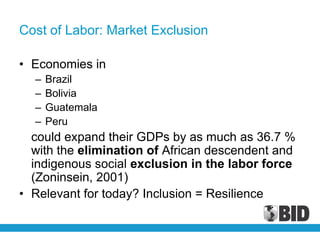
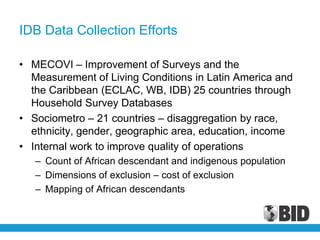
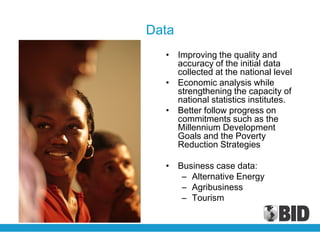
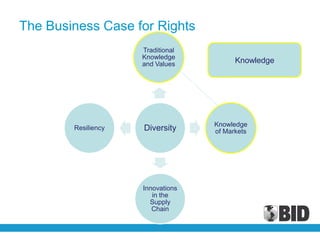
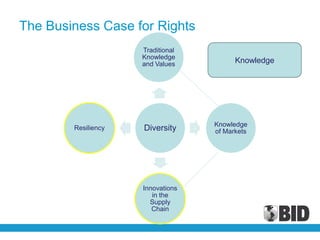
Desemprego,
trabalho decente,
migrações e direitos
humanos

Judith Morrison
Assessora Principal
Divisão de Gênero e Diversidade
Business Development:
Human Rights

• Ethos = Dynamism and Creativity
• Rights
  – Do no Harm
  – Protection/Safeguards
  – Eliminate the worst best practices
• Ethos Members have a Higher Standard
  – Business leaders and examples
  – Innovators
  – CSR –beyond corporate philanthropy
The Business Case for Rights
                     Traditional
                     Knowledge
                     and Values          Knowledge


                                   Knowledge
        Resiliency   Diversity     of Markets


                     Innovations
                        in the
                       Supply
                        Chain
Who are these Diverse Populations?

• African descendant (100 – 150 M) & Indigenous
  Populations (30 – 40 M) are approximately
  – Half the entire population of the region
  – Largest emerging segment of the market
     • Bottom of the pyramid
     • Fundo Baoba/Data Popular
  – Untapped resource for innovation
  – Historically a majority of the poor in the region
Renda Mensal: Diversidade e Gênero
                     Gráfico 12 - Rendimento médio mensal real do trabalho principal da PEA
                 residente ocupada segundo os grupos de cor ou raça (branca e preta & parda) e
                                   sexo, Brasil, 1995-2006 (em R$ set-2006, INPC).


                                                                                                             1164,00
1200   1256,00

       1012,00                                                                                                977,22

900
                                                                                                              744,71
       662,69
                                                                                                              586,26
600    570,67                                                                                                           Note Gap
                                                                                                               505,54
        473,17
                                                                                                              388,18
        318,92
300
         1995      1996      1997       1998       1999          2001   2002   2003   2004       2005         2006

                                                                                             Homens Brancos
 Fonte : IBGE, microdados Pnad.
                                                                                             Homens Pretos & Pardos
 Tabulaçõe s : LAESER.
 Nota: entre os anos de 1995 a 2003 não inclui a população                                   Mulheres Brancas
 residente nas áreas rurais da região Norte (exceto Tocantins)                               Mulheres Pretas & Pardas
                                                                                             Total Brancos
                                                                                             Total Pretos & Pardos


       Paixao, 2009
Brazil: Monthly average income (times the poverty lines)
                            by ethnic condition and years of education


 Years                          Afro-descendants            Indigenous     Whites       Total
 of education                    Men     Women             Men    Women   Men Women   Men Women


Source: ECLAC (2009), Population and Development , No 87
* Standard of 40 hours per week
Economic Productivity
Gender and Race (1995 – 2006)
                 Gráfico 4 - Taxa de atividade da população residente segundo os grupos de cor
                         ou raça (branca e preta & parda) e sexo, Brasil 1995-2006 (em %)
90,0%


        73,9%                                                                                              71,3%
                                             71,2%                          71,2%
        73,1%
70,0%                                                                                                     67,2%
                                               69,7%                        69,2%
         60,3%                                                                                                       Note Gap
                                            57,6%                           59,4%                            61,2%
         59,5%                                                                                               56,7%
                                                                           57,3%
                                            56,6%
50,0%                                                                       48,8%
         47,8%                                                                                               52,2%
                                             45,1%
        46,1%                                43,6%                          45,4%
                                                                                                            46,2%


30,0%
          1995       1996     1997      1998        1999      2001      2002        2003   2004   2005     2006
                                                                                                  Homens Brancos
                                                                                                  Homens Pretos & Pardos
                                                                                                  Mulheres Brancas
  Fonte: IBGE, microdados Pnad.                                                                   Mulheres Pretas & Pardas
  Tabulações: LAESER - Fichário das Desigualdades Raciais.                                        Total Brancos
  Nota: não está inclui a população residente nas áreas rurais da região Norte.
                                                                                                  Total Pretos & Pardos

   Paixao, 2009
Cost of Labor: Market Exclusion

• Economies in
  –   Brazil
  –   Bolivia
  –   Guatemala
  –   Peru
  could expand their GDPs by as much as 36.7 %
  with the elimination of African descendent and
  indigenous social exclusion in the labor force
  (Zoninsein, 2001)
• Relevant for today? Inclusion = Resilience
IDB Data Collection Efforts

• MECOVI – Improvement of Surveys and the
  Measurement of Living Conditions in Latin America and
  the Caribbean (ECLAC, WB, IDB) 25 countries through
  Household Survey Databases
• Sociometro – 21 countries – disaggregation by race,
  ethnicity, gender, geographic area, education, income
• Internal work to improve quality of operations
   – Count of African descendant and indigenous population
   – Dimensions of exclusion – cost of exclusion
   – Mapping of African descendants
Data
  • Improving the quality and
    accuracy of the initial data
    collected at the national level
  • Economic analysis while
    strengthening the capacity of
    national statistics institutes.
  • Better follow progress on
    commitments such as the
    Millennium Development
    Goals and the Poverty
    Reduction Strategies

  • Business case data:
     – Alternative Energy
     – Agribusiness
     – Tourism
The Business Case for Rights
                     Traditional
                     Knowledge
                     and Values          Knowledge


                                   Knowledge
        Resiliency   Diversity     of Markets


                     Innovations
                        in the
                       Supply
                        Chain
Role of Traditional Knowledge

• Traditional understanding of biodiversity
• Quantifying the importance of biodiversity
• Understanding the relationship of systems
  – Cosmovision to interpret climate change impacts
  – Valuing and protecting traditional knowledge
     • Andenes – terracing
     • Crop rotation
     • Planting cycles based on natural signs
Role of Market Knowledge

• Need to access new markets
  – The old
     • Mais de sete milhões de afro-brasileiros estão na
       classe média alta brasileira e que, em 1998, eles
       gastaram 44 bilhões de dólares em produtos e
       serviços no país.
     • Ethos em 2003, menos de 5% dos executivos das
       500 maiores empresas brasileiras são pessoas de
       cor, e desse grupo somente 1,8% são afro-
       brasileiros, 42% não tem gerentes negros
Role of Market Knowledge

• Need to access new markets
  – The new
     • A população afro-brasileira moveu $673 bilhões
       em produtos e serviços no país em 2011
     • 584 bilhões (2009)
     • 370 bilhões (2004)
     • 45% clase C, 44% clase D, 7% clase E
     • 10% de crescimento/mudança.
The Business Case for Rights
                     Traditional
                     Knowledge
                     and Values          Knowledge


                                   Knowledge
        Resiliency   Diversity     of Markets


                     Innovations
                        in the
                       Supply
                        Chain
Resiliency and Supply Chain

Resiliency
• Proven for gender
• Role of real diversity
   – Expressing opinions
Supply Chain
• POEMA/POEMAR – Mercedes-Benz
• Consumer products
• Brazil is the REFERENCE
Recomendações

Quem somos?
• Intermediação dos trabalhos
• Requisitos do trabalho – capacidades não somente
  skills adquiridos
• Massa critica
• Oportunidades para promover pessoas com talento
Analisar os fornecedores os stakeholders locais
• Possibilidades para diversificar para compartilhar
  risks
• Valores/ Benefícios compartilhados
Judith Morrison

Judith Morrison

  • 1.
    Desemprego, trabalho decente, migrações edireitos humanos Judith Morrison Assessora Principal Divisão de Gênero e Diversidade
  • 2.
    Business Development: Human Rights •Ethos = Dynamism and Creativity • Rights – Do no Harm – Protection/Safeguards – Eliminate the worst best practices • Ethos Members have a Higher Standard – Business leaders and examples – Innovators – CSR –beyond corporate philanthropy
  • 3.
    The Business Casefor Rights Traditional Knowledge and Values Knowledge Knowledge Resiliency Diversity of Markets Innovations in the Supply Chain
  • 4.
    Who are theseDiverse Populations? • African descendant (100 – 150 M) & Indigenous Populations (30 – 40 M) are approximately – Half the entire population of the region – Largest emerging segment of the market • Bottom of the pyramid • Fundo Baoba/Data Popular – Untapped resource for innovation – Historically a majority of the poor in the region
  • 5.
    Renda Mensal: Diversidadee Gênero Gráfico 12 - Rendimento médio mensal real do trabalho principal da PEA residente ocupada segundo os grupos de cor ou raça (branca e preta & parda) e sexo, Brasil, 1995-2006 (em R$ set-2006, INPC). 1164,00 1200 1256,00 1012,00 977,22 900 744,71 662,69 586,26 600 570,67 Note Gap 505,54 473,17 388,18 318,92 300 1995 1996 1997 1998 1999 2001 2002 2003 2004 2005 2006 Homens Brancos Fonte : IBGE, microdados Pnad. Homens Pretos & Pardos Tabulaçõe s : LAESER. Nota: entre os anos de 1995 a 2003 não inclui a população Mulheres Brancas residente nas áreas rurais da região Norte (exceto Tocantins) Mulheres Pretas & Pardas Total Brancos Total Pretos & Pardos Paixao, 2009
  • 6.
    Brazil: Monthly averageincome (times the poverty lines) by ethnic condition and years of education Years Afro-descendants Indigenous Whites Total of education Men Women Men Women Men Women Men Women Source: ECLAC (2009), Population and Development , No 87 * Standard of 40 hours per week
  • 7.
    Economic Productivity Gender andRace (1995 – 2006) Gráfico 4 - Taxa de atividade da população residente segundo os grupos de cor ou raça (branca e preta & parda) e sexo, Brasil 1995-2006 (em %) 90,0% 73,9% 71,3% 71,2% 71,2% 73,1% 70,0% 67,2% 69,7% 69,2% 60,3% Note Gap 57,6% 59,4% 61,2% 59,5% 56,7% 57,3% 56,6% 50,0% 48,8% 47,8% 52,2% 45,1% 46,1% 43,6% 45,4% 46,2% 30,0% 1995 1996 1997 1998 1999 2001 2002 2003 2004 2005 2006 Homens Brancos Homens Pretos & Pardos Mulheres Brancas Fonte: IBGE, microdados Pnad. Mulheres Pretas & Pardas Tabulações: LAESER - Fichário das Desigualdades Raciais. Total Brancos Nota: não está inclui a população residente nas áreas rurais da região Norte. Total Pretos & Pardos Paixao, 2009
  • 8.
    Cost of Labor:Market Exclusion • Economies in – Brazil – Bolivia – Guatemala – Peru could expand their GDPs by as much as 36.7 % with the elimination of African descendent and indigenous social exclusion in the labor force (Zoninsein, 2001) • Relevant for today? Inclusion = Resilience
  • 9.
    IDB Data CollectionEfforts • MECOVI – Improvement of Surveys and the Measurement of Living Conditions in Latin America and the Caribbean (ECLAC, WB, IDB) 25 countries through Household Survey Databases • Sociometro – 21 countries – disaggregation by race, ethnicity, gender, geographic area, education, income • Internal work to improve quality of operations – Count of African descendant and indigenous population – Dimensions of exclusion – cost of exclusion – Mapping of African descendants
  • 10.
    Data •Improving the quality and accuracy of the initial data collected at the national level • Economic analysis while strengthening the capacity of national statistics institutes. • Better follow progress on commitments such as the Millennium Development Goals and the Poverty Reduction Strategies • Business case data: – Alternative Energy – Agribusiness – Tourism
  • 11.
    The Business Casefor Rights Traditional Knowledge and Values Knowledge Knowledge Resiliency Diversity of Markets Innovations in the Supply Chain
  • 12.
    Role of TraditionalKnowledge • Traditional understanding of biodiversity • Quantifying the importance of biodiversity • Understanding the relationship of systems – Cosmovision to interpret climate change impacts – Valuing and protecting traditional knowledge • Andenes – terracing • Crop rotation • Planting cycles based on natural signs
  • 13.
    Role of MarketKnowledge • Need to access new markets – The old • Mais de sete milhões de afro-brasileiros estão na classe média alta brasileira e que, em 1998, eles gastaram 44 bilhões de dólares em produtos e serviços no país. • Ethos em 2003, menos de 5% dos executivos das 500 maiores empresas brasileiras são pessoas de cor, e desse grupo somente 1,8% são afro- brasileiros, 42% não tem gerentes negros
  • 14.
    Role of MarketKnowledge • Need to access new markets – The new • A população afro-brasileira moveu $673 bilhões em produtos e serviços no país em 2011 • 584 bilhões (2009) • 370 bilhões (2004) • 45% clase C, 44% clase D, 7% clase E • 10% de crescimento/mudança.
  • 15.
    The Business Casefor Rights Traditional Knowledge and Values Knowledge Knowledge Resiliency Diversity of Markets Innovations in the Supply Chain
  • 16.
    Resiliency and SupplyChain Resiliency • Proven for gender • Role of real diversity – Expressing opinions Supply Chain • POEMA/POEMAR – Mercedes-Benz • Consumer products • Brazil is the REFERENCE
  • 17.
    Recomendações Quem somos? • Intermediaçãodos trabalhos • Requisitos do trabalho – capacidades não somente skills adquiridos • Massa critica • Oportunidades para promover pessoas com talento Analisar os fornecedores os stakeholders locais • Possibilidades para diversificar para compartilhar risks • Valores/ Benefícios compartilhados