100 Indicadores em Segurança do Doente

A newsletter da Beckers Clinical Quality & Infection Control de Setembro de 2013, apresenta uma extraordinária lista com 100 indicadores em Segurança do Doente que vale a pena conhecer. “Para os hospitais, os dados de benchmarking podem ser extremamente valiosos. Estes dados permitem a instituições individuais identificar áreas de excelência e avaliar oportunidades de melhoria, podendo resultar em último caso em intervenções mais eficientes e melhores cuidados. Esta revisão efetuada pela Becker’s Hospital compilou uma lista de 100 indicadores em segurança do Doente de várias fontes para comparação pelos hospitais.” (Vol. 2013 Nº3) Embora a comparação com estes indicadores não possa ser efetuada de forma direta pelos hospitais portugueses, dadas as diferenças evidentes com os seus congéneres norte-americanos, a disponibilização e conhecimento destes indicadores permite uma reflexão sobre o nível de cuidados alcançado nos estados unidos.

Recomendados
Recomendados
Mais conteúdo relacionado
Destaque
Destaque (9)
Semelhante a 100 Indicadores em Segurança do Doente
Semelhante a 100 Indicadores em Segurança do Doente (20)
Mais de Fernando Barroso
Mais de Fernando Barroso (20)
Último
Último (20)
100 Indicadores em Segurança do Doente
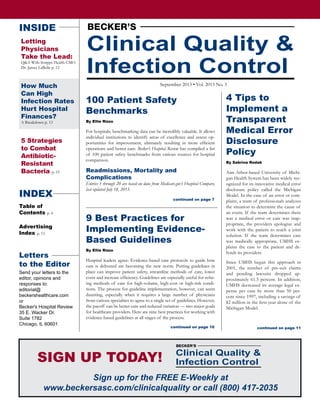
- 1. Clinical Quality & Infection Control September 2013 • Vol. 2013 No. 3 INSIDE Letting Physicians Take the Lead: Q&A With Scripps Health CMO Dr. James LaBelle p. 12 How Much Can High Infection Rates Hurt Hospital Finances? A Breakdown p. 13 5 Strategies to Combat Antibiotic- Resistant Bacteria p. 15 INDEX Table of Contents p. 6 Advertising Index p. 15 9 Best Practices for Implementing Evidence- Based Guidelines By Ellie Rizzo Hospital leaders agree: Evidence-based care protocols to guide how care is delivered are becoming the new norm. Putting guidelines in place can improve patient safety, streamline methods of care, lower costs and increase efficiency. Guidelines are especially useful for refin- ing methods of care for high-volume, high-cost or high-risk condi- tions. The process for guideline implementation, however, can seem daunting, especially when it requires a large number of physicians from various specialties to agree to a single set of guidelines. However, the payoff can be better care and reduced variation — two major goals for healthcare providers. Here are nine best practices for working with evidence-based guidelines at all stages of the process. 4 Tips to Implement a Transparent Medical Error Disclosure Policy By Sabrina Rodak Ann Arbor-based University of Michi- gan Health System has been widely rec- ognized for its innovative medical error disclosure policy called the Michigan Model. In the case of an error or com- plaint, a team of professionals analyzes the situation to determine the cause of an event. If the team determines there was a medical error or care was inap- propriate, the providers apologize and work with the patient to reach a joint solution. If the team determines care was medically appropriate, UMHS ex- plains the case to the patient and de- fends its providers. Since UMHS began this approach in 2001, the number of pre-suit claims and pending lawsuits dropped ap- proximately 61.5 percent. In addition, UMHS decreased its average legal ex- pense per case by more than 50 per- cent since 1997, including a savings of $2 million in the first year alone of the Michigan Model. 100 Patient Safety Benchmarks By Ellie Rizzo For hospitals, benchmarking data can be incredibly valuable. It allows individual institutions to identify areas of excellence and assess op- portunities for improvement, ultimately resulting in more efficient operations and better care. Becker’s Hospital Review has compiled a list of 100 patient safety benchmarks from various sources for hospital comparison. Readmissions, Mortality and Complications Entries 1 through 20 are based on data from Medicare.gov’s Hospital Compare, last updated July 18, 2013. continued on page 10 continued on page 7 continued on page 11 Sign up for the FREE E-Weekly at www.beckersasc.com/clinicalquality or call (800) 417-2035 SIGN UP TODAY! Clinical Quality & Infection Control Letters to the Editor Send your letters to the editor, opinions and responses to: editorial@ beckershealthcare.com or Becker's Hospital Review 35 E. Wacker Dr. Suite 1782 Chicago, IL 60601
- 2. 7Sign up for the Free Becker’s Clinical Quality & Infection Control E-Weekly at www.beckersasc.com/clinicalquality. 30-Day average readmissions rates 1. Heart attack: 19.7% 2. Heart Failure: 24.7% 3. Pneumonia: 18.5% 30-Day average death rates 4. Heart attack: 15.5% 5. Heart Failure 11.6% 6. Pneumonia: 12.0% Rates of serious complications Figures reflect the national average rates per 1,000 patient discharges. 7. Collapsed lung due to medical treatment: .35 8. Serious blood clots after surgery: 4.71 9. A wound that splits open after surgery, abdomen or pelvis: .95 10. Accidental cuts and tears from medical treatment: 2.05 11. Deaths among patients with serious treat- able complications after surgery: 113.43 Hospital acquired conditions Figures reflect the national average rates per 1,000 patient discharges. 12. Objects left in body accidently after surgery: 0.028 13. Air bubble in the bloodstream: 0.003 14. Mismatched blood types: 0.001 15. Severe pressure sores: 0.136 16. Falls or other injuries: 0.527 17. Blood infection from large-vein catheter: 0.372 18. Urinary catheter infection: 0.358 19. Uncontrolled blood sugar signs: 0.058 Entries 20 through 34 are based on data from AH- RQ’s Hospital Survey on Patient Safety Culture 2012, where data was collected from individual respondents at 1,128 hospitals. 20. Respondents reporting no events in the past 12 months: 10th percentile: 42% 25th percentile: 48% Median: 55% 75th percentile: 62% 90th percentile: 68% Average: 55% 21. Respondents reporting 1-2 events in the past 12 months: 10th percentile: 19% 25th percentile: 23% Median: 27% 75th percentile: 31% 90th percentile: 35% Average: 27% 22. Respondents reporting 3-5 events in the past 12 months: 25th percentile: 19% Median: 11% 75th percentile: 14% 90th percentile: 17% Average: 12% 23. Respondents reporting 6-10 events in the past 12 months: 10th percentile: 2% 25th percentile: 3% Median: 4% 75th percentile: 5% 90th percentile: 7% Average: 4% 24. Respondents reporting 11-20 events in the past 12 months: 10th percentile: 05 25th percentile: 1% Median: 1% 75th percentile: 2% 90th percentile: 3% Average: 2% 25. Respondents reporting 21 or more events in the last 12 months: 10th percentile: 0% 25th percentile: 0% Median: 1% 75th percentile: 1% 90th percentile: 2% Average: 1% Percentage of units reporting patient safety events in the last 12 months: 26. Anesthesiology No Events: 56% 1-2 Events: 31% 3-5 Events: 10% 6-10 Events: 3% 11+ Events: 0% 27. Emergency No Events: 48% 1-2 Events: 31% 3-5 Events: 13% 6-10 Events: 5% 11+ Events: 1% 28. Intensive Care Unit (any type) No Events: 36% 1-2 Events: 39% 3-5 Events: 17% 6-10 Events: 5% 11+ Events: 1% 29. Obstetrics No Events: 46% 1-2 Events: 35% 3-5 Events: 13% 6-10 Events: 4% 11+ Events: 0% 30. Pediatrics No Events: 45% 1-2 Events: 35% 3-5 Events: 14% 6-10 Events: 4% 11+ Events: 0% 31. Pharmacy No Events: 46% 1-2 Events: 20% 3-5 Events: 15% 6-10 Events: 9% 11+ Events: 1% 32. Radiology No Events: 56% 1-2 Events: 32% 3-5 Events: 9% 6-10 Events: 3% 11+ Events: 0% 33. Rehabilitation No Events: 60% 1-2 Events: 30% 3-5 Events: 7% 6-10 Events: 2% 11+ Events: 0% 34. Surgery No Events: 47% 1-2 Events: 32% 3-5 Events: 14% 6-10 Events: 5% 11+ Events: 1% Process of Care Measures Entries 35 through 79 are based on data from Medicare. gov’s Hospital Compare, last updated July 18, 2013. Percentages below reflect the national average. Heart attack/chest pain patient data 35. Average number of minutes before chest pain/heart attack patient was transferred to an- other hospital if he or she needed specialized care: 58 minutes 36. Average number of minutes before chest pain/heart attack patient got an ECG: 7 minutes 37. Percentage of chest pain/heart attack pa- tients who got drugs to break up clots within 30 minutes of arrival: 58% 38. Percentage of chest pain/heart attack patients who got aspirin within 24 hours of arrival: 97% 39. Percentage of chest pain/heart attack pa- tients who were given fibrinolytic medication within 30 minutes of arrival: 61% 40. Percentage of chest pain/heart attack pa- tients who were given percutaneous coronary intervention within 90 minutes of arrival: 95% 41. Percentage of Heart Attack Patients given Asprin at discharge: 99% 100 Patient Safety Benchmarks (continued from page 1)
- 3. 8 Sign up for the Free Becker’s Clinical Quality & Infection Control E-Weekly at www.beckersasc.com/clinicalquality. 42. Percentage of Heart Attack Patients given a prescription for Statin at discharge: 98% 43. Percentage of Heart failure patients given discharge instructions: 95% 44. Percentage of heart failure patients given an evaluation of left ventricular systolic function: 99% 45. Percentage of heart failure patients given ACE inhibitor or ARB for left ventricular sys- tolic dysfunction: 97% Pneumonia patient data 46. Percentage of pneumonia patients whose initial emergency room blood culture was per- formed before antibiotic administration: 98% 47. Percentage of pneumonia patients given most appropriate initial antibiotics: 94% Surgery patient data 48. Percentage of outpatients who got an antibi- otic within one hour of surgery: 97% 49. Percentage of patients given an antibiotic to help prevent infection within an hour of sur- gery: 98% 50. Percentage of patients whose preventive an- tibiotics were stopped within 24 hours of sur- gery: 97% 51. Percentage of patients who got treatment within 24 hours before or after surgery to help prevent blood clots after certain types of sur- gery: 98% 52. Percentage of outpatients who got the right kind of antibiotic: 97% 53. Percentage of patients taking beta blockers kept on the beta blockers just before and after surgery: 97% 54. Percentage of patients given the right kind of antibiotic to prevent infection: 99% 55. Percentage of heart surgery patients whose blood glucose was well controlled in days imme- diately after surgery: 96% 56. Percentage of patients whose urinary cath- eters were removed on the first or second post- surgical day: 96% 57. Percentage of patients actively warmed in operating room or whose body temperature was near normal by the end of surgery: 100% 58. Percentage of patients whose physician or- dered treatments to prevent blood clots after certain types of surgeries: 98% Emergency department patient data 59. Average time spent in the emergency depart- ment before being admitted as an inpatient: 274 minutes 60. Average time spent in the emergency depart- ment after doctor decided to admit them as an inpatient before moving from emergency de- partment to inpatient room: 96 minutes 61. Average time spent in the emergency depart- ment before being sent home: 138 minutes 62. Average time spent in the emergency depart- ment before being seen by a healthcare profes- sional: 28 minutes 63. Average time spent with broken bones wait- ed before receiving pain medication: 60 minutes 64. Percentage of patients who came to the emergency room with stroke symptoms and re- ceived brain scan results within 45 minutes of arrival: 46% 65. Percentage of patients assessed and given influenza vaccination: 86% 66. Percentage of patients assessed and given pneumonia vaccination: 88% Pediatric asthma data 67. Percentage of children who received reliever medication while hospitalized for asthma: 100% 68. Percentage of children who received system- ic corticosteroid medication while hospitalized for asthma: 100% 69. Percentage of children and caregivers who received a home management plan of care docu- ment while hospitalized for asthma: 86% Patient Experience Percentage of patients reporting that something was “always” done during their hospital stays: 70. Nurses communicated well: 78% 71. Physicians communicated well: 81% 72. Patients received help as soon as they wanted: 67% 73. Pain was well controlled: 71% 74. Staff explained medicines before administration: 63% 75. Room and bathroom were clean: 73% 76. Area around patient room was quiet at night: 60% 77. Information was given to patients about what to do at home during recovery: 84% 78. Patients rated their hospital a 9 or 10 (10 being the highest): 70% 79. Patients reported they would recommend their hospital: 71% Patient Volumes Entries 80 through 83 are from the Kaiser Family Foun- dation’s State Health Facts 80. Number of hospital admissions Average per 1,000 population State/locally owned: 15 Nonprofit: 83 For-Profit: 16 81. Number of hospital inpatient days Average per 1,000 population State/locally owned: 95 Nonprofit: 434 For-Profit: 84 82. Hospital emergency room visits Average per 1,000 population State/locally owned: 65 Nonprofit: 291 For-profit: 55 83. Hospital outpatient visits Average per 1,000 population State-locally owned: 352 Nonprofit: 1,597* For-profit: 156 *This statistic reflects multiple visits per individual Patient Safety Culture Entries 69 through 100 are based on data from AH- RQ’s Hospital Survey on Patient Safety Culture 2012. 84. Percentage of hospital staff reporting teamwork within units: 10th percentile: 73% 25th percentile: 76% Median: 80% 75th percentile: 84% 90th percentile: 87% Average: 80%
- 4. 9Sign up for the Free Becker’s Clinical Quality & Infection Control E-Weekly at www.beckersasc.com/clinicalquality. 85. Percentage of hospital staff reporting supervisor/manager expectations and actions promoting patient safety: 10th percentile: 67% 25th percentile: 71% Median: 75% 75th percentile: 79% 90th percentile: 83% Average: 75% 86. Percentage of hospital staff reporting organizational learning and continuous improvement from mistakes: 10th percentile: 63% 25th percentile: 68% Median: 72% 75th percentile: 77% 90th percentile: 81% Average: 72% 87. Percentage of hospital staff reporting management support for patient safety: 10th percentile: 61% 25th percentile: 67% Median: 72% 75th percentile: 77% 90th percentile: 81% Average: 72% 88. Percentage of hospital staff reporting overall perceptions of patient safety: 10th percentile: 56% 25th percentile: 60% Median: 66% 75th percentile: 71% 90th percentile: 76% Average: 66% 89. Percentage of hospital staff reporting feedback and communications about errors: 10th percentile: 55% 25th percentile: 59% Median: 64% 75th percentile: 70% 90th percentile: 74% Average: 64% 90. Percentage of hospital staff reporting frequency of events that had potential to cause harm but did not cause harm and were reported: 10th percentile: 54% 25th percentile: 58% Median: 62% 75th percentile: 66% 90th percentile: 68% Average: 63% 91. Percentage of hospital staff reporting communication and openness: 10th percentile: 54% 25th percentile: 58% Median: 62% 75th percentile: 66% 90th percentile: 69% Average: 62% 92. Percentage of hospital staff reporting teamwork across units: 10th percentile: 47% 25th percentile: 52% Median: 58% 75th percentile: 64% 90th percentile: 72% Average: 58% 93. Percentage of hospital staff reporting adequate unit staffing to provide quality care: 10th percentile: 45% 25th percentile: 50% Median: 56% 75th percentile: 62% 90th percentile: 68% Average: 56% 94. Percentage of hospital staff reporting smooth informational handoffs & care transitions: 10th percentile: 33% 25th percentile: 38% Median: 44% 75th percentile: 52% 90th percentile: 60% Average: 45% 95: Percentage of hospital staff reporting nonpunitive response to error: 10th percentile: 34% 25th percentile: 38% Median: 43% 75th percentile: 48% 90th percentile: 54% Average: 44% 96. Percentage of hospital staff giving their hospital an “excellent” patient safety grade: 10th percentile: 19% 25th percentile: 23% Median: 29% 75th percentile: 35% 90th percentile: 42% Average: 30% 97. Percentage of hospital staff giving their hospital a “very good” patient safety grade: 10th percentile: 19% 25th percentile: 23% Median: 29% 75th percentile: 49% 90th percentile: 54% Average: 45% 98: Percentage of hospital staff giving their hospital an “acceptable” patient safety grade: 10th percentile: 12% 25th percentile: 15% Median: 20% 75th percentile: 24% 90th percentile: 29% Average: 20% 99: Percentage of hospital staff giving their hospital a “poor” patient safety grade: 10th percentile: 2% 25th percentile: 3% Median: 5% 75th percentile: 5% 90th percentile: 7% Average: 4% 100: Percentage of hospital staff giving their hospital a “failing” patient safety grade: 10th percentile: 0% 25th percentile: 0% Median: 0% 75th percentile: 1% 90th percentile: 2% Average: 1% n Sign Up for the Free Becker’s Clinical Quality & Infection Control E-Weekly at www.beckersasc.com/clinicalquality.