Baixado 62 vezes

![Núcleo de Informação e Coordenação do Ponto BR
Brazilian Network Information Center
Diretor Presidente / CEO
Demi Getschko
Diretor Administrativo / CFO
Ricardo Narchi
Diretor de Serviços e Tecnologia / CTO
Frederico Neves
Diretor de Projetos Especiais e de Desenvolvimento / Director of Special Projects and Development
Milton Kaoru Kashiwakura
Centro de Estudos sobre as Tecnologias da Informação e da Comunicação – Cetic.br
Center of Studies on Information and Communication Technologies (Cetic.br)
Coordenação Executiva e Editorial / Executive and Editorial Coordination
Alexandre F. Barbosa
Coordenação Técnica / Technical Coordination
Juliano Cappi e Emerson Santos
Equipe técnica / Technical Team
Camila Garroux, Isabela Coelho, Suzana Alves, Tatiana Jereissati e Winston Oyadomari
Edição / Editing :
Comunicação NIC.br: Caroline D’Avo, Everton Teles Rodrigues, Fabiana Araújo
Apoio Editorial / Editorial Support
Projeto gráfico / Graphic Design : Suzana De Bonis / DB Comunicação
Preparação de texto / Proof reading : Pedro Barros
Tradução para o inglês / Translation into English : Karen Brito-Sexton
Revisão / Revision : Anthony Sean Cleaver e Leandro Rodrigues
Composição / Desktop publishing : Alvaro T. De Bonis
Dados Internacionais de Catalogação na Publicação (CIP)
(Câmara Brasileira do Livro, SP, Brasil)
Pesquisa sobre o uso das tecnologias de informação e comunicação no Brasil : TIC Edu-
cação 2010 = Survey on the use of information and communication technologies
in Brazil : ICT Education 2010 / [coordenação executiva e editorial/ executive and
editorial coordination, Alexandre F. Barbosa ; tradução/ translation Karen Brito
Sexton]. -- São Paulo : Comitê Gestor da Internet no Brasil, 2011.
Edição bilíngue: português/inglês.
ISBN 978-85-60062-45-4
1. Internet (Rede de computadores) – Brasil 2. Tecnologia da informação e da
comunicação – Brasil – Pesquisa I. Barbosa, Alexandre F.. II. Título: Survey on the use
of information and communication technologies in Brazil : ICT Education 2010.
11-0823 CDD- 004.6072081
Índices para catálogo sistemático:
1. Brasil : Tecnologias de informação e comunicação : Uso : Pesquisa 004.6072081
2. Pesquisa : Tecnologia da informação e comunicação : Uso : Brasil 004.6072081
Esta publicação está disponível também em formato digital em www.cetic.br
This publication is also available in digital format at www.cetic.br](https://image.slidesharecdn.com/indicadores-cgibr-tic-edu2010-110921081656-phpapp02/85/Indicadores-Comite-Gestor-Uso-da-internet-na-Educacao-4-320.jpg)


![33
2010 Pesquisa TIC Educação
ARTIGOS
O uso de dispositivos móveis na educação, além dessas possibilidades e dada sua característica
e relevância para a inclusão digital, é conceituado como mobile-learning, ou aprendizagem com
mobilidade (Silva & Consolo, 2008).
há experiências importantes em desenvolvimento voltadas à aprendizagem com mobilidade. Uma
delas, protagonizada pelo governo federal brasileiro, intitulada Um Computador por Aluno (UCA),
promove o uso de um computador portátil por aluno, professor e gestor da escola. Nesse projeto,
alunos e professores podem fazer uso de laptops conectados à Internet, e isso não fica restrito a
PORTuGuÊS
laboratórios de informática ou à sala de aula. O projeto está em desenvolvimento em escolas públi-
cas selecionadas como piloto, objetivando, principalmente, a inclusão digital e social da comuni-
dade escolar e o uso dessa tecnologia nos processos de ensinar e aprender no desenvolvimento do
currículo. Diversas outras iniciativas de uso de computadores portáteis podem ser encontradas em
sistemas públicos e privados de ensino.
CoNCLUSõES E CoNSIdERAÇõES
O cenário atual acena para a concretização de inovações pedagógicas possibilitadas pela integra-
ção das tecnologias com a educação, em especial com a exploração de alguns conceitos e caracte-
rísticas propiciados pela presença de inovações como a Web 2.0, a conectividade sem fio, a mobili-
dade e o uso do laptop na proporção de um computador por aluno. é possível que outros ambientes
virtuais e ferramentas também estejam presentes e sejam explorados na educação, como os ambien-
tes imersivos tridimensionais (metaversos) e os games, entre outros já existentes ou emergentes.
A coexistência e a integração dessas inovações tecnológicas podem, inclusive, conviver com as
tecnologias já em uso, convergindo para potencializar a inovação educativa, que se concretiza por
meio da interação multidirecional, da criação de redes de construção de significados, da coautoria,
da expansão dos espaços e tempos de aprender e ensinar, e do trabalho pedagógico com o uso de
diferentes letramentos e linguagens.
Como tendência, essas ferramentas e atividades estarão, também, na essência da Web 3.0 (web
semântica), favorecendo os chamados sistemas de conhecimento coletivo, “capazes de auxiliar
na produção de conhecimento coletivo através da análise da contribuição colaborativa humana”
(Isotani et al., 2008, p. 6).
Finalmente, o uso de determinada tecnologia provoca mudanças nos modos de aprender, ensinar,
pensar, relacionar-se com as demais pessoas e, também, de conceber e desenvolver o currículo.
Como ressalta Kenski (2007):
A presença de uma determinada tecnologia pode induzir profundas mudanças na maneira de
organizar o ensino [...] existe uma relação direta entre educação e tecnologia. Usamos muitos
tipos de tecnologias para aprender e saber mais e precisamos da educação para aprender e saber
mais sobre as tecnologias. (p. 44)
é, assim, importante considerar que a incorporação de novas tecnologias aos modos de aprender e
ensinar torna necessário repensar o desenvolvimento do currículo.](https://image.slidesharecdn.com/indicadores-cgibr-tic-edu2010-110921081656-phpapp02/85/Indicadores-Comite-Gestor-Uso-da-internet-na-Educacao-35-320.jpg)


![60
Pesquisa TIC Educação 2010
ARTIGOS
Naturalmente, a empresa que editou o livro e o autor que o escreveu buscam remuneração – e é
legítimo. Mas por que travar o acesso, ou torná-lo tão caro que se torna acessível apenas aos mais
ricos? O MIT, nos Estados Unidos, criou o conceito de opencourseware, curso aberto, tal como o
Linux criou a fonte aberta.2 Todos os trabalhos de todos os professores são disponibilizados on-line
gratuitamente, a partir do portal www.ocw.mit.edu. Em poucos anos, mais de 50 milhões de textos
científicos foram baixados no planeta só do MIT. Imagine-se a contribuição para o conhecimento,
para o avanço científico geral.
PORTuGuÊS
Como isso se compara com o interesse da editora e do autor? é legítima sua remuneração, mas não
impedir o acesso e a comunicação científica sem fins lucrativos. E a pessoa que gostar de um livro
poderá comprá-lo. Inclusive livros bons cujo uso se generaliza por meio do fácil acesso, terminam
sendo também mais comprados. Diziam que a televisão ia acabar com o cinema. Era uma boba-
gem, mas sobretudo seria absurdo proibir a televisão pelo risco de prejudicar o cinema.
O que acontece é que, com a generalização do conhecimento como fator principal de produção
de riqueza, com a facilidade da sua circulação planetária on-line e praticamente sem custos e com
seu caráter de bem não rival, as regras do jogo precisam ser adaptadas. A maioria das pessoas
ignora que os advogados corporativos foram estendendo o copyright até ele travar o livre acesso por
setenta anos depois da morte do autor. Patentes de vinte anos sobre medicamentos, numa era de
transformações extremamente aceleradas, não têm sentido. Os livros de Paulo Freire têm seu livre
acesso travado até 2050, ele que tanto batalhou pela democratização do conhecimento.
O absurdo gerado está levando ao surgimento de inúmeras alternativas que buscam contornar os
que tentam travar o acesso ao conhecimento e o pleno uso das novas tecnologias. O livro wiki-
nomics mostra como numerosas empresas que pararam de proibir e buscam, ao contrário, a cola-
boração em massa dos clientes, abrindo suas informações e solicitando contribuições, estão sim-
plesmente se dando melhor. O estudo Apropriação indébita mostra como funcionam os pedágios
corporativos sobre os conhecimentos, e como eles dificultam o progresso para gerar grandes lucros
sem as contribuições produtivas correspondentes. cognitive Surplus [Excedente cognitivo] mostra
que a humanidade dispõe de um imenso capital de conhecimentos armazenado na cabeça das
pessoas, tragicamente subutilizado: quando a wikipédia faz a sua aposta, e gera a impressionante
fonte planetária de informações, está simplesmente disponibilizando para todos a possibilidade de
contribuir com o conhecimento de que dispõem, que estaria parado ou disponível apenas para si.
Interessante também é o fato de inúmeras pessoas contribuírem financeiramente para a wikipédia,
sem obrigação, pagando o que acham que valem os serviços recebidos. O detalhamento dessas
questões pode ser encontrado no nosso artigo mais amplo, da propriedade intelectual à sociedade
do conhecimento.
O ser humano é dotado de inteligência, e ser rico não significa ser mais inteligente. Numa era
em que o desenvolvimento econômico depende cada vez mais do conhecimento incorporado aos
processos produtivos, liberar o acesso aos conhecimentos por parte dos dois terços esmagados da
humanidade pode constituir um eixo privilegiado para se enfrentar simultaneamente a desigual-
dade e, por meio de processos produtivos mais inteligentes, os desafios ambientais. Na realidade,
deveríamos não apenas não dificultar este acesso: deveríamos fomentá-lo.
2
Mais informações em http://web.mit.edu/newsoffice/2009/open-access-0320.html.](https://image.slidesharecdn.com/indicadores-cgibr-tic-edu2010-110921081656-phpapp02/85/Indicadores-Comite-Gestor-Uso-da-internet-na-Educacao-62-320.jpg)

![67
2010 Pesquisa TIC Educação
ARTIGOS
Na perspectiva proveniente desde a obra de Costa Pinto, para o desenvolvimento do país importava
atribuir ao Estado uma função protagonista da ação política, pela via do planejamento. Nessa tradi-
ção sociológica, o desenvolvimento da sociedade brasileira é mediado pela ação intencional e arti-
culada do Estado – a via do planejamento –, ator capaz de mobilizar a sociedade para a produção
de mudanças mais profundas no país. Atualmente, trata-se de uma perspectiva sociológica implíci-
ta nas proposições hegemônicas da Conferência Brasileira de Educação:
PORTuGuÊS
Na medida em que a CONAE visa à mobilização social em prol da educação, o documento-
-referência inspira-se na necessidade de enfrentamento de, pelo menos, cinco grandes desafios
para o Estado e para a sociedade brasileira [...]. Portanto, a construção de um Sistema Nacional
de Educação requer o redimensionamento da ação dos entes federados, garantindo diretrizes
educacionais comuns a serem implementadas em todo o território nacional, tendo como pers-
pectiva a superação das desigualdades regionais. Dessa forma, objetiva-se o desenvolvimento
de políticas públicas educacionais nacionais universalizáveis, por meio da regulamentação das
atribuições específicas de cada ente federado no regime de colaboração e da educação privada
pelos órgãos de Estado [...]. No cenário educacional brasileiro, marcado pela edição de planos
e projetos educacionais, torna-se necessário empreender ações articuladas entre a proposição e
a materialização de políticas, bem como ações de planejamento sistemático. Por sua vez, todas
precisam se articular com uma política nacional para a educação, com vistas ao seu acompa-
nhamento, monitoramento e avaliação. (Brasil, 2010)
A ação do Estado e a mobilização social em prol da educação importam na construção de um siste-
ma educacional – entendido como produção de mudanças estruturais, especialmente na construção
de direitos sociais universais – que garanta diretrizes educacionais comuns superadoras de desigual-
dades, mediante a regulamentação das atribuições dos entes federados. A Conferência Nacional em
2010 declara, também, que para tais objetivos são necessários recursos fiscais e operacionais. No
entanto, para as mudanças desejáveis, a mobilização social articula-se com a ação estatal.
Por essa razão, as transformações operadas na sociedade brasileira pelo vetor da expansão da
governança democrática e da maior inserção na economia capitalista mundializada devem ser ana-
lisadas. Essas transformações produziram novos sujeitos e formas de sociabilidade, que por sua vez
confrontam com a atuação burocrático-corporativa ou de matriz clientelista ainda presentes.
EdUCAÇÃo E dESENvoLvImENTo: A EmERGêNCIA
dE NovAS FoRmAS dE SoCIABILIdAdE
Ao aproximar modernização e desenvolvimento, cuja apreensão se dá a partir dos projetos e dos
movimentos das diversas subjetividades coletivas que para ela contribuem, Domingues observa que:
A modernidade brasileira, em seus desenvolvimentos recentes, tem sido impulsionada por
processos poderosos de “desencaixe” dos sujeitos de laços mais firmes e estáveis, inclusive,
hoje, em termos da estruturação subjetiva de indivíduos e coletividades como trabalhadores;](https://image.slidesharecdn.com/indicadores-cgibr-tic-edu2010-110921081656-phpapp02/85/Indicadores-Comite-Gestor-Uso-da-internet-na-Educacao-69-320.jpg)
![68
Pesquisa TIC Educação 2010
ARTIGOS
processos de individualização se acentuam, a família muda, a posição da mulher se altera; uma
“democratização” social, ligada a essa individualização, e ao menos a reivindicação de cidada-
nia avançam; a economia sente a demanda de um funcionamento mais flexível e eficiente nos
próprios processos produtivos; a multiplicação do consumo coloca para os sujeitos uma mul-
tiplicidade crescente de opções, desde, é claro, que façam parte daqueles em condições míni-
mas de a elas terem acesso. Ou seja, a existência individual se faz potencialmente mais aberta.
(Domingues, 1999, pp. 86-7)
PORTuGuÊS
As análises de Domingues sobre os processos modernos de individualização a localizam na difusão
da cidadania, apreendida como “abstração real” na qual os indivíduos buscam guarita. Desencaixes-
reencaixes-novos desencaixes constituem processos de desenvolvimento societário em contextos
em que o “ajuste neoliberal” dos Estados latino-americanos obstaculizou a universalização de ser-
viços que assegurem os direitos de cidadania.
Autores como Souza (2010) apontam como um dos resultantes desses processos de desencaixe e
produção de novas identidades a formação no país de uma classe trabalhadora de “batalhadores”,
ou empreendedores, em que o substrato político-ideológico do self-made-man está presente. Para
esses sujeitos, a educação escolar configura-se como um valor a ser preservado, 2 embora sua inser-
ção e inclusão no mercado e nas novas formas de sociabilidade provenham em grande parte do tra-
balho intensivo e/ou da fortuna. Como participa a educação escolar do(s) projeto(s) individual(is)/
coletivo(s) de desenvolvimento dessa classe social?
Nossa pesquisa mostrou que essa classe conseguiu seu lugar ao sol à custa de extraordiná-
rio esforço: a sua capacidade de resistir ao cansaço de vários empregos e turnos de trabalho, à
dupla jornada na escola e no trabalho, à extraordinária capacidade de poupança e de resistên-
cia ao consumo imediato e, tão ou mais importante que tudo que foi dito, a uma extraordiná-
ria crença em si mesmo e no próprio trabalho [...]. Como inexiste o privilégio das classes domi-
nantes da dedicação ao estudo como atividade principal e muitas vezes única, a apropriação
do capital escolar e cultural vai ser, tendencialmente, menor que na verdadeira classe média.
(Souza, 2010, pp. 50-2)
As respostas possíveis apreendidas dos depoimentos colhidos por Souza (2010) revelam que as
valorizações do acesso, permanência e aprendizagens escolares podem ser vistas como reações
subjetivas individuais a situações de desencaixe, de vivências de injustiças e, também, revelam que
2
As modificações do capitalismo contemporâneo não foram automáticas nem óbvias para ninguém. Ao contrário, durante toda
essa década, os filhos da “revolução expressiva” dos anos 1960 passaram em vários países a ocupar postos-chaves como for-
madores de opinião e como figuras centrais da vida pública dessas sociedades. Essa geração, a primeira a ser produzida no
contexto da educação pública de qualidade para amplos setores sociais – princípio que se consolidou depois da Segunda
Guerra Mundial como subproduto do próprio compromisso fordista –, foi, ela própria, o suporte de uma crítica virulenta
à heteronímia típica do trabalho fordista, assim como ao corte hierárquico de todas as instituições capitalistas e burguesas
dominantes nesse período (Souza, 2010, p. 38).](https://image.slidesharecdn.com/indicadores-cgibr-tic-edu2010-110921081656-phpapp02/85/Indicadores-Comite-Gestor-Uso-da-internet-na-Educacao-70-320.jpg)
![69
2010 Pesquisa TIC Educação
ARTIGOS
as instituições escolares cumprem, em muitos casos, a função sociopolítica de assegurar serviços
que permitam futuras individualizações.
[...] é muito comum investir em alternativas, sobretudo nos estudos, na esperança de um empre-
go que traga um pouco mais de estabilidade [...] ele sabe que o telemarketing não é para a vida
toda, mas o fato de ter completado o ensino médio não corresponde automaticamente ao aces-
so irrestrito às instituições superiores de ensino, principalmente às mais prestigiadas e concorri-
PORTuGuÊS
das [...] sua mãe, insistentemente, cobra emprenho e dedicação pessoal nos estudos na esperan-
ça de que ele [...] Ele experimenta a sensação de insegurança devido à produção sócio-escolar,
nos últimos anos, de um verdadeiro exército de reserva minimamente escolarizado para o tra-
balho precário. (Souza, 2010: 71-8)
A função de desenvolvimento pela via meritocrática da educação escolar é, simultaneamente, valo-
rizada e/ou desconsiderada. A escolarização inscreve-se na construção de projetos de futuro e/ou
constitui-se como ex-ante da situação atual.
O entrevistado já tem filho que estudou mais que os pais e que terá, segundo ele, um futuro
melhor do que o de pequeno comerciante [...] um traço comum destes batalhadores é a posse
de alguma capacidade de trabalho cuja origem não é o ensino formal da escola [...] a filha, de
onze anos, tem computador e Internet em casa [...] já pensa em como poderá trabalhar para sus-
tentar a futura faculdade da filha. (Souza, 2010)
Com Foucault, a análise atenta do conjunto de depoimentos colhidos por Souza (2010) revela como
o capitalismo penetrou em nossa existência e, também, como as instituições educacionais articu-
lam-se às novas formas de sociabilidade. Uma leitura foucaultiana dos depoimentos colhidos jun-
to aos “batalhadores brasileiros” é reveladora dos diversos dispositivos de governação/educação
sobre os indivíduos. A presença/ausência da educação escolar responde pela configuração de uma
nova ratio governamentale capaz de justificar a(s) situação(ões) de desenvolvimento no capitalis-
mo como associada(s) ao progresso individual. As formas mais contemporâneas de sociabilidade –
desveladas em Souza (2004) – sugerem contraditoriamente que a apropriação, da educação escolar
pelos indivíduos se faz tanto por sua ausência quanto por sua presença. A interveniência dessa ins-
tituição pode ser desejável e ter sido relevante, porém não é imprescindível.
é um pouco na escola, ao desenvolver um raciocínio matemático que já conhecia na prática ao
vender os produtos agrícolas do pai desde bem pequeno, mas muito mais nas suas experiências
de trabalho, que Pedro desenvolve as disposições requisitadas para a subsistência econômica no
seio do capitalismo contemporâneo. (Souza, 2010, p. 102)](https://image.slidesharecdn.com/indicadores-cgibr-tic-edu2010-110921081656-phpapp02/85/Indicadores-Comite-Gestor-Uso-da-internet-na-Educacao-71-320.jpg)
![70
Pesquisa TIC Educação 2010
ARTIGOS
dESENvoLvImENTo doS SISTEmAS EdUCACIoNAIS:
A EmERGêNCIA dE NovoS modoS dE REGULAÇÃo
Em simbiose com essas novas formas de sociabilidade, tem-se difundido globalmente o movimento
conhecido como New Public Manegement3 (NPM), que vem estruturando toda uma discussão con-
temporânea sobre mudanças organizacionais e administrativas no setor estatal, com influência na
administração dos sistemas de ensino. (Power, 1997)
PORTuGuÊS
Defino NPM abstratamente como um campo de discussão política – conduzida internacional-
mente – sobre assuntos relacionados a administração pública, incluindo políticas de administra-
ção pública, liderança executiva, projetos de organizações programáticas e operações governa-
mentais. (Barzelay, 2000, p. 23)
Os programas no campo da NPM têm por pressupostos estudos relacionados à teoria da escolha
racional e a teorias organizacionais de cunho empresarial (Barzelay, 2000). Tanto as reformas edu-
cativas (inglesa e americana) da década de 1990 quanto os programas inspirados na NPM privile-
giaram a livre oferta de serviços públicos (educacionais incluídos), para a “livre” escolha dos cida-
dãos-consumidores, mediadas pela introdução de formas mais competitivas de financiamento, para
a consecução de objetivos de maior eficiência e eficácia e monitorados quanto a resultados.
Nesse corpus ideológico, as ideias que orientaram perspectivas “modernizantes de reforma do
Estado” configuraram, também, o imaginário social. Por um lado, há o reconhecimento das orga-
nizações da sociedade civil4 como uma instância positiva de realização de democracia versus um
aparato de Estado como instrumento de dominação burocrática. Desse modo, a desconcentração
da prestação de serviços, especialmente na área social, é considerada como capaz de potenciar
respostas à diversidade e possibilidades existentes na sociedade. Essa perspectiva se fundamenta na
clivagem entre fins/objetivos e meios/procedimentos. A burocracia é questionada por sua ineficá-
cia, rigidez e pouca visibilidade na formulação de alternativas.
é extensa e diversificada a literatura na área educacional sobre temas como diversidade curricular,
modalidades de ensino específicas para jovens, povos indígenas, alternância de métodos e proces-
sos educativos, etc. Subjaz a essa literatura o reconhecimento da diversidade de grupos e setores da
sociedade que demandariam rupturas com o padrão uniforme de atendimento proveniente de um
modo de regulação do sistema educacional de matriz burocrática (Maroy, 2008).
Proposições político-administrativas de ênfase gerencialista passam a destacar resultados e produ-
tividade, obnubilando a crítica às relações sociais que as construíram. Nessa perspectiva, a ênfa-
se em mecanismos de controle ex post pelos poderes centrais dos resultados obtidos – avaliação
sistêmica, por exemplo – é combinada com apelos à iniciativa local com o objetivo de validação
3
“NPM é uma filosofia da administração […] que emergiu na década de 1980. [...] h & j afirmam que a NPM influenciou a
agenda de governos ao estabelecer um ambiente de opinião em favor de suas doutrinas” (Barzelay, 2000, p. 235).
4
O termo, nesta perspectiva, designava uma instância positiva de realização plena e democrática das diferenças, uma suposta
esfera de autenticidade e de liberdade em face de interesses e da cultura (Moraes, 2001, pp. 14-16).](https://image.slidesharecdn.com/indicadores-cgibr-tic-edu2010-110921081656-phpapp02/85/Indicadores-Comite-Gestor-Uso-da-internet-na-Educacao-72-320.jpg)
![72
Pesquisa TIC Educação 2010
ARTIGOS
fluxo escolar (frequência e repetência). Esses índices informariam metas de qualidade da educação
a serem perseguidas comparáveis às de países desenvolvidos.
Esses três processos sociais – emergência de novos sujeitos, difusão dos princípios do NPM e pro-
jetos de reforma dos serviços prestados no âmago de cada uma e de todas as unidades educacio-
nais – refuncionalizam a educação escolar, articulando-a agora ao termo “desenvolvimento social”.
A crítica à educação escolar vista como “burocrática” e promotora de “meritocracias” é superada
ao se comprovar a dissociação entre escolaridade e ascensão social, mas especialmente ao se pro-
PORTuGuÊS
por reformá-la, na atualidade, como instituição promotora do desenvolvimento social. Nesse caso,
a administração (gestão) das unidades escolares e sistemas de ensino foi reconfigurada pela nova
tessitura das relações sociais e da cultura político-administrativa gestada ao longo dos últimos vin-
te anos. Esses três processos sociais desenvolveram os sistemas educacionais e produziram efeitos
na vida social, influenciando a relação entre educação e sociedade, no sentido de restringi-la aos
padrões mínimos aferidos de modo mais uniforme e universalizado.
Entretanto outra dimensão do desenvolvimento societário, também afeta aos sistemas educacio-
nais, envolve a emergência de uma esfera pública diversificada, incluindo meios de comunicação
de massa e alternativos.
ESFERAS PúBLICAS: A TESSITURA dA RELAÇÃo
ENTRE EdUCAÇÃo E dESENvoLvImENTo SoCIAL
Ao apontar os elementos que promoveram a gênese da esfera pública, habermas (1984) constituiu
como a primeira fonte do conceito a separação entre a capacidade reflexiva dos indivíduos e a esfe-
ra da realização de seus interesses materiais. De acordo com o pensamento habermasiano, inter-
põe-se entre o interesse privado e a ação estatal um espaço/tempo caracterizado pela discussão
livre e racional do exercício da autoridade política (Avritzer & Costa, 2004, p. 704).
habermas acrescenta, ainda, no contexto de surgimento da sociedade burguesa o papel da ciência das
finanças e da doutrina da administração, subordinando a esfera privada aos órgãos do poder público.
A economia moderna não se orienta mais pelo oikos, pois no lugar da casa colocou-se o mer-
cado: transforma-se em “economia comercial”. Na Cameralística do século XVIII (que deriva o
seu nome de câmera, a câmara do tesouro do senhor feudal), esta precursora da economia polí-
tica se coloca, por um lado, no mesmo nível da ciência das finanças e, por outro, da doutrina
que se destacava da técnica agrária sintomaticamente como uma parte da “policy”, a doutrina
da administração propriamente dita: tão estreitamente a esfera privada da sociedade burguesa é
subordinada aos órgãos do poder público. [...]
Ainda que isso seja dito por um preconceito muito espalhado, o mercantilismo não favorece de
jeito nenhum a empresa estatal; a política empresarial exige, pelo contrário, ainda que por vias
burocráticas, montar e desmontar empresas privadas que trabalhem capitalistamente. Por isso, a
relação entre autoridades e súditos acaba redundando na peculiar ambivalência de regulamen-
tação pública e iniciativa privada. Assim, é problematizada aquela zona em que o poder públi-
co, mediante atos administrativos contínuos, mantém ligações com as pessoas privadas. [...] já](https://image.slidesharecdn.com/indicadores-cgibr-tic-edu2010-110921081656-phpapp02/85/Indicadores-Comite-Gestor-Uso-da-internet-na-Educacao-74-320.jpg)
![78
Pesquisa TIC Educação 2010
ARTIGOS
No Brasil, esse quadro avaliativo ganhou densidade notadamente após o desdobramento, em
2005, do Sistema Nacional de Avaliação da Educação Básica (Saeb), no qual um de seus ramos, a
Avaliação Nacional do Rendimento Escolar (Anresc) – mais conhecida pelo nome de Prova Brasil –,
teve seus resultados de língua portuguesa (leitura) e matemática (resolução de problemas) incor-
porados, juntamente com as taxas de aprovação, ao cálculo do Índice de Desenvolvimento da
Educação Básica (Ideb)2, estimulando ações similares em várias redes públicas de ensino, com des-
taque para o Índice de Desenvolvimento da Educação no Estado de São Paulo (Idesp). No caso do
PORTuGuÊS
Ideb, uma característica é a divulgação dos dados de todas as escolas públicas que participaram da
Prova Brasil, aumentando o envolvimento de vários segmentos no debate e na investigação sobre
seus significados e possíveis explicações. Textualmente, a formulação do Ideb apresenta uma visão
extremamente objetivista sobre seu potencial para indicar a qualidade da escola, embora, histórica
e politicamente, essa concepção encontre, antes e depois de sua edição, outras manifestações na
literatura e nas políticas educacionais.
Com efeito, nesse cenário, os resultados da avaliação externa passaram a compor, tanto em políti-
cas públicas quanto em pesquisa, neste caso ainda de modo incipiente, um nexo explicativo para
o que se designa genericamente como qualidade da educação. E aqui reside precisamente o centro
do problema deste trabalho para fins de apreciar possíveis desafios de pesquisa educacional: seriam
tais resultados capazes de indicar a qualidade da escola? Isso abre o debate, então, para pelo menos
duas outras questões: uma referente ao próprio objeto dessas avaliações – a escola como um todo
ou apenas face, mesmo que importante, do trabalho aí desencadeado – e outra sobre a maneira de
investigar tal objeto.
oS dESAFIoS dA dELImITAÇÃo dE oBjEToS
E PRoBLEmAS NA PESqUISA EdUCACIoNAL
Burke (2003, p. 183), passando em revista o processo social de produção do conhecimento, indica
que, com variações no tempo e nas culturas:
[...] só há quatro razões para aceitar proposições como verdadeiras: sentimento, autoridade,
razão e percepção sensorial [...] No início do período moderno esse equilíbrio se inclinava para
uma combinação de razão e percepção sensorial [...] O que era novo era uma consciência cada
vez mais aguda do método, ligada ao uso de instrumentos científicos, à coleta cada vez mais
sistemática de fatos particulares e ao surgimento dos manuais práticos.
2 O Ideb, oficializado pelo Decreto no 6.074/2007 e fundamentado em Fernandes (2007), é calculado e divulgado, entre outros
estratos, para todas as escolas públicas com pelo menos trinta alunos na 4 a e 8a séries do ensino fundamental. Para maiores
informações, deve-se consultar o sítio do Inep, autarquia do Ministério da Educação, responsável pela operacionalização do
Saeb (www.inep.gov.br).](https://image.slidesharecdn.com/indicadores-cgibr-tic-edu2010-110921081656-phpapp02/85/Indicadores-Comite-Gestor-Uso-da-internet-na-Educacao-80-320.jpg)
![81
2010 Pesquisa TIC Educação
ARTIGOS
essas flutuações na “natureza dispersiva do objeto de pesquisa educacional [que] condiciona a fun-
ção das hipóteses operadas para estudá-lo”, pois essa natureza “reclama a construção prévia de
uma estrutura teórica suficientemente ampla e maleável em face do objeto de estudo”. No entanto,
inescapavelmente, a construção de um marco teórico sólido o suficiente para dar conta dos proble-
mas que precisam ser enfrentados passa pela necessidade de abertura a outras ciências, inclusive
pela própria formação do pesquisador. Mas reitera Orlandi (1969, p. 17):
PORTuGuÊS
O caráter flutuante dessas aberturas só pode ser controlado, não pela negação da própria aber-
tura [...] mas pela dinamização crescente de outras teorizações e práticas humanas em função
da própria mobilidade do objeto de pesquisa em educação.
Isso recolocaria a relevância da perspectiva de se admitir com maior indulgência a hipótese de ado-
tar a grounded theory, como apontam Gibson e Brown (2009), na condição de recurso de funda-
mentação e, mesmo, de metodologia de investigação, como estratégia de estudar, por exemplo, os
números com mais vagar, sem a pressa que outros modelos exortariam, na linha de encontrar mui-
to facilmente a relação causa-efeito.
é preciso, nessa altura, realçar que – a despeito de usos e generalizações equivocadas e para se evi-
tar questionamentos simplistas que afirmam que tais recursos quantitativos seriam um ressurgimen-
to de vertentes “positivistas” – a existência de resultados de avaliações externas traz para a pesquisa
educacional o debate sobre os métodos quantitativos, os quais, como demarca Ferrare (2011), acen-
tuadamente pelo que se denominou pensamento crítico na educação, foram quase abandonados
em função de que a tradição que os alicerçou não levava em conta os fatores sociais mais amplos
que condicionam a educação e reforçam os mecanismos conservadores desta.
Assim, o aparecimento ou a retomada de metodologias que se concentram nas medidas educacio-
nais – abarcando instrumentos, procedimentos de aplicação e de coleta, dados, constituição de
bases de dados, informação, argumentos, conhecimento, juízos, ações, consequências, impactos,
etc. – podem infundir novos horizontes – e desafios à pesquisa educacional, sem nada a obstar
as preocupações mais amplas, sociais e políticas, sobre a natureza política da escola, o que não
dispensa tais aportes metodológicos, nem o fazem os únicos na investigação científica, como se
encontra em Pearl (2009) ou em Shadish, Cook & Campbell (2002).
AvALIAÇõES ExTERNAS Como ExPRESSÃo dE PoLíTICA EdUCACIoNAL
Diante da potencial polarização entre usar ou não resultados de avaliações externas como indica-
dores, podemos recorrer a josé Paulo Paes, que indica que “é entre a recusa e o entusiasmo que
corre a estrada da compreensão crítica” (1985, p. 10). Essa indicação parece adequada para tratar-
mos de um tema que, sem nunca ter perdido sua componente política, ganha maior densidade nas
políticas educacionais e, portanto, é mais propenso a ser abordado com recusas e entusiasmo, o
que pode turvar sua análise.
Com licença poética e alicerçando o dimensionamento político das avaliações externas, podemos
nos apoiar em Secchin (1993, p. 216-217), quando este indaga e responde:](https://image.slidesharecdn.com/indicadores-cgibr-tic-edu2010-110921081656-phpapp02/85/Indicadores-Comite-Gestor-Uso-da-internet-na-Educacao-83-320.jpg)
![82
Pesquisa TIC Educação 2010
ARTIGOS
Para que serve um poema? Talvez para insistir que há sempre restos, equívocos, lapsos, fraturas
na sintonia do homem com o real. Ignorá-los é acreditar na adequação entre palavras e coisas,
na vigência de um discurso homogêneo que nega a cada um a possibilidade de negociar com as
palavras as frestas de perturbação e mudança de que elas e nós necessitamos para continuarmos
vivos [...] O recorte entre o prosaico e o poético é administrado por inúmeros vetores culturais, por
mais que isso desagrade aos caçadores da essência perdida, e perdida por nunca ter existido [...]
[...] a poesia não precisa lamuriar-se diante da ordem tecnológica e nela acusar o inimigo obs-
PORTuGuÊS
trutor de seu alcance. [...] ela pode vigorar sem outro compromisso que não seja a afirmação de
que nossa liberdade passa não apenas pelas palavras em que nos reconhecemos, mas, sobretu-
do, pelas palavras com as quais aprendemos a nos transformar.
Ou seja, os números não dão precisão per se ao entendimento da realidade, mas introduzem uma
outra maneira de inquirir essa realidade, cujo entendimento – supondo-o possível – se fará median-
te os recortes que nela fazemos, expressos nos objetos e perguntas aos quais endereçamos. Ainda
que avaliação não se confunda com pesquisa, pois aquela é revestida de preocupações mais ime-
diatas e tem em seus julgamentos um dos traços mais salientes, como destaca Nevo (2006) – e que
daí derivem resultados com a mais elevada consistência, face às condições em que se realiza –, ela
pode ser considerada um forte ponto de apoio.
A educação diz respeito ao processo formativo, ou endocultural, nas acepções de Brandão (2010),
da espécie humana, processo do qual não pode ser privado sob pena de não tornar-se humano. Não
obstante, na maioria das sociedades, a formação dos seres humanos associou-se à ideia de que isso
deve, em algum grau e em alguma quantidade, associar-se à escola. Tal configuração cultural dá a
entender, em muitos contextos, que falar de educação supõe, intrinsecamente, falar de educação
escolar. Mesmo quando se reconhece que esta está subsumida àquela, a força simbólica da educa-
ção escolar avulta, quer pelo horizonte da conservação social, quer pelo da contestação, mas nun-
ca apartada da política, como recuperou, entre muitos outros autores, Fernandes (2010).
Os valores liberais da igualdade de oportunidades, entendidos, via de regra, como igualdade de
oportunidades escolares, salientam o lugar especial da escola na sociedade, locus privilegiado na
instrumentação para a disputa por posições na estrutura hierárquica social. Mesmo por outros ângu-
los ideológicos, a defesa da escola, na perspectiva de emancipação humana e de integração lin-
guística ou noutros vislumbres orientados pela igualdade social final, converteu-se, provavelmente,
num dos principais direitos humanos, a ponto de ser estabelecida como uma imposição. Nas pala-
vras de Marshall (1967), trata-se de um direito que é condição para usufruto de outros direitos, o
que justificaria a violência – simbólica, mas quiçá física – sobre crianças a ela compelidas.
E, nesses termos do processo formativo, a avaliação expõe-se potencialmente como um objeto de
investigação. Inclusive para se aquilatar, na via da meta-avaliação, se não foram violadas certas regras
do processo avaliativo, o que, por sua vez, comprometeria o juízo avaliativo e suas consequências.
Além do mais, dado seu caráter concentrador, pode-se afirmar que a avaliação configura-se como
uma categoria dos processos educativos que merecem atenção especial, particularmente por ser
concreta, ou seja, porque é a síntese de múltiplas determinações, considerando-se as observações
de Marx (1970, p. 206):](https://image.slidesharecdn.com/indicadores-cgibr-tic-edu2010-110921081656-phpapp02/85/Indicadores-Comite-Gestor-Uso-da-internet-na-Educacao-84-320.jpg)
![83
2010 Pesquisa TIC Educação
ARTIGOS
[...] é concreto porque é síntese de muitas definições, representando, então, a unidade de diver-
sos aspectos. Ele aparece, portanto, no pensamento como um resumo, um resultado, não como
um ponto de partida, embora seja verdadeiro ponto de origem, e, assim, também como ponto
de origem da percepção e da imaginação.
Adicionalmente, para fundamentar a avaliação como categoria, Cury (1985, p. 21) aponta:
PORTuGuÊS
As categorias são conceitos básicos que pretendem refletir os aspectos gerais e essenciais do
real, suas conexões e relações. Elas surgem da análise da multiplicidade dos fenômenos e pre-
tendem um alto grau de generalidade.
Desde logo observe-se que as categorias devem corresponder às condições concretas de cada
tempo e lugar. Elas não são algo definidas de uma vez por todas e não possuem um fim em si
mesmas. Elas ganham sentido enquanto instrumento de compreensão de uma realidade social
concreta, compreensão esta que, por sua vez, só ganha sentido quando assumida pelos grupos
e agentes que participam de uma prática educativa.
As categorias possuem simultaneamente a função de intérpretes do real e de indicadores de
uma estratégia política. Portanto, a exposição formal que se segue só tem sentido enquanto ins-
trumento metodológico de análise, ligado à prática educativa e no contexto de um tempo e um
lugar determinados.
As categorias, assim, só adquirem real consistência quando elaboradas a partir de um contex-
to econômico-social e político historicamente determinado, pois a realidade não é uma petri-
ficação de modelos ou um congelamento de movimentos. Pelo contrário, síntese de múltiplas
determinações, está em constante movimento de expansão. Por isso é importante considerar o
contexto, porque é ele que possibilita que as categorias não se isolem em estruturas conceituais
puras, mas se mesclem de realidade e movimento.
Isso implica, portanto, tentar descobrir a quais fatores sociais, evidentemente articulados em uma
expressão propriamente pedagógica, sua existência corresponde, até para que se possa compreen-
der como se desenvolveu como ideia, que parece presidir todo o processo de escolarização e que,
como concreto, condensa uma articulação sócio-histórica.
Marx (2005, p. 151) alertou que “[é] certo que a arma da crítica não pode substituir a crítica das
armas”, o que, mutatis mutandis, coloca como um grande desafio apoiar-se, eventualmente, nos
resultados das avaliações externas para apreensão da escola, entretanto sem deixar de considerar a
hipótese de que esses resultados, talvez, não resultem da escola, e sim de outros elementos da rea-
lidade, incluindo interesses que não querem “revelar” a escola, mas “produzir” uma escola. Isso é
legítimo como luta política, mas não como apresentação pura e simples da realidade/verdade pela
precisão dos números. Nem sempre eles são precisos, nem sempre deles precisamos. E nesse sen-
tido são dignas de nota as contribuições de Sousa (1997a e 1997b) e Weiss (1982, 1991 e 1997).](https://image.slidesharecdn.com/indicadores-cgibr-tic-edu2010-110921081656-phpapp02/85/Indicadores-Comite-Gestor-Uso-da-internet-na-Educacao-85-320.jpg)


![151
2010 Survey on ICT Education
ARTICLES
multidirectional interactions, the creation of networks of knowledge production and co-authorship,
the expansion of teaching spaces and times, and educational techniques using different forms of
writing and languages.
As an ongoing trend, these tools and activities shall also be ingrained in Web 3.0 (Semantics
Web), favoring the so-called collective knowledge systems, “able to support collective knowledge
production through the analysis of collaborative human efforts” (Isotani et al., 2008, p. 6).
Finally, the use of a technology in particular affects how we teach, think and relate to other people,
as well as how the syllabus is conceived and enhanced. Kenski (2007) emphasizes:
The availability of a particular technology may induce profound changes in how teaching is
structured [...] there is a direct relationship between education and technology. We use many
types of technologies to learn and to know more and we need education to learn and to know
more about technology. (p. 44)
hence, introducing new technologies to teaching methods requires reviewing how the syllabus is
structured.
REFERENCES
ALMEIDA, Maria Elizabeth Bianconcini. “Tecnologias na educação: dos caminhos trilhados aos atuais desafios”.
BolemA – Boletim de Educação Matemática, 29(21), 2008.
______. “Transformações no trabalho e na formação docente na educação a distância on-line”. em Aberto,
Brasília, 23(84), pp. 67-77, Nov. 2010a.
______. Web Currículo, caminhos e narrativas. In: Proceedings of the Second Seminar curriculum web.
Published in CD-ROM. São Paulo: PUC-SP, 2010b.
English
BASSO, Maria Aparecida josé. Pedagogia digital na convergência do suporte “e” da educação: uma proposta de
modelo para logística de negócios sob demanda. Doctorate in production engineering. Florianópolis: Graduate
Program in Production Engineering of the Federal University of Santa Catarina, 2003.
CASTELLS, Manoel. “Internet e sociedade em rede”. In Moraes, D. (org.). Por uma outra comunicação. Rio de
janeiro: Record, 2003.
GADOTTI, Moacir. A escola frente à cultura midiática. In: OROFINO, Maria Izabel. mídias e mediação escolar:
pedagogia dos meios, participação e visibilidade. Guia da Escola Cidadã, v. 12. São Paulo: Cortez / Instituto
Paulo Freire, 2005. pp. 15-94.
ISOTANI, Seiji et al. Web 3.0: os rumos da web semântica e da Web 2.0 nos ambientes educacionais. In:
Proceedings of the xix the Brazilian Symposium on computer in education. SBIE, 2008.
KENSKI, Vani Moreira educação e tecnologias: o novo ritmo da informação. Campinas: Papirus, 2007.
LEIGh, Douglas. A Brief history of Instructional Design. In: iSPi global network chapter. 1998. Available at:
http://www.pignc-ispi.com/articles/education/brief%20history.htm.
LéVY, Pierre. cibercultura. Trad. Carlos Irineu da Costa. 2. ed. São Paulo: Editora 34, 2000.](https://image.slidesharecdn.com/indicadores-cgibr-tic-edu2010-110921081656-phpapp02/85/Indicadores-Comite-Gestor-Uso-da-internet-na-Educacao-153-320.jpg)

![183
2010 Survey on ICT Education
ARTICLES
In the perspective derived from Costa Pinto’s work, the country’s development requires the
government to take on a leading political role, specifically in planning. In this sociological tradition,
the development of Brazilian society is mediated by the government’s intentional and structured
action – i.e. through planning – as it is the one player capable of mobilizing society towards more
profound changes. Currently, this sociological perspective is implicit in the hegemonic propositions
of the Brazilian Conference on Education:
In view of CONAE’s purpose to mobilize society in favor of education, the reference document is
based on the need for the government and Brazilian society to face at least five major challenges
[...]. Therefore, the construction of a National Educational System requires reassessing the
role of federal agencies, ensuring the implementation of common educational guidelines
throughout the national territory, in an attempt to overcome regional inequalities. Thus, the
goal is to design national public policies on education that can be implemented nationwide by
regulating the specific role of each federal entity in a collaborative system, as well as the role of
private education by governmental agencies [...]. In the Brazilian education scenario, marked
by educational plans and projects, the proposition and implementation of policies must be
coordinated, as well as systematic planning initiatives. In turn, all of these must be articulated by
a national education policy aimed at following up, monitoring and assessing them. (Brazil, 2010)
Governmental initiatives and social mobilization are key to the creation of an educational system
– i.e. the promotion of structural changes, especially towards granting universal social rights – that
will entail common educational guidelines aimed at overcoming inequalities, by regulating the
power of federal entities. The 2010 National Conference also states that such goals require fiscal
and operational resources. however, the desired changes require social mobilization combined
with governmental action.
hence, the transformations in Brazilian society promoted by the expansion of democratic
governance and greater participation in the globalized capitalist economy must be analyzed. These
English
transformations have created new subjects and forms of sociability, which clash with the current
bureaucratic and corporate role or patronage system.
EdUCATIoN ANd dEvELoPmENT: ThE EmERGENCE
oF NEW FoRmS oF SoCIABILITY
By closely relating modernization and development, perceived in the projects and movements of
various collective subjectivities contributing to it, Domingues observes:
The recent developments of modernity in Brazil have been driven by powerful processes of
“detaching” subjects from more ingrained and stable relationships. Nowadays, even in terms
of the subjective structure of individuals and collectives, such as the workforce, processes of
individualization are more marked, the family structure changes, the role of women changes;
social “democratization” related to this individualization progresses, at least in terms of citizens](https://image.slidesharecdn.com/indicadores-cgibr-tic-edu2010-110921081656-phpapp02/85/Indicadores-Comite-Gestor-Uso-da-internet-na-Educacao-185-320.jpg)
![184
Survey on ICT Education 2010
ARTICLES
claiming their rightful position within society; the economy is affected by a demand for more
flexible and efficient processes; the expansion of consumption makes increasing options
available to individuals, as long as, naturally, they possess the minimum conditions to gain
access to them. Thus, individual existence is potentially broader. (Domingues, 1999, pp. 86-7)
Domingues’ analysis on modern processes of individualization relates them with the diffusion
of citizenship, viewed as a “real abstraction” in which individuals seek shelter. Detachment-
reattachment-further detachment processes are social development processes in contexts in which
the “neoliberal adjustment” of Latin American countries created obstacles to the universalization of
services that promote the rights of citizenship.
Authors such as Souza (2010) observe that one of results of these processes of detachment and
production of new identities is the emergence in the country of a working class of “fighters”, or
entrepreneurs, who have absorbed the concept of the “self-made man”. For these individuals, formal
education is an essential asset,2 despite the fact that their integration and inclusion in the workforce
is due to new forms of sociability, largely resulting from hard work and/or money. how does formal
education contribute to this social class’ individual/collective development project(s)?
Our research has shown that this class has found its place in the sun through extraordinary efforts:
Its ability to withstand fatigue from multiple jobs and work shifts, and double shifts studying and
working, its extraordinary capacity to save money and resist to immediate consumption and,
equally or even more importantly, its extraordinary belief in itself and in its own efforts [...].
Because this class is unable, unlike the dominant classes, to dedicate its time exclusively to
studying, overall its appropriation of educational and cultural knowledge is lower than in the
true middle class. (Souza, 2010, pp. 50-2)
The personal statements collected by Souza (2010) reveal that the appreciation of educational
access, attendance and learning may be viewed as subjective reactions to detachment situations,
English
experiences of injustice, as well as to the fact that schools have a socio-political role in providing
services that enable future individualization.
[...] investments in alternatives, especially in education, are very common from those hoping to
get a job that will bring them a little more stability [...] the individual knows that telemarketing
is not for life, but the fact that he/she has graduated from high school does not automatically
grant unrestricted access to tertiary education, especially not to the most prestigious and sought
2
Transformations in contemporary capitalism have not been automatic or obvious to anyone. Instead, throughout this decade,
the offspring of the “expressive revolution” of the 60s took over key positions in several countries, as opinion leaders and
central public figures in their societies. This generation, the first born in the context of quality public education for large social
sectors – a principle consolidated after the Second World War, as a byproduct of the Fordist commitment – was in itself a
supporting element to the virulent critique against the typical heteronomy of Fordist labor, as well as the hierarchical structure
of all leading capitalist and bourgeois institutions of the period (Souza, 2010, p. 38).](https://image.slidesharecdn.com/indicadores-cgibr-tic-edu2010-110921081656-phpapp02/85/Indicadores-Comite-Gestor-Uso-da-internet-na-Educacao-186-320.jpg)
![185
2010 Survey on ICT Education
ARTICLES
after institutions [...] his/her mother will, repeatedly, demand dedication and commitment to
his/her education in the hope that he/she [...] This individual experiences uncertainty, in view
of the recent poorly educated army of individuals prepared to occupy lower positions. (Souza,
2010: 71-8)
The role of development through the meritocratic pathway of education is both valued and/or
disregarded. Formal education is part of the design of projects for the future and/or the driver behind
the current scenario.
The respondent will have a child who has already studied for longer than the parents and will
have, according to him/her, a better future than that of a small retailer [...] there is a common
work-enabling element among these entrepreneurs that does not result from formal education
[...] the eleven-year-old daughter has a computer and Internet at home [...] is already thinking
about what to do in terms of work to fund his/her daughter’s tertiary education. (Souza, 2010)
Based on Foucault, the careful analysis of all statements collected by Souza (2010) reveals how
capitalism has penetrated our lives, as well as how educational institutions articulate in view of the
new forms of sociability. A Foucaultian reading of the statements collected from “Brazilian fighters”
reveals various government/education instruments available to individuals. The presence/absence of
formal education leads to the creation of a new rationale behind development in capitalism, which
is associated with individual progress. The most contemporary forms of sociability – unveiled in
Souza 2004 – paradoxically suggest that individuals take charge of formal education both by their
absence and their presence. The role of this institution may have been desirable and relevant, but
is not essential.
Partly through school, when the mathematical thinking he’d already been familiar with since
English
childhood – from selling his father’s agricultural produce – is developed, but more importantly
through his work experiences, Pedro develops the skills required for his economic survival in
contemporary capitalism. (Souza, 2010, p. 102)
dEvELoPmENT oF EdUCATIoNAL SYSTEmS:
ThE EmERGENCE oF NEW REGULATIoN modES
In line with these new forms of sociability, a movement known as New Public Management3 (NPM)
has been spreading globally, and it has laid out the foundation for the contemporary debate on
3
“The NPM is an administrative philosophy [] that emerged in the 1980s. [...] h&j asserted that the NPM influenced
governments’ agendas by establishing a climate of opinion in favor of its doctrines” (Barzelay, 2000, p. 235).](https://image.slidesharecdn.com/indicadores-cgibr-tic-edu2010-110921081656-phpapp02/85/Indicadores-Comite-Gestor-Uso-da-internet-na-Educacao-187-320.jpg)
![188
Survey on ICT Education 2010
ARTICLES
Nonetheless, another aspect of social development that also affects educational systems is the
emergence of a diverse public sphere, one that includes mass media and alternative means of
communication.
PUBLIC SPhERES: ThE FABRIC oF ThE RELATIoNShIP
BETWEEN EdUCATIoN ANd SoCIAL dEvELoPmENT
When describing the origin of the public sphere, habermas (1984) identified the divide between
individuals’ ability to think and the dimension where their material interests are fulfilled as the
first origin of the concept. According to the habermasian approach, between private interests and
governmental actions there is a space/time marked by an open and rational debate on the exercise
of political authority (Avritzer & Costa, 2004, p. 704).
habermas also highlights, in the context of the emergence of the bourgeois society, the role of the
science of finance and the administration doctrine in subjecting the private sphere to the public
sector.
Modern economy is no longer steered by the oikos, as markets have taken over the role of
people’s homes: the economy is transformed into a “commercial economy”. The Camerilistics of
the 18th century (its name comes from the term kamara, the treasury chamber of feudal lords),
the predecessor of the political economy, is, on one hand, partially at the same level as the
science of finance, and, on the other, as the agricultural doctrine, symptomatically known as part
of the “policy”, the management doctrine per se: so closely subordinated is the private sphere of
the bourgeois society to public bodies. [...]
Although this is mostly said due to a widespread prejudice, mercantilism in no way favors
governmental enterprises; on the contrary, the business policy requires, even if via bureaucratic
processes, the setting up and dissolution of private companies working capitalistically. Therefore,
English
the relationship between authorities and subjects eventually results in the peculiar ambivalence
of public regulation and private initiative. Thus, issues arise in the space where the government,
through ongoing administrative actions, keeps ties with private persons. [...] As, on one hand,
the private sector clearly shapes society in relation to the government, but, on the other hand, it
elevates the play of life beyond the confines of the domestic private power, making it something
of public interest, the zone of continuous administrative contact area becomes “critical” in that
it also requires the critical thinking of an audience (habermas, 1984, pp. 34-39)
In habermas’ perspective, the creation of the “management science” was a means for the government
to interfere with private life and consisted in a process of progressive nationalization of the living
world (habermas, 1984, p. 45). In this respect, Foucault’s analytical perspective on power, which
refuses to regard the government as a legal/political dimension detached from the social dimension,
and habermas’ overlapping of powers between the administrative power and the configuration of
the political public sphere, are combined in a different approach on the emergence of new ways of
regulating the relationship between education and development.](https://image.slidesharecdn.com/indicadores-cgibr-tic-edu2010-110921081656-phpapp02/85/Indicadores-Comite-Gestor-Uso-da-internet-na-Educacao-190-320.jpg)

![194
Survey on ICT Education 2010
ARTICLES
of Educational Performance (Anresc) – widely known as Prova Brazil – have been incorporated into
computing the Basic Education Development Index (Ideb)2, promoting similar initiatives in various
public education networks, particularly the Education Development Index in the State of São Paulo
(Idesp). One of Ideb’s aims is to disclose data from all public schools taking part in Prova Brasil,
thus enabling several sectors to be involved in the debate and research on their meanings and
potential explanations. Textually, Ideb’s proposal is extremely objective regarding its potential to
reveal the quality of schools, although, historically and politically, this concept, before and after its
publication, has revealed other manifestations in literature and educational policies.
Indeed, in this scenario, the results of external evaluations have been included in both public
policies and research, and represent the initial stages of defining what is broadly known as quality
of education. The very heart of the challenge for this study in understanding the potential setbacks
of research on education lies in the question: Would such results be able to assess the quality of
schools? hence, at least two new questions arise, one concerning the very object of these evaluations
– the school as a whole or just a facet, however important, of the work being done – and the other
related to how this object is investigated.
ChALLENGES IN dETERmINING STUdY oBjECTS
ANd ISSUES RELATEd To RESEARCh oN EdUCATIoN
Burke (2003, p. 183), analyzing the social process of knowledge production, indicates that, with
variations in time and cultures:
[...] there are only four reasons to accept propositions as true – sentiment, authority, reason and
sensory perception [...] In the early modern period, this balance tipped towards a combination of
reason and sensory perception [...] There was a new increasingly acute awareness of the method,
connected with the use of scientific instruments, the more systematic collection of particular
English
facts and the emergence of practical guides.
Although devoid of the hope heralded by Leibniz, namely of a universal mathematics to calculate
truth, but probably propelled by the very “spirit” that embodied the claim of reason to control the
senses in the search for evidence, no field of scientific research remained immune to adopting this
empirical approach as its leitmotiv. In the quest to uncover laws and patterns, albeit potential, the
inductive method, due to apparently favoring the search for evidence – in the eyes of those who seek
objective data – was invested with an “aura” of self protection for its relentless efforts to exhaust the
quest for evidence, thus uncovering causal relationships. One of the implications for research was
introducing near exhaustive trial and testing efforts in the search for truth. Induction is acceptable,
2
Ideb was instituted by Decree no. 6,074/2007 and is based on Fernandes (2007); it is calculated and disclosed to all public
schools with at least thirty students in years 4th to 8th of basic education, as well as other segments. For more information
see the Inep website, a body of the Ministry of Education in charge of implementing the Saeb (www.inep.gov.br).](https://image.slidesharecdn.com/indicadores-cgibr-tic-edu2010-110921081656-phpapp02/85/Indicadores-Comite-Gestor-Uso-da-internet-na-Educacao-196-320.jpg)
![196
Survey on ICT Education 2010
ARTICLES
question must be added to this list: how can we learn the answers to such questions? This refers us
to the procedures of standardized tests, to the preparation and processing of data which is still not
as precise as believed by users of its results. This aspect should be taken into greater consideration
in conceiving public policies.
hence, assuming that “simplifications” apply to some extent to these results – which, I stress, does
not take away the merit of their production – it is imperative to emphasize the ongoing investigative
task of positioning formal education within social practices. This, on one hand, creates room for
other fields of science to address it, but, on the other hand, requires education scientists to always
account for a set of issues that affect, limit, and impose restrictions and potentialities on school
educational activities, functioning as latent traits. Understanding this, in its multitude of variables,
does not always necessarily have to be the object of investigation, nor does it always have to be
discussed within the set of explanations, but overlooking its existence or impact may undermine
the elucidative effort of the investigative mission, especially because it is this acknowledgement
that will lead to the search for better options, alternatives to overcome didactic and pedagogical
impasses, to optimize processes, and etc. In the context of research on education, it is important to
confirm that evidence neither confirms nor refutes, as it may easily be assumed, the connections
that the results of these evaluations seem to indicate.
If the relationship among phenomena is characteristic of any science, in education this feature
takes on proportions that make it more difficult to determine research objects. Thus, the partial view
enabled by the object may, often, create “optical illusions” for researchers.
In educational research, its object is suffused with an almost incalculable range of influences, as it
is constituted as a social practice. Epistemological challenges arise in the gnosiologic sphere, due to
the nature and validity of such knowledge. Such assertions, far from undermining its heuristic merit,
function more as a caveat both for imperative generalizations – and powerless in the very terms they
refer to – and for hyper specializations approached by very few researchers.
Orlandi (1969, p. 16-17), concerned with the structural complexity of the research object of studies
on education, as well as the challenging role of “pedagogical awareness” in preventing theoretical
emphasis from fluctuating and venturing outside its own field, defined a potential reason for these
English
fluctuations in the “dispersive nature of the object of research on education [that] affects the role
of the hypothesis employed to study it”, because this nature “requires the previous construction
of a sufficiently broad and flexible theoretical structure to address the study object”. however,
inexorably, constructing a sufficiently solid theoretical framework to address issues requires opening
up to other sciences, including researcher training, but Orlandi (1969, p. 17) reiterates:
The fluctuating character of this expansion can only be controlled, not by denying the expansion,
[...] but by the increasing dynamism of other theories and human practices prompted by the
mobility of the research object itself in the study of education.
This attests the relevance of being more open to the possibility of adopting the grounded theory, as
suggested by Gibson and Brown (2009), as a baseline reference, and even as a research methodology
– a strategy to study figures more carefully, for example, avoiding the haste required by other models
to easily uncover cause-effect relationship.](https://image.slidesharecdn.com/indicadores-cgibr-tic-edu2010-110921081656-phpapp02/85/Indicadores-Comite-Gestor-Uso-da-internet-na-Educacao-198-320.jpg)
![197
2010 Survey on ICT Education
ARTICLES
At this stage, it is noteworthy that – despite misguided uses and generalizations and to avoid
simplistic criticisms claiming such resources to be a resurgence of “positivist” theories – results
from external evaluations elicit a debate on the study of education regarding quantitative methods,
which, as established by Ferrare (2011), were markedly refuted and almost abandoned due to what
was referred to as critical thinking in education, because their underlying tradition did not take into
account the broader social factors affecting education and reinforcing conservative mechanisms.
hence, the onset or resurgence of methodologies targeting education metrics – including
instruments, application and collection procedures, data, creation of databases, information,
arguments, knowledge, judgments, actions, consequences, impacts, and etc. – may lead to new
perspectives and challenges to educational research, notwithstanding broader social and political
concerns regarding the political nature of schools, which does not dismiss such methodological
contributions, nor render them unique in scientific research, as found in Pearl (2009) or in Shadish,
Cook & Campbell (2002).
ExTERNAL EvALUATIoNS vIEWEd AS ExPRESSIoNS oF EdUCATIoNAL PoLICIES
In view of the dilemma of whether or not to use the results of external evaluations as indicators, we
may resort to the words of josé Paulo Paes, who claims that “the road of critical understanding runs
between refusal and enthusiasm” (1985, p. 10). This proposition seems appropriate to approach a
subject that, having always had a political streak, becomes more prominent in educational policies
and, therefore, more likely to be approached with refusal and enthusiasm, which could potentially
cloud its analysis.
With poetic license and consolidating the political dimension of external evaluations, we may
borrow Secchin’s (1993, p. 216-217) words when he asks and answers:
What is the purpose of a poem? Perhaps to emphasize that there are always remnants, mistakes,
English
gaps, fractures in man’s perception of reality. To ignore them is to believe that words accurately
reflect things, to believe the validity of a homogeneous view that prevents individuals from
negotiating the meaning of gaps resulting from uncertainty and change that both words and we
need to stay alive [...] The divide between what is prosaic and what is poetic is managed by
several cultural vectors, however upsetting this is to hunters of the lost essence, and lost is the
essence for never having existed [...]
[...] poetry does not need to wail when confronted by the technological order, and accuse it of
being the enemy preventing its reach. [...] it remains with no other purpose than to attest that our
freedom is not only substantiated on the words we define ourselves in, but, more importantly, on
the words with which we learn to transform ourselves.
That is, figures per se do not yield an accurate understanding of reality, but they introduce another
means of exploring this reality, whose understanding – assuming it is feasible – will depend on how
we investigate it through the objects and questions we address. Although evaluations are different
from research, which is based on more immediate concerns and has bias as one its most prominent](https://image.slidesharecdn.com/indicadores-cgibr-tic-edu2010-110921081656-phpapp02/85/Indicadores-Comite-Gestor-Uso-da-internet-na-Educacao-199-320.jpg)
![198
Survey on ICT Education 2010
ARTICLES
features, as highlighted by Nevo (2006) – resulting in highly consistent results, given the conditions
under which they are employed – they may be viewed as strong footholds.
According to Brandão (2010), education is the formative or endocultural process of the human
species, a process our species cannot do without, lest it forgo its humanity. Nevertheless, in most
societies, the education of human beings has been connected with the idea that, to some degree
and extent, it must be related to schooling. Such a cultural setting suggests, in many contexts, that
speaking of education is inexorably speaking of schooling. Even when it is acknowledged that the
latter is subsumed to the former, the symbolic significance of schooling prevails, whether from the
perspective of social conservation or criticism, but never dissociated from politics, as uncovered by
Fernandes (2010), among many other authors.
The liberal values of equal opportunities, generally viewed as equal schooling opportunities,
emphasize the high prominence of schools in society; schools are the main arena where the
competition for positions in the hierarchical social structure takes place. Even in other ideological
perspectives, the notion of schooling as a promoter of human emancipation and linguistic integration,
or other objectives related to social equality, has probably become one of the key points in the
human rights agenda, to the extent that it is now mandatory. In the words of Marshall (1967), it is a
right which is also a prerequisite for the fulfillment of other rights, thereby justifying the – symbolic,
but perhaps physical – violence with which children are compelled to it.
Furthermore, in this context of the formative process, evaluation potentially figures as an object of
investigation. It may even assess, via meta-evaluation, if certain rules of the evaluation process have
not been violated, which, in turn, would jeopardize evaluative judgments and their consequences.
Moreover, given its congregational character, we can safely say that evaluation features as a
category of educational processes, requiring special attention, particularly for being concrete, that
is, because it synthesizes multiple determinations; In Marx’s words (1970, p. 206):
[...] it is concrete because it synthesizes several definitions, thus representing the unity of several
aspects. In our minds, therefore, it is viewed as a summary, a result, not as a starting point,
English
despite being the true origin, thus the origin of observation and imagination.
Additionally, to substantiate evaluation as a category, Cury (1985, p. 21) points out:
Categories are basic concepts aimed at reflecting general and essential aspects of reality, its
connections and relationships. They emerge from the analysis of multiple phenomena and are
highly general.
From the outset, it is notable that categories must correspond to the actual conditions of each
place and time. They cannot be defined as one and they do not have a purpose themselves. They
play a role as tools for the understanding of a concrete social reality, and this understanding is
only significant if embraced by the groups and agents involved in educational practice.](https://image.slidesharecdn.com/indicadores-cgibr-tic-edu2010-110921081656-phpapp02/85/Indicadores-Comite-Gestor-Uso-da-internet-na-Educacao-200-320.jpg)


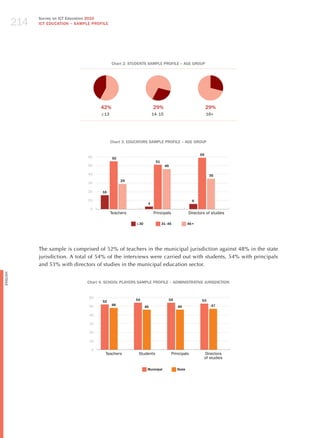
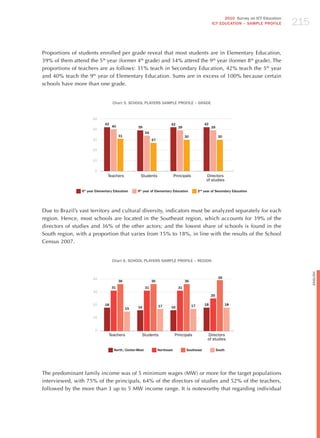
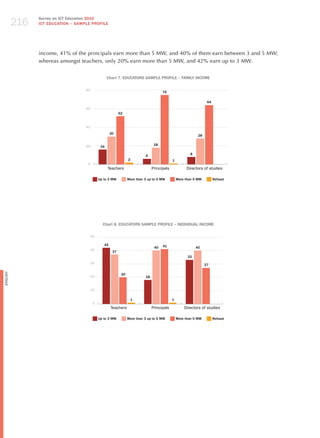

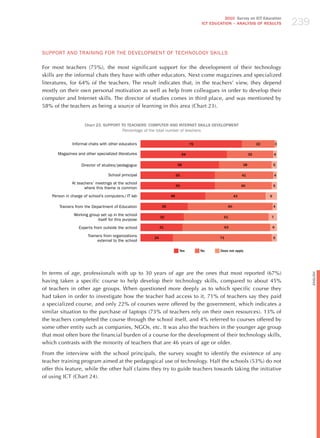
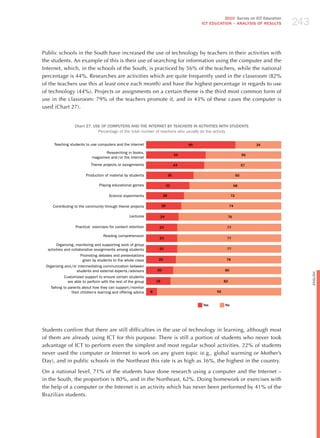


This document provides an overview of the key findings of the 2010 Survey on the Use of Information and Communication Technologies in Brazilian Schools (ICT Education 2010), which examined the use of digital technologies in Brazilian primary and secondary schools from the perspectives of teachers, students, principals and coordinators. The survey found that while access to computers and the internet in schools has increased, significant challenges remain regarding teacher training, appropriate educational content and equitable access across regions.


