Baixar para ler offline


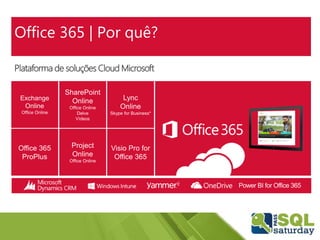

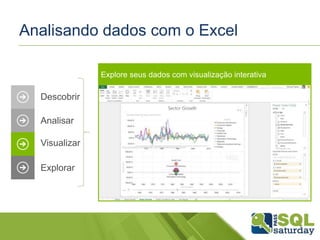
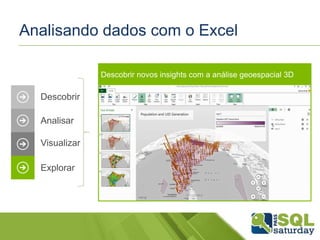

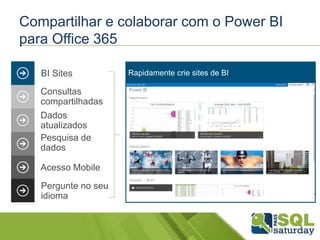
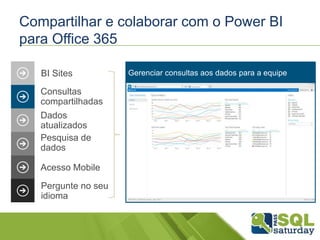
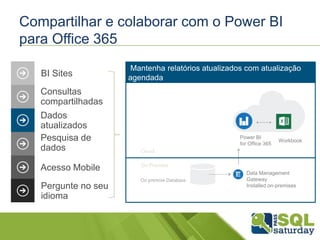
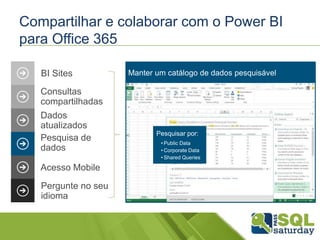

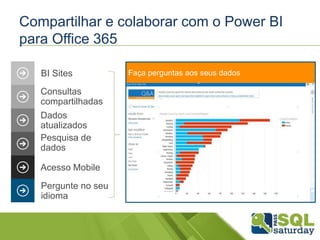
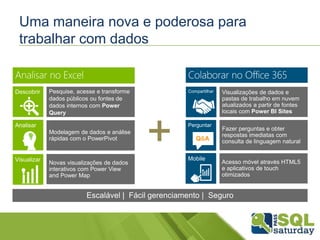


Este documento apresenta uma palestra sobre o Office 365 e Power BI. A agenda inclui uma visão geral do Office 365 e Power BI, demonstrações do Power Query e Power Map no Excel, e do Power BI para Sites do Office 365. O documento também discute os benefícios do Power BI para compartilhamento e colaboração de dados atualizados em nuvem.


![[PowerBI] Primeiros Passos](https://cdn.slidesharecdn.com/ss_thumbnails/powerbidesktopprimeirospassos-170729002609-thumbnail.jpg?width=640&height=640&fit=bounds)


