Baixar para ler offline


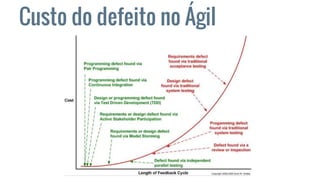


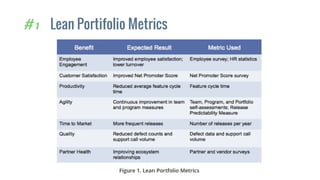

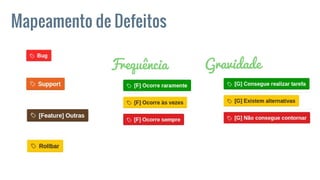


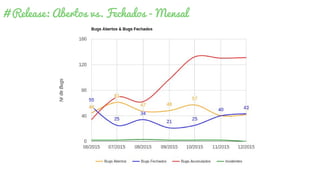
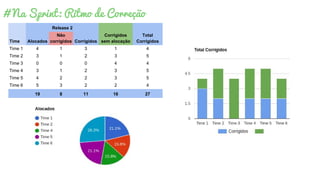

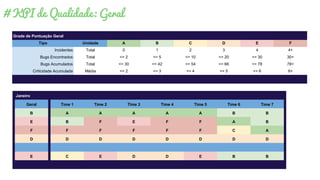
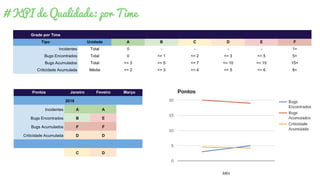


O documento discute métricas e KPIs para medir a qualidade no desenvolvimento ágil. Ele apresenta métricas para mapear defeitos por frequência e gravidade, pontos de criticidade por feature, bugs abertos versus fechados por release e ritmo de correção por time. Também mostra KPIs de qualidade geral e por time, com grades de pontuação para métricas como incidentes, bugs encontrados e acumulados, e criticidade acumulada. Por fim, sugere métricas por ciclo de defeitos encontrados em diferentes fases.


