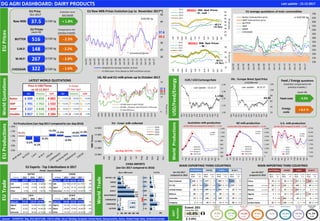
This document summarizes dairy market conditions and prices in the EU and globally. It shows that EU milk production increased slightly in January-September 2017 compared to the previous year. Global dairy exports from New Zealand and the US also increased over the same period. The document also charts changes in dairy commodity prices in the EU and globally in recent months, with butter and skim milk powder prices increasing and whole milk powder and cheddar prices decreasing compared to the previous 4 weeks. Fuel and feed costs in the EU saw little change over the same period.
Painel de controle Lácteos - Novembro 2017André Oliveira
This document summarizes dairy market conditions and prices in the EU and globally. EU milk production was up 0.0% in January-August 2017 compared to 2016. Butter, SMP and WMP prices in the EU declined 3.7-7.0% in the past 4 weeks. Global dairy quotations also declined in the past 15 days, with butter prices down 12.4% in the EU. Feed costs increased 0.6% and energy costs rose 3.0% in the past 4 weeks.
Gostaria de compartilhar este material com as informações de mercado de lácteos, mostrando os principais mercados e as principais commodities lácteas.
Interessante é notarmos que os preços pagos ao produtor aqui no Brasil não são tão diferentes dos preços pagos nos mercados americanos e europeus. Já a qualidade, vamos ficar devendo!
Profit drivers for successful grazing dairy businessesDownToEarthAdvice
This document discusses the key profit drivers for successful grazing dairy businesses. It finds that herd size and milk yield per cow are not strongly correlated with profitability, but rather profit is most influenced by production costs per liter of milk and the ratio of milk price to feed price. Production costs decrease as the proportion of grazed grass in the cow's diet increases. Farms that produce more milk from forage have lower costs per liter and higher overall profit margins. The key to profitability is growing and utilizing as much high-quality pasture as possible to lower feed costs.
Farmers Journal CAP meeting: Matt DempseyMaura Fay
Matt Dempsey's slides from the Farmers Journal CAP meetings.
With the key decisions on CAP reforms now in place, how the new system will work is becoming clear. In this series of CAP meetings, the Irish Farmers Journal is aiming to provide farmers with information on all aspects of CAP and how it will impact your direct payments for the next six years.
The document discusses income and production analysis for different farm types in Ireland from 2009 to 2011. It shows that the Single Farm Payment (SFP) component of farm income is changing and made up a large percentage of income for some farm types during this period. Charts and graphs show average income levels by farm type, cattle prices over time, cereal prices, milk prices, and changes in dairy farm numbers.
Presentation to Member State experts at management Committee Maura Fay
This document summarizes the milk market situation in the EU for the period of January-June 2014 compared to the same period in 2013. It reports that EU milk collections increased by 5.1% and production of butter, milk powder, and skimmed milk powder increased between 2-16%. It also provides data on EU milk prices, international dairy commodity prices, dairy trade flows, and EU dairy exports to Russia.
This document provides an overview and outlook of the global ethanol market in 2015:
- The global ethanol market is transitioning from a surplus in 2014 to a deficit in 2015 as production growth slows but consumption continues to rise.
- The US remains the dominant exporter but production is driven by margins, which are currently at low levels. Exports are growing while imports fade.
- Brazil's demand is growing but production is steady, leading exports to fade and imports to grow.
- The EU market is shrinking as production faces pressure from declining demand and rising input costs. Exports are growing while imports fade.
- Asia Pacific remains a deficit region with demand growing faster than production, making it reliant on imports
- Global milk output is moderating in the EU and NZ due to lower profitability and drought, though still rising in the US. Chinese demand is picking up with strong sales of NZ WMP.
- EU and global dairy prices have bottomed out and are set to recover slowly over coming months. The GDT auction had its fourth consecutive positive result.
- Milk prices have fallen significantly globally but challenges to profitability are helping to reduce output, especially in the EU and NZ. Irish milk prices are down 8 cents/liter but appear to have stabilized.
- Global milk output is moderating in NZ and EU but still rising in the US. Chinese demand is picking up and boosting NZ WMP sales.
- EU and global dairy prices are beginning to recover slightly from lows due to stronger exports and demand. However, prices remain weak overall.
- Irish milk prices fell nearly 8c/l over the past year but have stabilized recently as dairy market prices bottom out and begin increasing again. Further milk price reductions are now less likely.
Global dairy supplies continue to be strong due to high milk production in Europe, the US, China, Australia and New Zealand. While EU production is past peak levels, milk output increased significantly in Ireland in May. Demand is mixed as Chinese buyers have reduced purchases while demand is increasing in price-sensitive countries like Africa. Most EU dairy prices remain firm in early July but are more mixed elsewhere. The dairy outlook remains challenging with high stocks and weak prices, though drought conditions from a likely El Nino could help rebalance supplies if production declines in Australia and New Zealand in the coming months.
This document provides an overview of several livestock and poultry markets from presentations given at an industry conference. It includes the following key points:
- Pork demand remains strong though prices have increased, and the uptrend is expected to continue in the near future. Broiler and turkey production are also expected to increase in response to recent market conditions.
- Beef cow numbers have increased significantly after falling in recent years, and cattle supplies are more plentiful. Beef production is forecast to rise about 4% in both 2016 and 2017.
- Various poultry and livestock prices are discussed, with some expected to rise modestly while leg quarters and breast meat face pressure. Exports are a mixed bag across species
Mano zimbabwe poultry i ndustry in facts and figyres - 2018 report for per...RENETH MANO
Zimbabwe poultry industry is indeed open for business with recent 37% year on year growth in broiler meat production and consumption for period ending June 2018. The purchasing power of Zimbabwe's urban consumers is growing. The market preference for chicken meat is growing rapidly and eclipsing demand for beef in a country which traditionally defined "nyama" or meat as beef reserving chicken meat for special festivals and wedding ceremonies.! Lagging behind the quiet broiler meat revolution is the layer egg production where shortages of table eggs persist invitingly for private agribusiness investors. Zimbabwe is OPEN FOR BUSINESS and the early bird will catch the fattest Mopane worm salted and spiced for brave investors!
- Global dairy market prices have bottomed out and are expected to recover in the coming months driven by lower production in the EU and NZ and increased Chinese demand.
- EU, NZ, and US milk production is moderating due to lower profitability and drought while Chinese imports are rising.
- Recent GDT auction results and slightly firmer EU prices reflect expectations of tighter supply and demand recovery.
- However, low oil prices pose a risk to demand from oil producing countries while oversupply continues to weigh on prices in the near term.
- Global dairy market prices have bottomed out and are expected to recover in the coming months driven by lower production in the EU and NZ and increased Chinese demand.
- EU, NZ, and US milk production is moderating due to lower profitability while Chinese imports are rising.
- Dairy prices on the GDT and in the EU have increased slightly in recent auctions reflecting tighter supply and demand fundamentals.
- Irish and global milk prices remain weak but further price reductions are unlikely as market sentiment improves.
- Exports of oilmeals from India increased 64% in the first quarter of 2017 compared to the same period last year, totaling 499,140 tons.
- Major importers of Indian oilmeals in the first quarter included Vietnam, South Korea, Thailand, Germany, and other European countries.
- The port of Kandla exported the most oilmeals of any Indian port during this period at 301,094 tons, accounting for 60% of total exports.
This document summarizes the global cassava market and key trends affecting supply and demand. It discusses how cassava competes with substitutes like maize and how relative price changes impact land use and production. Recent developments like African Swine Fever reducing demand in China and the spread of cassava diseases like CMD threaten the industry. Data on production, exports, and prices in Thailand, Vietnam, Cambodia and other countries provide context on the structure and competitiveness of Asian cassava value chains.
- Global dairy markets continue to experience oversupply and weak prices as output grows slowly but stocks continue to build up due to sluggish demand. While some positive factors remain, the key question is how soon in 2016 prices may recover for farmers.
- EU output is still rising overall led by increases in Ireland, the Netherlands, and Poland, though some larger countries like France and Germany have seen declines or slower growth.
- Stocks of skim milk powder, butter, and cheese continue to build up in the EU and US through intervention and commercial stockpiles. Demand remains a positive factor looking forward to the holiday season but issues around Chinese demand and low oil prices dampen the outlook.
World dairy-commodity-prices - Novembro 2017André Oliveira
The document reports on dairy product price quotations from the EU, Oceania, and USA for butter, skim milk powder, whole milk powder, and cheddar cheese. It provides the most recent quotations from November 2017 and compares them to quotations from the previous month and year. Overall, butter and SMP prices increased from the previous year while WMP and cheddar prices decreased or remained steady. Charts on subsequent pages depict historical price quotations for each product from 2010 to the present.
This document summarizes the Estonian dairy sector in 2004. It finds that milk production had increased since the 1990s but was still lower than EU averages per cow. Most dairy cows lived in large herds of over 100 cows. Milk quality had greatly improved since 1995 with over 80% of milk now classified as higher or elite grades. The dairy industry consisted of 35 enterprises and 41 processing plants, with foreign investment in 5 companies. Cheese and butter production and consumption was lower in Estonia than elsewhere in Europe. Estonia ran a trade deficit for milk and dairy products with key trading partners including Germany, Netherlands, and Finland. The Estonian Dairy Association ran several promotional campaigns in 2004 emphasizing the nutritional benefits of milk
Trend Analysis of Dairy Farming in BangladeshNur E Sowrove
It includes trend analysis of dairy farming in Bangladesh with as much data collectible from BBS and other reports & journals of Government & Non Governmental research institutes.
This document provides an overview of the Estonian dairy sector from 1996-2005. It shows that milk production has increased over time, reaching over 1,000 tonnes by 2005, though it remains below the EU average of 7 tonnes per cow. The majority of dairy cows (55%) live in herds with 1-10 cows. The main dairy processors are Tallinna Piimatööstus, E-Piim, and Rakvere Piim. Consumption of dairy products such as milk, cheese, and yogurt has increased in Estonia but remains below levels in other European countries. Estonia exports dairy products like skim milk powder and whole milk powder, mainly to Netherlands, Germany, and
This document reports on dairy product price quotations in the EU, Oceania, and USA. It provides the most recent quotations for butter, skim milk powder, whole milk powder, and cheddar cheese, as well as the percentage changes from the previous quotation periods. Line graphs show trends in quotations for each product over time between the three regions.
This document discusses the resilient cotton production in Pakistan under changing climate conditions. It notes that cotton is a vital crop for Pakistan's economy and livelihoods. However, cotton production is facing challenges from abnormal weather like heavy rains and floods, as well as issues with seed quality, pests, and prices. The document analyzes cotton production and yield trends in Pakistan's provinces over time. It also examines how climate change is affecting temperatures and rainfall patterns, which is impacting when cotton is planted and harvested. The increasing temperatures are also encouraging the spread of new pests. Solutions are needed to help Pakistani cotton farmers adapt to these climate challenges.
The document discusses UK dairy export trends and opportunities. It finds that dairy exports have increased in value by 70% over the last 3 years and volumes exported outside the EU have doubled in the last 5 years. Key markets driving growth include Asia, North America, and Latin America. The EU remains important, with Ireland as the top destination. Upcoming trade fairs and export support initiatives aim to further boost dairy exports.
Growth trends and potential for crop and livestock productivity essp2
1) Agriculture contributes significantly to Ethiopia's economy and growth, accounting for 45% of GDP and 30.5% of GDP growth between 2004-2015. Crop output contributed 31% of GDP and livestock contributed 10%.
2) Livestock numbers have grown rapidly, with cattle growing at 3.8% annually on average. However, livestock productivity has stagnated, with milk and egg output per animal remaining largely unchanged.
3) Use of improved feeds and veterinary services has increased but remains relatively low, indicating potential for intensification and productivity growth in the livestock sector.
The document discusses the German and European pig meat sector. It notes that German pig production has increased 35% over 10 years and accounts for 23% of EU pigmeat production. However, pork production now exceeds consumption, creating a surplus. There are also plans to enlarge slaughtering capacity in Germany in the next two years. The main challenge for the future is gaining acceptance from citizens and consumers regarding animal welfare and sustainability issues.
Queijo artesanal x queijo industrializado existe mesmo esta disputa?André Oliveira
O documento discute as diferenças entre queijos artesanais e industriais no Brasil e no mundo. No Brasil, queijos artesanais não atendem aos padrões de qualidade da ANVISA e representam risco à saúde do consumidor, ao contrário dos queijos industriais. Na Europa, queijos artesanais têm limites máximos de produção e seguem os mesmos padrões sanitários do leite cru exigidos para queijos industriais, visando a segurança do consumidor.
Acidez titulavel no leite como interpretarAndré Oliveira
[1] A acidez titulável no leite mede a quantidade de ácido láctico, mas este parâmetro isolado não é um bom indicador da qualidade devido à variação na concentração de sólidos no leite. [2] Uma fazenda recebeu questionamentos sobre a acidez no seu leite de alta qualidade, apesar de todos os parâmetros estarem dentro dos padrões. [3] O pH é um indicador mais preciso do crescimento bacteriano que a acidez titulável, especialmente em leites com alto teor de sólidos.
Mais conteúdo relacionado
Semelhante a Quer entender o mercado de lácteos neste mês de Dezembro?
- Global milk output is moderating in the EU and NZ due to lower profitability and drought, though still rising in the US. Chinese demand is picking up with strong sales of NZ WMP.
- EU and global dairy prices have bottomed out and are set to recover slowly over coming months. The GDT auction had its fourth consecutive positive result.
- Milk prices have fallen significantly globally but challenges to profitability are helping to reduce output, especially in the EU and NZ. Irish milk prices are down 8 cents/liter but appear to have stabilized.
- Global milk output is moderating in NZ and EU but still rising in the US. Chinese demand is picking up and boosting NZ WMP sales.
- EU and global dairy prices are beginning to recover slightly from lows due to stronger exports and demand. However, prices remain weak overall.
- Irish milk prices fell nearly 8c/l over the past year but have stabilized recently as dairy market prices bottom out and begin increasing again. Further milk price reductions are now less likely.
Global dairy supplies continue to be strong due to high milk production in Europe, the US, China, Australia and New Zealand. While EU production is past peak levels, milk output increased significantly in Ireland in May. Demand is mixed as Chinese buyers have reduced purchases while demand is increasing in price-sensitive countries like Africa. Most EU dairy prices remain firm in early July but are more mixed elsewhere. The dairy outlook remains challenging with high stocks and weak prices, though drought conditions from a likely El Nino could help rebalance supplies if production declines in Australia and New Zealand in the coming months.
This document provides an overview of several livestock and poultry markets from presentations given at an industry conference. It includes the following key points:
- Pork demand remains strong though prices have increased, and the uptrend is expected to continue in the near future. Broiler and turkey production are also expected to increase in response to recent market conditions.
- Beef cow numbers have increased significantly after falling in recent years, and cattle supplies are more plentiful. Beef production is forecast to rise about 4% in both 2016 and 2017.
- Various poultry and livestock prices are discussed, with some expected to rise modestly while leg quarters and breast meat face pressure. Exports are a mixed bag across species
Mano zimbabwe poultry i ndustry in facts and figyres - 2018 report for per...RENETH MANO
Zimbabwe poultry industry is indeed open for business with recent 37% year on year growth in broiler meat production and consumption for period ending June 2018. The purchasing power of Zimbabwe's urban consumers is growing. The market preference for chicken meat is growing rapidly and eclipsing demand for beef in a country which traditionally defined "nyama" or meat as beef reserving chicken meat for special festivals and wedding ceremonies.! Lagging behind the quiet broiler meat revolution is the layer egg production where shortages of table eggs persist invitingly for private agribusiness investors. Zimbabwe is OPEN FOR BUSINESS and the early bird will catch the fattest Mopane worm salted and spiced for brave investors!
- Global dairy market prices have bottomed out and are expected to recover in the coming months driven by lower production in the EU and NZ and increased Chinese demand.
- EU, NZ, and US milk production is moderating due to lower profitability and drought while Chinese imports are rising.
- Recent GDT auction results and slightly firmer EU prices reflect expectations of tighter supply and demand recovery.
- However, low oil prices pose a risk to demand from oil producing countries while oversupply continues to weigh on prices in the near term.
- Global dairy market prices have bottomed out and are expected to recover in the coming months driven by lower production in the EU and NZ and increased Chinese demand.
- EU, NZ, and US milk production is moderating due to lower profitability while Chinese imports are rising.
- Dairy prices on the GDT and in the EU have increased slightly in recent auctions reflecting tighter supply and demand fundamentals.
- Irish and global milk prices remain weak but further price reductions are unlikely as market sentiment improves.
- Exports of oilmeals from India increased 64% in the first quarter of 2017 compared to the same period last year, totaling 499,140 tons.
- Major importers of Indian oilmeals in the first quarter included Vietnam, South Korea, Thailand, Germany, and other European countries.
- The port of Kandla exported the most oilmeals of any Indian port during this period at 301,094 tons, accounting for 60% of total exports.
This document summarizes the global cassava market and key trends affecting supply and demand. It discusses how cassava competes with substitutes like maize and how relative price changes impact land use and production. Recent developments like African Swine Fever reducing demand in China and the spread of cassava diseases like CMD threaten the industry. Data on production, exports, and prices in Thailand, Vietnam, Cambodia and other countries provide context on the structure and competitiveness of Asian cassava value chains.
- Global dairy markets continue to experience oversupply and weak prices as output grows slowly but stocks continue to build up due to sluggish demand. While some positive factors remain, the key question is how soon in 2016 prices may recover for farmers.
- EU output is still rising overall led by increases in Ireland, the Netherlands, and Poland, though some larger countries like France and Germany have seen declines or slower growth.
- Stocks of skim milk powder, butter, and cheese continue to build up in the EU and US through intervention and commercial stockpiles. Demand remains a positive factor looking forward to the holiday season but issues around Chinese demand and low oil prices dampen the outlook.
World dairy-commodity-prices - Novembro 2017André Oliveira
The document reports on dairy product price quotations from the EU, Oceania, and USA for butter, skim milk powder, whole milk powder, and cheddar cheese. It provides the most recent quotations from November 2017 and compares them to quotations from the previous month and year. Overall, butter and SMP prices increased from the previous year while WMP and cheddar prices decreased or remained steady. Charts on subsequent pages depict historical price quotations for each product from 2010 to the present.
This document summarizes the Estonian dairy sector in 2004. It finds that milk production had increased since the 1990s but was still lower than EU averages per cow. Most dairy cows lived in large herds of over 100 cows. Milk quality had greatly improved since 1995 with over 80% of milk now classified as higher or elite grades. The dairy industry consisted of 35 enterprises and 41 processing plants, with foreign investment in 5 companies. Cheese and butter production and consumption was lower in Estonia than elsewhere in Europe. Estonia ran a trade deficit for milk and dairy products with key trading partners including Germany, Netherlands, and Finland. The Estonian Dairy Association ran several promotional campaigns in 2004 emphasizing the nutritional benefits of milk
Trend Analysis of Dairy Farming in BangladeshNur E Sowrove
It includes trend analysis of dairy farming in Bangladesh with as much data collectible from BBS and other reports & journals of Government & Non Governmental research institutes.
This document provides an overview of the Estonian dairy sector from 1996-2005. It shows that milk production has increased over time, reaching over 1,000 tonnes by 2005, though it remains below the EU average of 7 tonnes per cow. The majority of dairy cows (55%) live in herds with 1-10 cows. The main dairy processors are Tallinna Piimatööstus, E-Piim, and Rakvere Piim. Consumption of dairy products such as milk, cheese, and yogurt has increased in Estonia but remains below levels in other European countries. Estonia exports dairy products like skim milk powder and whole milk powder, mainly to Netherlands, Germany, and
This document reports on dairy product price quotations in the EU, Oceania, and USA. It provides the most recent quotations for butter, skim milk powder, whole milk powder, and cheddar cheese, as well as the percentage changes from the previous quotation periods. Line graphs show trends in quotations for each product over time between the three regions.
This document discusses the resilient cotton production in Pakistan under changing climate conditions. It notes that cotton is a vital crop for Pakistan's economy and livelihoods. However, cotton production is facing challenges from abnormal weather like heavy rains and floods, as well as issues with seed quality, pests, and prices. The document analyzes cotton production and yield trends in Pakistan's provinces over time. It also examines how climate change is affecting temperatures and rainfall patterns, which is impacting when cotton is planted and harvested. The increasing temperatures are also encouraging the spread of new pests. Solutions are needed to help Pakistani cotton farmers adapt to these climate challenges.
The document discusses UK dairy export trends and opportunities. It finds that dairy exports have increased in value by 70% over the last 3 years and volumes exported outside the EU have doubled in the last 5 years. Key markets driving growth include Asia, North America, and Latin America. The EU remains important, with Ireland as the top destination. Upcoming trade fairs and export support initiatives aim to further boost dairy exports.
Growth trends and potential for crop and livestock productivity essp2
1) Agriculture contributes significantly to Ethiopia's economy and growth, accounting for 45% of GDP and 30.5% of GDP growth between 2004-2015. Crop output contributed 31% of GDP and livestock contributed 10%.
2) Livestock numbers have grown rapidly, with cattle growing at 3.8% annually on average. However, livestock productivity has stagnated, with milk and egg output per animal remaining largely unchanged.
3) Use of improved feeds and veterinary services has increased but remains relatively low, indicating potential for intensification and productivity growth in the livestock sector.
The document discusses the German and European pig meat sector. It notes that German pig production has increased 35% over 10 years and accounts for 23% of EU pigmeat production. However, pork production now exceeds consumption, creating a surplus. There are also plans to enlarge slaughtering capacity in Germany in the next two years. The main challenge for the future is gaining acceptance from citizens and consumers regarding animal welfare and sustainability issues.
Semelhante a Quer entender o mercado de lácteos neste mês de Dezembro? (20)
Queijo artesanal x queijo industrializado existe mesmo esta disputa?André Oliveira
O documento discute as diferenças entre queijos artesanais e industriais no Brasil e no mundo. No Brasil, queijos artesanais não atendem aos padrões de qualidade da ANVISA e representam risco à saúde do consumidor, ao contrário dos queijos industriais. Na Europa, queijos artesanais têm limites máximos de produção e seguem os mesmos padrões sanitários do leite cru exigidos para queijos industriais, visando a segurança do consumidor.
Acidez titulavel no leite como interpretarAndré Oliveira
[1] A acidez titulável no leite mede a quantidade de ácido láctico, mas este parâmetro isolado não é um bom indicador da qualidade devido à variação na concentração de sólidos no leite. [2] Uma fazenda recebeu questionamentos sobre a acidez no seu leite de alta qualidade, apesar de todos os parâmetros estarem dentro dos padrões. [3] O pH é um indicador mais preciso do crescimento bacteriano que a acidez titulável, especialmente em leites com alto teor de sólidos.
Células somáticas no leite - Somaticell e o uso na indústriaAndré Oliveira
Controlar células somáticas no leite é um fator de competitividade na indústria de lácteos.
Somaticell é um método criado e patenteado no Brasil e que permite uma estimativa precisa e exata das células somáticas em cada etapa do processo.
Também é mostrada uma forma de interpretar o resultado da contagem de células somáticas no tanque e a provável contaminação do leite por vacas com mastite.
The United States National Residue Program for meat, poultry, and egg products is an interagency program, administered by FSIS, that examines food samples for the presence of several different chemical compound classes, including veterinary drugs, pesticides, and metals. In collaboration with its Federal partners, FSIS selected the chemical compounds based on their potential public health concern. All samples were analyzed at one of three ISO 17025-accredited FSIS laboratories.
This report presents results from October 2014 to September 2015.
O Programa Nacional de Resíduos dos Estados Unidos para carne, aves e produtos derivados de ovos é um programa interinstitucional, administrado pelo FSIS, que examina amostras de alimentos quanto à presença de várias classes de compostos químicos, incluindo medicamentos veterinários, pesticidas e metais. Em colaboração com seus parceiros federais, o FSIS selecionou os compostos químicos com base em seu potencial problema de saúde pública. Todas as amostras foram analisadas em um dos três laboratórios FSIS credenciados pela ISO 17025.
Este relatório apresenta resultados de outubro de 2014 a setembro de 2015.
O documento discute a importância da higienização na indústria de alimentos para prevenção de contaminações. Aborda os principais microrganismos patogênicos veiculados por alimentos e os riscos à saúde que podem ocorrer por consumo de alimentos contaminados. Também apresenta os principais métodos e produtos utilizados para a higienização de equipamentos e instalações industriais.
Ocorrências de salmonella notificadas pela europa em 2017 procedentes do brasilAndré Oliveira
Arquivo com todas as ocorrências de Salmonella positiva nos alimentos exportados do Brasil para a Europa e que foram notificados pela Autoridade Européia de Segurança dos Alimentos.
Com estes dados você pode verificar se a sua categoria de alimentos se enquadra em qual nível de risco.
Lista de violações de resíduos de drogas veterináriasAndré Oliveira
Relação atualizada em 22/11/2017, dos frigoríficos americanos onde forma encontrados resíduos de drogas veterinárias, acima dos limites máximos permitidos.
Este tipo de ferramenta ajuda a todos os profissionais da qualidade a fazerem a gestão de processos e análises de riscos de uma forma objetiva, mostrando para os consumidores a transparência na gestão dos riscos em alimentos.
Global sugar production is forecast to reach a record 185 million tons in MY 2017/18, up 13 million tons from the previous year. This record production is driven by large increases in Brazil, India, the EU, and China and will support record global consumption of 174 million tons and exports of 62 million tons. China has implemented a safeguard measure limiting sugar imports, causing China to drop from the largest sugar importer to the second largest behind Indonesia.
Controle ambiental de microrganismos e formação de biofilmeAndré Oliveira
Compartilho esta palestra que apresentei no excelente IV Reencontro da Liner Consultoria, ocorrido em outubro de 2017, no qual falei sobre o monitoramento ambiental de microrganismos, biofilmes (biofouling) e os impactos que estes podem causar aos negócios e a saúde do consumidor.
Este tipo de ocorrência é extremamente preocupante, pois tem o aspecto cumulativo, o que explica a ocorrência de surtos de contaminações e as "contaminações inexplicáveis" nas indústrias de alimentos.
FSIS RESIDUE VIOLATION INFORMATION SYSTEM August 03, 2017 06:10:02 WEEKLY R...André Oliveira
Relatório do FSIS-USDA - Serviço de Inspeção do Ministério da Agricultura dos Estados Unidos - com a lista da ocorrência de violações das ocorrências de resíduos em bovinos. Interessante a liberdade de informações públicas para que os profissionais da área, imprensa e consumidores possam se informar sobre a rela situação do setor.
Lembrando que temos um programa equivalente no Brasil, o PNCRC, que dá alguma informação sobre a ocorrência das contaminações, porém sem revelar o nome da empresa responsável pelo evento.
Resultados do Brasil no PISA 2015 - Programa Internacional para Avaliação de ...André Oliveira
O desempenho dos alunos brasileiros no PISA está abaixo da média da OCDE em ciências, leitura e matemática. As médias do Brasil nessas áreas se mantiveram estáveis desde as últimas avaliações em 2006 e 2000, respectivamente. O gasto por aluno no Brasil é menor que a média da OCDE e diferenças socioeconômicas impactam o desempenho dos estudantes.
O documento discute as novas diretrizes do Regulamento de Inspeção Industrial e Sanitária de Produtos de Origem Animal (RIISPOA) no Brasil. O RIISPOA agora exige que as empresas implementem programas de autocontrole para garantir a qualidade e segurança dos alimentos. Estes programas devem incluir análise de riscos, rastreabilidade, boas práticas de fabricação e outros conceitos. O documento fornece recomendações sobre como as empresas devem gerenciar seus programas de autocontrole de acordo com as novas exigências regulató
Heritage Conservation.Strategies and Options for Preserving India HeritageJIT KUMAR GUPTA
Presentation looks at the role , relevance and importance of built and natural heritage, issues faced by heritage in the Indian context and options which can be leveraged to preserve and conserve the heritage.It also lists the challenges faced by the heritage due to rapid urbanisation, land speculation and commercialisation in the urban areas. In addition, ppt lays down the roadmap for the preservation, conservation and making value addition to the available heritage by making it integral part of the planning , designing and management of the human settlements.
Quer entender o mercado de lácteos neste mês de Dezembro?
1. DG AGRI DASHBOARD: DAIRY PRODUCTS Last update : 15.12.2017
100
150
200
250
300
350
400
450
500
550
600
650
700
Jan03
Jan04
Jan05
Jan06
Jan07
Jan08
Jan09
Jan10
Jan11
Jan12
Jan13
Jan14
Jan15
Jan16
Jan17
in EUR/100 kg
EU average quotations of main commodities
Butter Intervention price
SMP Intervention price
BUTTER
SMP
WMP
CHEDDAR
WorldQuotationsEUPrices
GDT
Auction
EUProductionsEUTrade
+0.4%
-3.5%
-6.1%
-0.2%
+2.2%
+1.6%
-0.9%
+0.6% +1.3%
- 15%
- 10%
- 5%
+ 0%
+ 5%
+ 10%
EU Productions (Jan-Sep2017 comparedto Jan-Sep2016)
WorldProductions
WorldTrade
USD/Feed/Energy
Feed / Energy quotations
(evolution compared to the
previous 4 weeks )
Feed costs
Energy
costs
- 0.3%
+ 0.4 %
Qty in
ktons
% 2017
/16
Qty in
ktons
% 2017
/16
Qty in
ktons
% 2017
/16
Qty in
ktons
% 2017
/16
New Zealand 341 - 15% 277 - 2% 302 - 13% 1 006 - 0%
EU-28 153 - 20% 695 + 4% 663 + 39% 337 + 2%
United States 26 + 13% 286 + 22% 493 + 0% 22 - 15%
Belarus 66 + 1% 157 - 9% 96 + 3% 25 + 1%
Australia 13 - 47% 136 + 2% 130 - 0% 44 - 22%
Uruguay 7 - 23% 26 - 16% 11 - 28% 82 - 26%
MAIN EXPORTING THIRD COUNTRIES
BUTTER(OIL) CHEESE S.M.P. W.M.P.
Jan-Oct 2017
compared to 2016 Qty in
ktons
% 2017
/16
Qty in
ktons
% 2017
/16
Qty in
ktons
% 2017
/16
Qty in
ktons
% 2017
/16
China 79 + 15% 93 + 19% 217 + 35% 418 + 18%
Russia up to Sep 82 + 13% 163 - 3% 100 - 6% 40 + 27%
Mexico up to Sep 33 - 11% 91 + 1% 250 + 19% 2 - 77%
Algeria up to Aug 7 - 25% 15 - 40% 113 + 47% 192 + 29%
Japan 7 - 30% 222 + 5% 45 + 57% 0 - 10%
United States 35 - 11% 148 - 10% 1 + 6% 20 + 50%
MAIN IMPORTING THIRD COUNTRIES
BUTTER(OIL) CHEESE S.M.P. W.M.P.
Jan-Oct 2017
compared to 2016
10 000
11 000
12 000
13 000
14 000
Jan
Feb
Mar
Apr
May
Jun
Jul
Aug
Sep
Oct
Nov
Dec
1000Tonnes
EU - Cows' milk collected
2014
2015
2016
2017
Jan-Sep 2017/16 : + 0.4%
Sources : EUROSTAT, Reg. (EU) 2017/1185, Clal.it,USDA, Lto.nl, Nasdaq, European Central Bank, Dairyaustralia, Dcanz, Global Trade Atlas, Globaldairytrade.
500
600
700
800
900
1 000
1 100
1 200
Jul
Aug
Sep
Oct
Nov
Dec
Jan
Feb
Mar
Apr
May
Jun
in 1000
tonnes
Australian milk production
2014/15
2015/16
2016/17
2017/18
Jul-Oct 2017/18 compared to 2016/17 : + 2.7%
0
500
1 000
1 500
2 000
2 500
3 000
3 500
Jun
Jul
Aug
Sep
Oct
Nov
Dec
Jan
Feb
Mar
Apr
May
in 1000
tonnes
NZ milk production
2014/15
2015/16
2016/17
2017/18
Jun-Oct 2017/18 compared to 2016/17 : + 0.9%
7 000
7 250
7 500
7 750
8 000
8 250
8 500
8 750
Jan
Feb
Mar
Apr
May
Jun
Jul
Aug
Sep
Oct
Nov
Dec
in 1000
tonnes
U.S. milk production
2014
2015
2016
2017
Jan-Oct 2017 compared to 2016 : + 1.5%
20
25
30
35
40
45
50
Jan01
Jan02
Jan03
Jan04
Jan05
Jan06
Jan07
Jan08
Jan09
Jan10
Jan11
Jan12
Jan13
Jan14
Jan15
Jan16
Jan17
EUR/100 kg
Weighted EU Average (real fat content)
EU Milk Equiv. Price (based on SMP and Butter prices)
* : provisional figures
EU Raw Milk Prices Evolution (up to November 2017*)
37.6
35.2
20
25
30
35
40
45
50
55
JAN
FEB
MAR
APR
MAY
JUN
JUL
AUG
SEP
OCT
NOV
DEC
EUR/100kg
WEEKLY Milk Spot Prices
- IT, Lodi -
2014
2015
2016
2017
40.3 €
(10 Dec)
10
20
30
40
50
JAN
FEB
MAR
APR
MAY
JUN
JUL
AUG
SEP
OCT
NOV
DEC
EUR/100kg
WEEKLY Milk Spot Prices
- NL -
2014
2015
2016
2017
26.3 €
(10 Dec)
20
40
60
80
100
120
Apr
Jul
Oct
Jan
Apr
Jul
Oct
Jan
Apr
Jul
Oct
Jan
Apr
Jul
Oct
Last update : 10.12.17
OIL : Europe Brent Spot Price
(USD/Barrel)
63.45
0
25
50
2001
2002
2003
2004
2005
2006
2007
2008
2009
2010
2011
2012
2013
2014
2015
2016
2017
EUR/100kg
US Milk (class III adj 4.2% fat)
NZ Milk - (Fonterra, adj 4.2% fat & 3.35% prot)
EU Raw Milk price
Source :
33.0
37.5
35.9
US, NZ and EU milk prices up to October 2017
1.00
1.10
1.20
1.30
1.40
Apr
Jul
Oct
Jan
Apr
Jul
Oct
Jan
Apr
Jul
Oct
Jan
Apr
Jul
Oct
EUR / USDExchangeRate
1.1766
Last Update : 13.12.17
EU Oceania USA EU Oceania USA
Butter 6 300 4 850 4 882 + 0.2% - 10.6% - 0.0%
SMP 1 791 1 763 1 550 + 0.2% + 2.2% - 1.1%
WMP 3 237 2 838 3 020 - 0.2% + 0.4% nc
Cheddar 3 857 3 763 3 284 - 1.3% - 5.0% - 7.2%
Price in USD/Tonne
on 10.12.2017
% change
(15 days ago)
LATEST WORLD QUOTATIONS
in Tonnes 2015 2016 2017 in Tonnes 2015 2016 2017
Extra-EU 108 977 142 955 119 070 - 17% Extra-EU 589 118 665 932 695 280 +4%
USA 14 948 15 408 23 269 +51% USA 115 798 117 097 116 759 - 0%
Saudi Arabia 11 439 17 024 8 580 - 50% Japan 56 792 64 712 80 810 +25%
China 4 760 6 239 7 023 +13% Switzerland 45 352 47 203 50 439 +7%
in Tonnes 2015 2016 2017 in Tonnes 2015 2016 2017
Extra-EU 578 738 478 678 663 481 +39% Extra-EU 340 080 329 558 337 014 + 2%
Algeria 96 826 72 042 104 238 +45% Algeria 29 318 27 413 61 943 +126%
China 42 451 39 401 64 901 +65% Oman 49 944 43 993 34 620 - 21%
Indonesia 39 153 39 936 53 725 +35% China 15 570 17 137 20 314 +19%
W.M.P.
EU Exports - Top 3 destinations in 2017
Period : January-October
BUTTER CHEESE
S.M.P.
+ 15%
+ 19%
+ 35%
+ 18%
+ 6%
- 16%
+ 33%
+ 1%
69
78
161
355
410
18
16
73
79
93
217
418
433
15
21
74
0 100 200 300 400 500
BUTTER + OIL
CHEESE
S.M.P.
W.M.P.
WHEYPOWDER
CASEIN(ATE)S
CONDENSED
LACTOSE
Qty in '000 tonnes
2016
2017
10
15
23
2
34
27
72
22
12
14
29
3
35
31
70
22
0 100
% of EU
CHINA IMPORTS
(Jan-Oct 2017 compared to 2016)
37.5Raw Milk €/100 kg
EU Price Evolution since
last month
+ 1.8%
516BUTTER €/100 kg - 2.3%
148S.M.P. €/100 kg - 2.2%
267W.M.P. €/100 kg - 2.8%
322CHEDDAR €/100 kg - 1.6%
Compared to the
previous 4 weeks
EU Prices
(week 49)
(week 49)
Oct-2017
Average price (USD/MT, FAS)
Anhydrous
Milk Fat
-0.6%
$ 6 836
Butter
-11.1%
$ 4 575
Butter Milk
Powder
+4.3%
$ 1 957
Cheddar
-3.9%
$ 3 696
Lactose
n/a
Rennet Casein
+3.4%
$ 4 879
Skim Milk
Powder
+4.7%
$ 1 774
Whole Milk
Powder
+1.7%
$ 2 830
Event 201
5 December 2017
+0.4%
$ 3 091
2. back to DashboardNext
onsEUPrices
Jan01
37.5Raw Milk €/100 kg
EU Price Evolution since
last month
+ 1.8%
516BUTTER €/100 kg - 2.3%
148S.M.P. €/100 kg - 2.2%
267W.M.P. €/100 kg - 2.8%
322CHEDDAR €/100 kg - 1.6%
Compared to the
previous 4 weeks
EU Prices
(week 49)
Oct-2017
Source : DG AGRI – Reg. 2017/1185 Art. 11 & 12
3. Source : DG AGRI – Reg. 2017/1185 Art. 12(a) - Annex II.4(a)
20
25
30
35
40
45
50
Jan01
Jan02
Jan03
Jan04
Jan05
Jan06
Jan07
Jan08
Jan09
Jan10
Jan11
Jan12
Jan13
Jan14
Jan15
Jan16
Jan17
EUR/100 kg
Weighted EU Average (real fat content)
EU Milk Equiv. Price (based on SMP and Butter prices)
* : provisional figures
EU Raw Milk Prices Evolution (up to November 2017*)
37.6
35.2
Previous
Page
Next back to Dashboard
6. Source : DG AGRI, USDA
EU Oceania USA EU Oceania USA
Butter 6 300 4 850 4 882 + 0.2% - 10.6% - 0.0%
SMP 1 791 1 763 1 550 + 0.2% + 2.2% - 1.1%
WMP 3 237 2 838 3 020 - 0.2% + 0.4% nc
Cheddar 3 857 3 763 3 284 - 1.3% - 5.0% - 7.2%
Price in USD/Tonne
on 10.12.2017
% change
(15 days ago)
LATEST WORLD QUOTATIONS
Previous
Page
Next back to Dashboard
7. Source : DG AGRI, LTO Nederland
0
25
50
2001
2002
2003
2004
2005
2006
2007
2008
2009
2010
2011
2012
2013
2014
2015
2016
2017
EUR/100kg
US Milk (class III adj 4.2% fat)
NZ Milk - (Fonterra, adj 4.2% fat & 3.35% prot)
EU Raw Milk price
Source :
33.0
37.5
35.9
US, NZ and EU milk prices up to October 2017
Previous
Page
Next back to Dashboard
8. Source : European Central Bank
Sources : Feed : DG AGRI, Clal.it
Energy : DG ENERGY
Source : Nasdaq
Feed / Energy quotations
(evolution compared to the
previous 4 weeks )
Feed costs
Energy
costs
- 0.3%
+ 0.4 %
(week 49)
1.00
1.10
1.20
1.30
1.40
Apr
Jul
Oct
Jan
Apr
Jul
Oct
Jan
Apr
Jul
Oct
Jan
Apr
Jul
Oct
EUR / USDExchangeRate
1.1766
Last Update : 13.12.17
20
40
60
80
100
120
Apr
Jul
Oct
Jan
Apr
Jul
Oct
Jan
Apr
Jul
Oct
Jan
Apr
Jul
Oct
Last update : 10.12.17
OIL : Europe Brent Spot Price
(USD/Barrel)
63.45
Previous
Page
Next back to Dashboard
10. Source : EUROSTAT, Reg. (EC) No 479/2010 Art. 1(a)1
10 000
11 000
12 000
13 000
14 000
Jan
Feb
Mar
Apr
May
Jun
Jul
Aug
Sep
Oct
Nov
Dec
1000Tonnes
EU - Cows' milk collected
2014
2015
2016
2017
Jan-Sep 2017/16 : + 0.4%
Next
Page
Previous
back to Dashboard
11. 500
600
700
800
900
1 000
1 100
1 200
Jul
Aug
Sep
Oct
Nov
Dec
Jan
Feb
Mar
Apr
May
Jun
in 1000
tonnes
Australian milk production
2014/15
2015/16
2016/17
2017/18
Jul-Oct 2017/18 compared to 2016/17 : + 2.7%
0
500
1 000
1 500
2 000
2 500
3 000
3 500
Jun
Jul
Aug
Sep
Oct
Nov
Dec
Jan
Feb
Mar
Apr
May
in 1000
tonnes
NZ milk production
2014/15
2015/16
2016/17
2017/18
Jun-Oct 2017/18 compared to 2016/17 : + 0.9%
7 000
7 250
7 500
7 750
8 000
8 250
8 500
8 750
Jan
Feb
Mar
Apr
May
Jun
Jul
Aug
Sep
Oct
Nov
Dec
in 1000
tonnes
U.S. milk production
2014
2015
2016
2017
Jan-Oct 2017 compared to 2016 : + 1.5%
Source : Dairyaustralia, Dcanz, USDA
Previous
Page
Next back to Dashboard
12. in Tonnes 2015 2016 2017 in Tonnes 2015 2016 2017
Extra-EU 108 977 142 955 119 070 - 17% Extra-EU 589 118 665 932 695 280 + 4%
USA 14 948 15 408 23 269 + 51% USA 115 798 117 097 116 759 - 0%
Saudi Arabia 11 439 17 024 8 580 - 50% Japan 56 792 64 712 80 810 + 25%
China 4 760 6 239 7 023 + 13% Switzerland 45 352 47 203 50 439 + 7%
in Tonnes 2015 2016 2017 in Tonnes 2015 2016 2017
Extra-EU 578 738 478 678 663 481 + 39% Extra-EU 340 080 329 558 337 014 + 2%
Algeria 96 826 72 042 104 238 + 45% Algeria 29 318 27 413 61 943 + 126%
China 42 451 39 401 64 901 + 65% Oman 49 944 43 993 34 620 - 21%
Indonesia 39 153 39 936 53 725 + 35% China 15 570 17 137 20 314 + 19%
W.M.P.
EU Exports - Top 3 destinations in 2017
Period : January-October
BUTTER CHEESE
S.M.P.
Source : EUROSTAT
Previous
Page
Next back to Dashboard