SlideShare a Scribd company logo
1 of 22
Download to read offline
Marfrig reports net income of R$34.5 million, reversing the loss recorded in 4Q11
CONSOLIDATED FINANCIAL HIGHLIGHTS:
    Consolidated net operating revenue of R$5.23 billion, in line with the R$5.25 billion recorded in 1Q11 and down 9.6% from
     R$5.79 billion in 4Q11, due to seasonality and the lower exports in the period;
    Share of processed (higher-value) products in the Corporation’s total revenue of 45.0%, compared to 41.6%(**) in 4Q11 and
     36.4% in 1Q11;
    Gross income of R$803.2 million in 1Q12 (gross margin of 15.4%), increasing 10.2% from R$728.8 million in 1Q11 (gross
     margin of 13.9%) and decreasing 9.6% from R$888.5 million in 4Q11 (gross margin of 15.4%);
    EBITDA of R$410.7 million in 1Q12, increasing 21.8% from R$337.3 million in 1Q11 and decreasing 21.8% from R$521.2
     million in 4Q11. EBITDA margin of 7.8% in the quarter, compared to 6.4% in 1Q11 and 9.0% in 4Q11;
    Net income of R$34.5 million, up 46.7% from R$23.5 million in 1Q11 and reversing the net loss of R$138.6 million in 4Q11.
    On April 30, 2012, we concluded the sale of the specialized logistics services business of Keystone Foods in the United
     States, Europe, Oceania and Asia to The Martin-Brower Company, boosting the Corporation’s cash position by US$390.1
     million;
    Considering the pro-forma effects of the transaction as if it had occurred in 1Q12, pro-forma leverage decreases to 3.52x,
     compared to 4.45x in 4Q11.

                                                                                                                              Var. %              Var. %
Income Statement
                                                                             1Q12            1Q11             4Q11            1Q12 /              1Q12 /
(in million R$)
                                                                                                                               1Q11                4Q11
NET OPERATING REVENUE                                                         5,232.5         5,252.1          5,786.6            -0.4%               -9.6%
 Cost of goods sold                                                         (4,429.3)       (4,523.4)        (4,898.0)            -2.1%               -9.6%
GROSS PROFIT                                                                    803.2           728.8            888.5           10.2%                -9.6%
  % Gross margin                                                                15.4%           13.9%           15.4%           150 bps                0 bps
SG&A                                                                          (573.7)         (547.0)          (561.9)             4.9%                2.1%
% of Net revenue                                                               -11.0%         -10.4%             -9.7%          -50 bps            -130 bps
OPERATING INCOME (LOSS) before financial result                                 224.3           158.9            327.6           41.2%               -31.5%
 % Operation Margin                                                              4.3%            3.0%             5.7%          130 bps            -140 bps
 FINANCIAL INCOME (EXPENSES)                                                  (249.5)         (178.9)          (539.5)           39.4%               -53.8%
OPERATING RESULT                                                                (25.2)          (20.0)         (211.9)           25.4%               -88.2%
NET INCOME (LOSS) before Minority Interest                                        29.3            25.2         (141.5)           36.8%              -124.4%
NET INCOME (LOSS)                                                                 34.5            23.5         (138.6)           46.7%              -124.9%
 EARNINGS PER SHARE - R$                                                       0.1000          0.0678         (0.3994)           46.7%              -124.9%
EBITDA                                                                          410.7           337.3            521.2           21.8%               -21.2%
EBITDA Margin                                                                    7.8%            6.4%             9.0%          140 bps            -120 bps
ADJUSTED EBITDA(*)                                                              415.9           360.1            520.2           15.5%               -20.1%
ADJUSTED EBITDA Margin                                                           7.9%            6.9%             9.0%          110 bps            -100 bps
(*)Excludes Other operating revenues/expenses

(**) As of 4Q11, all information related to beef under the Seara Brand began to be consolidated in the line processed and value-added products.


                       Rua Chedid Jafet, 222 Bloco A - 1º andar - Vila Olímpia - São Paulo - SP – CEP: 04551-065
                         Tel: (11) 3792-8600/8650      www.marfrig.com.br/ri        e-mail: ri@marfrig.com.br
                                                                                                                                                          1
In the first quarter of 2012, despite the adversities and uncertainties in the export market due to high chicken protein
inventories in certain countries, the period marked another step forward in consolidating the Corporation’s new structure and in
the execution of the strategy to optimize its capital structure:
    I.   Structural Changes:
              a. Reorganization into two business segments: Seara Foods and Marfrig Beef
              b. Asset swap with Brasil Foods: important step for increasing capacity and volumes in higher-value processed
                   products and strategic for optimizing the use of tax credits
              c. Capturing of synergies: integration of Seara Foods with expected synergies ranging from R$230.0 million to
                   R$330.0 million over the next 2 to 5 years
   II.   Optimization of capital structure:
              a. Sale of assets that are not part of the core business, especially of past acquisitions, increasing the focus on
                   proteins and strengthening the cash position; and
              b. Consolidation of the Capital Structure: goal of obtaining an Investment Grade rating.

The Corporation continued to pursue higher operating efficiency by capturing synergies across business segments and improving
margins from the prior year, which attest to the strategy adopted and the commitment of our entire team to delivering
consistent results and maximizing value for shareholders.

The positive results achieved show that the strategy to build a complete portfolio of higher-value products, brands with strong
customer loyalty and a global platform for developing, producing, marketing and distributing food products is increasingly more
integrated and aligned with our goals.


NET OPERATING REVENUE
Net operating revenue was R$5.23 billion in 1Q12, in line with the R$5.25 billion recorded in 1Q11 and down 9.6% from R$5.79
billion in 4Q11, driven by the period’s seasonality (historically the first quarter is the weakest of the year) and by the impacts on
the volumes and sale prices of chicken exports from Brazil caused by the excessively high inventories in certain countries and
regions (particularly Japan and the Middle East).
This quarter, the Seara Foods business segment accounted for 66.8% of the group’s total revenue, compared to 63.4% in 1Q11
and 67.3% in 4Q11, while the Marfrig Beef business segment accounted for 33.2% of total revenue, compared to 36.6% in 1Q11
and 32.7% in 4Q11.
The increase in the share in total sales of processed and value-added products to 45.0% reflects the strategy adopted by the
Group since 2007 and the organic growth in the operations of these segments.


EXPORTS
Marfrig’s consolidated exports totaled R$1.68 billion in 1Q12, down 11.1% from 1Q11 (R$1.89 billion), mainly due to the high
levels of chicken inventories in the first few months of the year in major consumer markets in Asia and the Middle East. The
lower volumes were partially offset by the positive exchange impact on exports from Brazil due to the appreciation in the U.S.
dollar against the Brazilian real in 2012.
Europe remained the main destination for the Group’s exports in 1Q12, accounting for 37.4% of total exports in the period
(31.0% in 1Q11). After Europe, the main destinations were: Asia with an 18.8% share (17.8% in 1Q11) and Middle East with
16.9% of the Group’s exports (21.5% in 1Q11).
A breakdown of the Marfrig Group’s consolidated export revenue by destination is presented below:
                    Rua Chedid Jafet, 222 Bloco A - 1º andar - Vila Olímpia - São Paulo - SP – CEP: 04551-065
                      Tel: (11) 3792-8600/8650      www.marfrig.com.br/ri        e-mail: ri@marfrig.com.br
                                                                                                                                   2
Exports Marfrig - 1Q12                                     Exports Marfrig - 1Q11

                   8,2%                   Europe                                6,4%                  Europe
                8,8%                      Asia                              10,2%                     Asia
                                                                                        31,0%
                            37,4%
              9,8%                        Middle East                     13,1%                       Middle East
                                          Central / South America                                     Central / South America
              16,9%
                                          Russia                            21,5%      17,8%          Russia
                      18,8%
                                          Other                                                       Other


COST OF GOODS SOLD

                                                                                                               Var. %       Var. %
                COGS                     1Q12       Part %     1Q11        Part %        4Q11      Part %      1Q12 /       1Q12 /
                                                                                                                1Q11         4Q11
Raw Materials                          (3,068.4)     69.3%   (3,040.8)      67.2%      (3,228.3)    65.9%           0.8%         -5.0%
Packaging                                (152.5)      3.4%     (164.0)        3.6%       (215.2)     4.4%           -7.0%       -29.1%
Electricity                               (30.0)      0.7%       (35.2)       0.8%        (36.3)     0.7%          -14.7%       -17.3%
Direct Expenses + MOD (*)              (1,017.5)     23.0%   (1,085.5)      24.0%      (1,214.5)    24.8%           -6.3%       -16.2%
Indirect Expenses + MOID (*)             (160.7)      3.6%     (197.8)        4.4%       (203.8)     4.2%          -18.8%       -21.2%
Total                                  (4,429.1)   100.0%    (4,523.4)     100.0%      (4,898.0)   100.0%           -2.1%        -9.6%
Cost of goods sold (COGS) was R$4.43 billion in 1Q12, compared to R$4.52 billion in 1Q11 and to R$4.90 billion in 4Q11. The
reduction from the same period of last year was due to the improvements in raw material purchasing activities and to the
reduction in cattle prices from a year earlier.
The main component of COGS remained raw materials, which includes the acquisition of animals and carcasses and inputs used
to make feed. In 1Q12, raw materials accounted for 69.3% of total COGS, up slightly from 67.2% in 1Q11 and 65.9% in 4Q11.
In 1Q12, Seara Foods accounted for 69.2% of total COGS, compared to 65.8% in 1Q11 and 71.7% in 4Q11. Marfrig Beef
accounted for 30.8% of COGS in 1Q12.
Animal feed inputs were the main components of COGS at Seara Foods, accounting for approximately 64.9%. At the Marfrig Beef
business segment, cattle and carcasses purchases were the main component in COGS, accounting for some 81.3% of the total.
We continue to focus on reducing costs by: (i) improving processes by consolidating our operations (Marfrig Beef and Seara
Foods); (ii) optimizing our plants and diluting fixed costs, and (iii) capturing synergies.


GROSS INCOME AND GROSS MARGIN
Gross income was R$803.2 million in 1Q12, increasing by 10.2% from 1Q11 (R$728.8 million) and decreasing by 9.6% from
R$888.5 million in 4Q11. Gross margin was 15.4%, compared to 13.9% in 1Q11 and 15.4% in 4Q11. The growth in gross income
compared to 1Q11 and the evolution in margins are explained by the better sales mix, with a higher share of processed and
value-added products, and by the synergies captured in raw-material purchasing (cattle and grains).
This improvement is also attributable to the various improvements implemented last year on the operational, synergy and
efficiency fronts, such as optimizing the beef and poultry production facilities in order to boost capacity utilization and dilute
fixed costs at plants.


                       Rua Chedid Jafet, 222 Bloco A - 1º andar - Vila Olímpia - São Paulo - SP – CEP: 04551-065
                         Tel: (11) 3792-8600/8650      www.marfrig.com.br/ri        e-mail: ri@marfrig.com.br
                                                                                                                                     3
SELLING, GENERAL AND ADMINISTRATIVE EXPENSES
The selling, general and administrative (SG&A) expenses were R$573.7 million in 1Q12, increasing by 4.9% from R$547.0 million
in 1Q11 and by 2.1% from 4Q11 (R$561.9 million), driven by the higher marketing investments and the increase in labor costs in
the period. SG&A expenses corresponded to 11.0% of net revenue, increasing by 50 bps from 1Q11 (10.4%) and by 130 bps from
4Q11 (9.7%), reflecting the increases in general and administrative expenses of 7.7% compared to 1Q11 and of 8.7% compared
to 4Q11.
We continue to focus on improving and reducing our expenses by maintaining our strategy to control costs and expenses, mainly
by integrating and consolidating the structures (Marfrig Beef and Seara Foods), where we believe there are synergies to be
captured from the exchange of best practices and the dilution of fixed and variable expenses.


EBITDA AND EBITDA Margin
EBITDA was R$410.7 million in 1Q12, up 21.8% from R$337.3 in 1Q11 and down 21.2% from R$521.2 in 4Q11, reflecting the
seasonality of the periods. EBITDA margin was 7.8% in the quarter, compared to 6.4% in 1Q11 and 9.0% in 4Q11.
Adjusted EBITDA, which excludes the nonrecurring effects of other operating revenue/expenses, was R$415.9 million (margin of
7.9%), increasing by 15.5% from R$360.1 million in 1Q11 (margin of 6.9%) and decreasing by 20.1% from R$520.2 million in
4Q11 (margin of 9.0%).
The growth in EBITDA and EBITDA margin was driven by the operational improvement at both Seara Foods and Marfrig Beef,
due to the measures implemented over past year, with the effects continuing into this year, and to the increased share of
higher-value processed products in the sales mix.

The reconciliation of Adjusted EBITDA with the financial statements is shown below:


                           EBITDA Reconciliation (in R$ million)             1Q12        1Q11        4Q11
                  NET INCOME (Loss)                                             34.5        23.5     (138.6)
                  (-) Provision for Income and Social Contribution taxes        54.4        45.2        70.4
                  (-) Net financial charges                                  (344.2)     (226.7)     (437.7)
                  (-) Net exchange variation                                    94.7        47.8     (101.8)
                  (+) Depreciation/amortization                                186.3       178.4       193.6
                  (+) Minority interest                                         (5.2)        1.7        (2.9)
                  EBITDA                                                       410.7       337.3       521.2
                  (-) Other operating revenues/expenses                         (5.2)     (22.8)          1.0
                  Adjusted EBITDA                                              415.9       360.1       520.2


                   Rua Chedid Jafet, 222 Bloco A - 1º andar - Vila Olímpia - São Paulo - SP – CEP: 04551-065
                     Tel: (11) 3792-8600/8650      www.marfrig.com.br/ri        e-mail: ri@marfrig.com.br
                                                                                                                            4
NET FINANCIAL RESULT

                                                                                                         Var %
                                                                                                                        Var %
                  Financial Result (R$ million)                   1Q12        1Q11        4Q11           1Q12 x
                                                                                                                     1Q12 x 4Q11
                                                                                                          1Q11
Financial Income                                                     85,6        143,9        91,0          -40,5%         -5,9%
Net Financial Derivatives                                            30,8         37,9        37,2          -18,7%        -17,0%
Interest Income and income from financial investments                48,6         85,1        49,7          -43,0%         -2,3%
Discounts obtained & Others                                            6,3        20,8          4,1         -69,9%         52,6%
Exchange and monetary effects - Gains                               217,3         93,1        55,9         133,5%         288,8%
Total Financial Income                                              303,0        236,9       146,9           27,9%        106,3%
Finacial Expenses                                                 (429,8)      (370,6)     (528,7)           16,0%        -18,7%
Accrued Interest                                                  (237,3)      (213,5)     (246,8)           11,1%         -3,9%
Interest on debentures                                            (100,1)       (90,8)      (99,4)           10,3%          0,8%
Interest on leasing                                                  (3,4)        (7,4)       (5,3)         -54,6%        -36,6%
Derivatives                                                        (38,3)       (26,8)     (115,3)           43,0%        -66,8%
Bank charges, Comissions, Fees & others                            (29,5)       (27,2)      (40,0)            8,4%        -26,3%
Other                                                              (21,2)         (4,9)     (22,0)         336,7%          -3,3%
Exchange and monetary effects - Losses                            (122,6)       (45,2)     (157,7)         171,1%         -22,2%
Total Financial Expenses                                          (552,5)      (415,8)     (686,4)           32,9%        -19,5%
Result                                                            (249,5)      (178,9)     (539,5)           39,4%        -53,8%


The Corporation registered a net financial result of an expense of R$249.5 million in the quarter, compared to the net financial
expenses of R$178.9 million in 1Q11 and R$539.5 million in 4Q11.


NET INCOME
The Corporation posted net income of R$34.5 million or earnings per share of R$0.1000 in 1Q12, compared to the net income of
R$23.5 million or earnings per share of R$0.0678 in 1Q11 and the net loss of R$138.6 million or negative earnings per share of
R$0.3994 in 4Q11


                     Rua Chedid Jafet, 222 Bloco A - 1º andar - Vila Olímpia - São Paulo - SP – CEP: 04551-065
                       Tel: (11) 3792-8600/8650      www.marfrig.com.br/ri        e-mail: ri@marfrig.com.br
                                                                                                                               5
OTHER FINANCIAL HIGHLIGHTS
Cash Flow: The quarter registered cash burn of R$141.3 million, with higher use of working capital due to the seasonal reduction
in trade accounts payable from the prior quarter and to the variation in the balance of recoverable taxes that were not offset by
operating activities in the period.

                               Simplified Cash Flow
                                                                                                                       4Q11
                               (in R$ million)
                               Operational Activities
                               Net income (loss) in period                                                               34.5
                                 Items not affecting cash                                                               389.4
                                 Working capital changes - operating accounts(1)                                       (408.7)
                                 Other assets and liabilities accounts                                                 (156.5)
                               Cash Flow - Operating activities ¹                                                      (141.3)
                               ¹ Consider inventories, accounts receivables, supliers and current and deferred taxes


Marfrig’s strategy to manage its long-term capital structure is based on lengthening its debt profile and reducing its weighted
average cost of operations. These goals were not achieved in the period, with short-term debt reaching R$3.02 billion, or 25.9%
of total debt. This percentage compares to 30.6% at the end of 1Q11 and 20.8% at the end of 4Q11. At the end of 1Q12, the
weighted average cost of our consolidated debt was 8.25% per annum, compared to 8.01% at the end of 4Q11.


                           Debt Maturity Breakdown
                                 (R$ million)                                                                Debt and Cash and Equivalents by Currency
       Short Term                        2.340
       Long Term
                                                                                                                                 8.635
                                                                                                                                              Foreing Currency
                                                                                                                                              Local Currency
                                 1.490           1.412                 1.349
          1.048                                          1.009                                                                   79,9%
    803                  868                                                       882
                                                                                                           3.022                              3.320

                   302                                                                                      63,1%                               54,6%
                                                                 152
                                                                               1         0                  36,9%                20,1%          45,4%

   2Q12 3Q12 4Q12 1Q13 2013 2014 2015 2016 2017 2018 2019 2020 2021                                      Short Term         Long Term         Cash and
                                                                                                            Debt              Debt           Equivalents


The composition of gross debt by currency was 24.4% in Brazilian real and 75.6% in other currencies, which was consistent with
the 75.3% of the Group’s revenue generated in currencies other than the Brazilian real.
At the end of 1Q12, cash and cash equivalents totaled R$3.32 billion, for short-term debt coverage of 1.1 times.
The leverage ratio (based on net debt of R$8,336.4 million) stood at 4.51 times. Considering on a pro-forma basis the sale of
Keystone’s logistics assets concluded in late April as if it had occurred in 1Q12, the leverage ratio is 3.52 times (see table below).


                         Rua Chedid Jafet, 222 Bloco A - 1º andar - Vila Olímpia - São Paulo - SP – CEP: 04551-065
                           Tel: (11) 3792-8600/8650      www.marfrig.com.br/ri        e-mail: ri@marfrig.com.br
                                                                                                                                                               6
Management of Long-Term Capital Structure (Debt):
Debt Breakdown                                           3/31/2012                                                 31/12/2011
(In R$ million)                        Current            Non-current             Total              Current       Non-current    Total
Domestic currency                           1,115.6             1,732.5             2,848.1              956.5          1.809.6     2,766.0
Foreign currencies                          1,906.8             6,902.5             8,809.3            1,500.9          7.110.4     8,611.3
Consolidated Debt                           3,022.4             8,635.0            11,657.4            2,457.3          8,920.0    11,377.3
Cash and cash equivalents                                                           3,321.0            3,477.0                -     3,477.0
Net debt                                                                            8,336.4                                         7,900.3
LTM EBITDA                                                                          1,847.4                                         1,773.8
Net Debt/LTM EBITDA                                                                    4.51                                            4.45


The table below shows our leverage on a pro-forma basis recognizing the sale of Keystone’s logistics assets, as if it had occurred
in 1Q12. In this case, the Marfrig Group has a leverage ratio (net debt/EBITDA) of 3.52 times.

                   Pro-forma including the Sale of Keystone Foods’s Logistics Assets in 1Q12
                   Debt Breakdown                                                       3/31/2012
                   (In R$ million)                                      Current         Non-current              Total
                   Domestic currency                                         1,115.6          1,732.5               2,848.1
                   Foreign currencies                                        1,906.8          6,902.5               8,809.3
                   Consolidated Debt                                         3,022.4          8,635.0              11,657.4
                   Net debt                                                                                         7,630.1
                   EBITDA                                                                                           1,847.2
                   EBITDA Gain Sale (estimated)                                                                        318.0
                   PRO-FORMA EBITDA                                                                                 2,165.2
                   Net Debt/LTM EBITDA                                                                                  3.52


Capital expenditure:

                                      Investments
                                                                                          1Q12
                                      (In R$ million)
                                      Investments in Fixed Assets                         189.5
                                        Fixed                                             103.5
                                        Breeding stock                                        86.0
                                      Investment in Intangible Assets                         2.0
                                      Total CAPEX                                         191.5

Marfrig invested R$189.5 million in the quarter in fixed assets (construction, maintenance, modernization and/or expansion of
its plants and breeding stocks). For 2012, we continue to focus on reducing and controlling investments, prioritizing growth in
higher-value products and increasing Free Cash Flow.


                     Rua Chedid Jafet, 222 Bloco A - 1º andar - Vila Olímpia - São Paulo - SP – CEP: 04551-065
                       Tel: (11) 3792-8600/8650      www.marfrig.com.br/ri        e-mail: ri@marfrig.com.br
                                                                                                                                         7
PERFORMANCE BY BUSINESS SEGMENT - SEARA FOODS

FINANCIAL AND STRATEGIC HIGHLIGHTS:
   Consolidated Net Revenue in the Seara Foods business segment of R$3.50 billion in 1Q12, increasing 5.0% from R$3.33
    billion in 1Q11, driven by the good performance of the Seara operations in the domestic market and by the progress
    achieved in the international operations. Compared to 4Q11, the business segment’s net revenue decreased by 10.3%,
    reflecting both the lower volumes and prices of Brazil’s poultry and pork exports and the seasonality of the first quarter;
   Share of processed and elaborated products in the business segment’s sales revenue of 55.9%, compared to 50.3% in 1Q11
    and 51.1% in 4Q11;
   EBITDA in the segment of R$208.6 million in 1Q12, up 15.9% from R$180.0 million in 1Q11, though 33.9% lower than the
    R$315.6 million recorded in 4Q11, driven by the period’s seasonality and the lower export volumes;
   EBITDA margin of 6.0% in 1Q12, up 60 bps from 5.4% in 1Q11 and down 210 bps from 8.1% in 4Q11;
   On April 30, we concluded the sale of the specialized logistics services business of Keystone Foods in the United States,
    Europe, Middle East, Australia and Asia to The Martin-Brower Company for US$400 million, with the proceeds of US$390.1
    million received on that date. The sale of these logistics assets will enable the Marfrig Group to focus on its core business,
    which is the development, production and distribution of higher-value processed food products.

                                                                                                               Var. %         Var. %
INCOME STATEMENT - SEARA FOODS
                                                              1Q12             1Q11              4Q11          1Q12 /         1Q12 /
 R$ million
                                                                                                                1Q11           4Q11
NET OPERATING REVENUE                                           3,495.2              3,328.4        3,896.8         5.0%         -10.3%
Cost of goods sold                                            (3,063.9)            (2,948.5)      (3,368.9)         3.9%          -9.1%
GROSS PROFIT                                                      431.3                379.9          527.9        13.5%         -18.3%
Gross margin                                                      12.3%                11.4%         13.5%        90 bps       -120 bps
SG&A                                                            (367.3)              (358.8)        (366.4)         2.4%           0.2%
% of Gross Revenue                                               -10.5%               -10.8%          -9.4%       30 bps       -110 bps
OPERATING REVENUE (EXPENSES)                                    (374.4)              (381.9)        (371.0)        -2.0%           0.9%
Selling                                                         (238.5)              (233.5)        (242.0)         2.2%          -1.4%
General and administrative                                      (128.7)              (125.3)        (124.4)         2.7%           3.5%
Other operating revenue/expenses                                   (7.2)               (23.1)          (4.6)      -68.9%          56.3%
EBITDA                                                            208.6                180.0          315.6        15.9%         -33.9%
EBITDA Margin                                                      6.0%                 5.4%           8.1%       60 bps       -210 bps
ADJUSTED EBITDA (*)                                               215.8                203.1          320.2         6.2%         -32.6%
ADJUSTED EBITDA MARGIN(*)                                          6.2%                 6.1%           8.2%       10 bps       -200 bps
(*)Excludes Other operating revenues/expenses


                                           SLAUGHTER             SLAUGHTER           SLAUGHTER             Var.               Var.
          PRODUCTION
                                              1Q12                  1Q11                4Q11            1Q12 / 1Q11        1Q12 / 4Q11
POULTRY
 Brazil                                         155,226,000          166,956,887        155,605,000             -7.0%              -0.2%
 Europe                                          52,317,741           50,233,453         50,939,996              4.1%               2.7%
 USA                                             45,416,082           45,141,013         42,558,988              0.6%               6.7%
 APMEA                                            4,101,551                               7,662,501                               -46.5%
TOTAL POULTRY                                   257,061,374          262,331,353        256,766,485            -2.0%                0.1%
TOTAL PORK                                          707,494              678,589            670,282             4.3%                5.6%
TURKEY                                            1,400,148            1,250,602          2,136,549            12.0%              -34.5%


                    Rua Chedid Jafet, 222 Bloco A - 1º andar - Vila Olímpia - São Paulo - SP – CEP: 04551-065
                      Tel: (11) 3792-8600/8650      www.marfrig.com.br/ri        e-mail: ri@marfrig.com.br
                                                                                                                                         8
FOCUS OF SEARA:
    1- Accelerating the transition of the product mix towards higher-value products in Brazil, taking advantage of the gap left
       by the second brand, with the expectation of market share gains, establishing Seara as the second option in the
       consumption of value-added products;
    2- Focusing on product brand and architecture, innovation efforts and price repositioning;
    3- Optimizing the use of both existing and new assets, creating room for growth;
    4- Substantially expanding distribution;
    5- Investments in plants, capacity, brand and people;
    6- Strong leadership team – performance, complexity, strategy – supported by a winning culture.


Net Revenue:
Seara Foods – Brazil Operation:
Net revenue in the Brazil Operation of Seara Foods was R$1.34 billion in 1Q12, in line with 1Q11 and down 19.0% from R$1.66
billion in 4Q11. The performance in the period reflects the more adverse scenario for poultry and pork exports, especially in
January and February, and the seasonal impacts weighing on sales typical at the start of each year. On the other hand, the 27.7%
growth in domestic sales of processed and elaborated products compared to 1Q11 partially offset the lower exports.
Processed and elaborated products accounted for 73.0% of Seara's sales in Brazil (71.2% in 1Q11), in line with the Corporation’s
strategy to gradually increase the sale of higher-value products. This strategy has led to important market-share gains for Seara,
especially in the categories frozen meats (ready-to-eat dishes, hamburgers, pastries, ready-to-eat snacks, meatballs, steaks,
stuffed products, etc.).
                    Rua Chedid Jafet, 222 Bloco A - 1º andar - Vila Olímpia - São Paulo - SP – CEP: 04551-065
                       Tel: (11) 3792-8600/8650       www.marfrig.com.br/ri       e-mail: ri@marfrig.com.br
                                                                                                                                9
Market Share                                                    Market Share
                                 Frozen Meat                                                  Industrialized Meat
                                                             17,3
          SEARA                                                                 SEARA                                         17,3
          NOVAS MARCAS - TCD                                                    NOVAS MARCAS - TCD
                                                              8,3
                                                                                                                              9,6


                                                              9,0
                                          7,0                                        7,2                 7,8                  7,7
                  5,0


            Fev-Mar/10                Fev-Mar/11          Fev-Mar/12           Jan-Feb/10             Jan-Feb/11           Jan-Fev/12

Source: NIELSEN


Seara Foods – International Operation:
Net revenue in the International Operations of Seara Foods, represented by Moy Park, O’Kane Poultry and Keystone Foods,
came to R$1.82 billion in 1Q12, up 14.2% from R$1.60 billion in 1Q11 and in line with 4Q11. The performance was driven by the
higher domestic sales of processed and elaborated products, which grew by 23.3% from 1Q11 and remained stable in relation to
4Q11. The result was driven by organic growth at Moy Park and O’Kane Poultry, which benefitted from the change in the
behavior of European consumers, who are now eating more meals at home. Another factor contributing to this result was
Keystone's solid performance in serving fast-food chains in the USA, Europe and APMEA, as well as the more favorable currency
translation for our revenues in foreign currencies, reflecting the depreciation of the Brazilian real in relation to the U.S. dollar
compared to 1Q11.

Seara Foods – Exports:
Europe remained the main export destination of Seara Foods, with its share in the business segment’s total exports increasing to
38.1%, compared to 30.9% in 1Q11. Asia was the second most important destination, accounting for 23.8% (22.7% in 1Q11),
while the Middle East, the segment’s third most important export destination, reduced its share to 20.9% in 1Q12, due to high
levels of chicken inventories in certain countries in the region. In March, demand in the region already showed signs of recovery,
indicating that the situation should gradually return to normal over the next few months.

A breakdown of consolidated export revenue by destination in the Seara Foods business segment is presented below:

                                 Seara Foods - 1Q12                                          Seara Foods - 1Q11
                                                                                     3,5%
              3,9% 6,2%
                                                   Europe                        3,9%
                                                                                                               Europe
                  7,1%                             Asia                      14,8%           30,9%             Asia
                                  38,1%
                                                   Middle East                                                 Middle East
            20,9%
                                                   Central / South America                                     Central / South America
                                                                             24,2%
                         23,8%
                                                   Russia                                  22,7%               Russia
                                                   Other                                                       Other


                          Rua Chedid Jafet, 222 Bloco A - 1º andar - Vila Olímpia - São Paulo - SP – CEP: 04551-065
                            Tel: (11) 3792-8600/8650      www.marfrig.com.br/ri        e-mail: ri@marfrig.com.br
                                                                                                                                         10
Gross Margin:
Seara Foods recorded gross margin of 12.3% in 1Q12, compared to 11.4% in 1Q11 and 13.5% in 4Q11. Compared to 1Q11, the
margin expansion was driven by stability in the prices of the main commodities and the gradual increases in the share of
processed and elaborated products in the brand’s sales mix and in the prices of these products. The compression compared to
4Q11 reflects the lower exports and the positive effect from the sales of commemorative/holiday products in 4Q11.
On an annual basis, the average corn price in Brazil (ESALQ) decreased 2.2%, while the soybean price decreased 0.8%. In the
international market, corn prices in U.S. dollar (CBOT) decreased 4.5%, while the soybean price decreased 8.1%. Compared to
4Q11, the main commodities registered slight price increases. In Brazil, the corn price increased 2.8% and the soybean price
5.5%, while in the international market prices increased by 3.4% for corn and 8.1% for soybean.


EBITDA and EBITDA Margin:
EBITDA in the segment was R$208.6 million or 6.0% of revenue in 1Q12, compared to R$180.0 million or 5.4% of revenue in
1Q11 and R$315.6 million or 8.1% of revenue in 4Q11. As explained above, the strengthening of Seara in Brazil’s domestic
market and the international operations contributed positively to the segment’s margin expansion compared to 1Q11.
Compared to 4Q11, the decrease is explained by seasonality and the unfavorable scenario for exports faced early this year.


                   Rua Chedid Jafet, 222 Bloco A - 1º andar - Vila Olímpia - São Paulo - SP – CEP: 04551-065
                     Tel: (11) 3792-8600/8650      www.marfrig.com.br/ri        e-mail: ri@marfrig.com.br
                                                                                                                         11
PERFORMANCE BY BUSINESS SEGMENT – MARFRIG BEEF

FINANCIAL AND STRATEGIC HIGHLIGHTS:
    Consolidated Net Revenue in the Marfrig Beef business segment of R$1.74 billion in 1Q12, decreasing by 9.7% from R$1.92
     billion in 1Q11 and by 8.1% from R$1.89 billion in 4Q11, driven by the adjustments in production to the lower demand in
     the domestic and export markets due to the period’s seasonality;
    EBITDA in the segment of R$202.1 million in 1Q12, increasing 28.5% from R$157.3 million in 1Q11 and decreasing 1.7% from
     R$205.6 million in 4Q11;
    EBITDA Margin of 11.6%, expanding 350 bps and 80 bps from 1Q11 (8.2%) and 4Q11 (10.9%), respectively, driven by the
     operational adjustments implemented over the course of the year and the better prices, mainly due to the depreciation in
     the Brazilian real in relation to the U.S. dollar.

                                                                                                                            Var. %      Var. %
INCOME STATEMENT - MARFRIG BEEF                                      1Q12                 1Q11              4Q11
                                                                                                                          1Q12 / 1Q11 1Q12 / 4Q11
 R$ Million
NET OPERATING REVENUE                                                    1,737.3              1,923.8          1,889.8           -9.7%           -8.1%
Cost of goods sold                                                     (1,365.4)            (1,574.9)        (1,529.2)          -13.3%          -10.7%
GROSS PROFIT                                                               371.9                348.9            360.6            6.6%            3.1%
Gross margin                                                               21.4%               18.1%             19.1%         330 bps         230 bps
SG&A                                                                     (206.4)              (188.2)          (195.5)            9.7%            5.6%
% Gross Revenue                                                           -11.9%                -9.8%           -10.3%        -210 bps        -150 bps
OPERATING REVENUE (EXPENSES)                                             (204.5)              (187.9)          (189.9)            8.8%            7.6%
Selling                                                                  (124.2)              (117.6)          (125.8)            5.5%           -1.3%
General and administrative                                                 (82.3)               (70.6)           (69.7)          16.6%           18.1%
Other operating revenue/expenses                                              2.0                  0.3              5.6        598.7%           -64.1%
EBITDA                                                                     202.1                157.3            205.6           28.5%           -1.7%
EBITDA Margin                                                              11.6%                 8.2%            10.9%         350 bps          80 bps
ADJUSTED EBITDA (*)                                                        200.1                157.0            200.0           27.5%            0.1%
ADJUSTED EBITDA MARGIN(*)                                                  11.5%                 8.2%            10.6%         340 bps          90 bps
(*)Excludes Other operating revenues/expenses

Production:
                                                    SLAUGHTER              SLAUGHTER             SLAUGHTER             Var.                 Var.
            PRODUCTION
                                                       1Q12                   1Q11                  4Q11            1Q12 / 1Q11          1Q12 / 4Q11
BEEF
 Brazil                                                    522,101                769,444                551,999             -32.1%              -5.4%
 Argentina                                                 137,265                139,952                132,201              -1.9%              -3.8%
 Uruguay                                                    99,506                108,317                125,739              -8.1%             -20.9%
TOTAL BEEF                                                 758,872              1,017,713                809,939             -25.4%              -6.3%

LAMB
 Uruguay                                                     3,347                   12,502               34,861             -73.2%             -90.4%
 Chile                                                      95,343                  110,914                                  -14.0%
 Brazil                                                     26,961                   54,624               21,138             -50.6%             27.5%
TOTAL LAMB                                                 125,651                  178,040               55,999             -29.4%            124.4%
¹ Includes only the number of cattle slaughtered, excluding meat purchases from third parties.


                         Rua Chedid Jafet, 222 Bloco A - 1º andar - Vila Olímpia - São Paulo - SP – CEP: 04551-065
                           Tel: (11) 3792-8600/8650      www.marfrig.com.br/ri        e-mail: ri@marfrig.com.br
                                                                                                                                                   12
FOCUS OF MARFRIG BEEF
    1-     Efficiency gains through higher capacity utilization and optimization of production facilities.
    2-     Unifying production across the three operations to capture operational improvements;
    3-     Expanding and unifying the sales team;
    4-     Market intelligence to identify the most profitable markets and clients;
    5-     IT platforms integrated across the three operations;
    6-     Adoption of best operational practices and industrial models used in the market;
    7-     Unified model for brand positioning
    8-     Focusing on product brand and architecture, innovation efforts and price repositioning;
    9-     Optimizing the use of both existing and new assets, creating room for growth;
    10-    Substantially expanding distribution for domestic and export sales.
With the aim of improving the profitability of its operations to face the challenging scenario caused primarily by the period’s
seasonality, we reduced slaughter volume and increased purchases of bone-in meats (carcasses). Our capacity utilization stood
at 65%, compared to 68% in the prior quarter.
Marfrig Beef plans to resume operations at 3 plants in 2Q12, given the stronger demand and better moment in Brazil’s beef
cattle cycle.
Net Revenue:
Brazil Operation:
Net operating revenue in the Marfrig Beef operations in Brazil was R$866.7 million in 1Q12, decreasing 20.5% from 1Q11 and
14.0% from 4Q11.
In the domestic market, the reduction in sales was driven by weaker demand and the period’s seasonality, which were partially
offset by the growth in exports of elaborated and processed products, which was accompanied by higher prices, due to the
depreciation of the Brazilian real against the U.S. dollar.
International Operations:
Revenue from the international operations of the Marfrig Beef business segment was R$556.5 million in 1Q12, up 3.9% from
1Q11 and in line with 4Q11.
In the domestic market, the decrease in fresh beef sales volume was partially offset by the higher sales of elaborated and
processed products.
Exports:
Europe remained the main export destination for Marfrig Beef, with its share of the business segment’s total exports increasing
to 36.3%, compared to 31.2% in 1Q11. Russia remained the second most important destination, with its share of exports
decreasing to 16.9% (22.2% in 1Q11), reflecting the restrictions on Brazilian exports imposed during 2011. Central and South
America was the business segment’s third most important export destination, with a share of 14.2%, driven by higher sales to
the Chilean market and by exports of prime cuts from Argentina and Uruguay to serve the food-service market in Brazil.


                      Rua Chedid Jafet, 222 Bloco A - 1º andar - Vila Olímpia - São Paulo - SP – CEP: 04551-065
                        Tel: (11) 3792-8600/8650      www.marfrig.com.br/ri        e-mail: ri@marfrig.com.br
                                                                                                                            13
Exports Marfrig Beef - 1Q12                               Exports Marfrig Beef - 1Q11

                11,4%
                                       Europe                             11,6%
                                                                                                  Europe
                                       Asia                                       31,2%           Asia
           16,9%        36,3%
                                       Middle East                   22,2%                        Middle East
                                       Central / South America                                    Central / South America
            14,2%                                                       10,0%     8,4%
                    10,7%
                10,5%                  Russia                                16,6%                Russia
                                       Other                                                      Other

Gross Margin:
The combination of the reduction in cattle prices in the quarter, the efforts to pursue more profitable sales channels and
markets and the operational improvements implemented in the business segment since the integration of all operations,
contributed to gross margin expansion of 330 bps compared to 1Q11 and of 230 bps compared to 4Q11.
The average cattle price in Brazil during the quarter decreased by 10.8% (average in 16 different markets), while prices increased
by 1.8% in Argentina and by 3.7% in Uruguay (both in U.S. dollar terms).


EBITDA and EBITDA Margin:
EBITDA in the Beef segment was R$202.1 million or 11.6% of revenue in 1Q12, increasing by 28.5% from R$157.3 million in 1Q11
(margin of 8.2%) and decreasing by 1.7% from R$205.6 million in 4Q11 (margin of 10.9%). The increases reflect the effects from
the various initiatives implemented over the year to capture operational improvements and synergies, such as optimizing
production infrastructure to increase capacity utilization and dilute fixed costs at plants, improvements in raw-material
purchasing and concentrating exports in more profitable markets and channels.


                    Rua Chedid Jafet, 222 Bloco A - 1º andar - Vila Olímpia - São Paulo - SP – CEP: 04551-065
                      Tel: (11) 3792-8600/8650      www.marfrig.com.br/ri        e-mail: ri@marfrig.com.br
                                                                                                                               14
About Marfrig
Marfrig Alimentos S.A. is a Brazilian multinational public corporation operating in the food and food services industry in Brazil
and abroad. It is engaged in the production, processing, marketing and distribution of food made from animal proteins (beef,
pork, lamb, poultry and processed products) and the distribution of other food products (frozen foods, cold cuts and sausages,
fish, ready-to-eat meals and pasta) and semi-finished and finished leather.
Headquartered in the city of São Paulo, Marfrig Group operates nationwide in Brazil as well as in 21 other countries (Argentina,
Uruguay, Chile, USA, France, Northern Ireland, United Kingdom, Holland, South Africa, Mexico, Germany, United Arab Emirates,
Kuwait, Qatar, Bahrain, China, Thailand, Malaysia, South Korea, Australia and New Zealand) through 150 production units,
distribution centers and sales offices, with production capacity of more than 120,000 tonnes of processed food per month. It is
present on five continents, employs over 85,000 direct employees and exports products to more than 140 countries, including
Europe, the Middle East, Asia and the Americas. In 2007, the Group went public and listed its shares on the Novo Mercado
corporate governance segment of the BM&FBovespa.
As part of its initiative to diversify its operations across different geographic regions and animal proteins, Marfrig launched a
series of acquisitions of assets, companies and brands, which over the past four years have totaled 40 operations. As a result,
the Group has consolidated itself as one of the leading companies in the food global industry, ranking as the third largest player
in the global protein industry, the world’s fourth largest beef producer and Brazil’s second largest producer and exporter of
poultry and processed products.
With approximately 85,000 employees, the Marfrig Group is the largest poultry producer in the United Kingdom, the largest
private company in Uruguay and Northern Ireland, the largest lamb producer in South America, the largest meat company in
Argentina and the fourth largest food company in the world, as well as the world’s third largest producer of beef products and
Brazil’s second largest producer and exporter of poultry and processed products.
In 2010, it was recognized as the “Best Agribusiness Company” and “Best Meat Company” by Exame magazine’s “Best and
Biggest Guide” published by Grupo Abril, the “Best Company in Financial Sustainability” by Isto É Dinheiro magazine and the
"Best Meat Company" by Globo Rural magazine published by Organizações Globo. In 2011, it was once again elected the “Best
Meat Company” by Exame magazine’s “Best and Biggest Guide” and the "Best Meat Company" by Globo Rural magazine and
also received the 2011 Transparency Trophy from Anefac, Fipecafi and Serasa Experian, which marked the first time this trophy
was awarded to a food company.
With stock traded on the Novo Mercado special corporate governance segment of the BM&FBovespa S.A. - Securities,
Commodities and Futures Exchange under the ticker MRFG3, Marfrig is a component of the main performance indicators for
Brazil's capital markets, such as the Bovespa Index, the IBrX-50 and the Carbon Efficient Index (ICO2), the latter formed by
companies that have adopted transparent practices for their greenhouse gas emissions.
To ensure the long-term sustainability of its business, the Marfrig Group develops and implements innovative actions and a
comprehensive policy of social and environmental responsibility throughout its supply chain. It has a unified Code of Ethics that
permeates the Corporation and is applied in all countries where it operates. This enables the formation of a unique and global
culture, guided by the same social and environmental values. The most visible face of the Corporation's engagement in
sustainability practices lies in the working groups that it leads and the public commitments that it has assumed in partnership
with the world's largest organizations in defense of sustainable production and the conservation of biodiversity.

About this document
This document may contain forward-looking statements in accordance with the definition in Section 27A of the U.S. Securities
Act of 1933 and Section 21E of the U.S. Securities Exchange Act of 1934. These forward-looking statements are merely
projections and do not constitute guarantees of future performance. Investors are cautioned that any forward-looking
statements are subject to various risks, uncertainties and factors relating to the operations and business environments of
Marfrig and its subsidiaries that could cause the actual results of these companies to be materially different from any future
results expressed or implied by said forward-looking statements.

                   Rua Chedid Jafet, 222 Bloco A - 1º andar - Vila Olímpia - São Paulo - SP – CEP: 04551-065
                     Tel: (11) 3792-8600/8650      www.marfrig.com.br/ri        e-mail: ri@marfrig.com.br
                                                                                                                               15
This material is published solely for informational purposes and should not be construed as a solicitation or an offer to buy or
sell any securities or related financial instruments and should not be treated as investment advice. This material does not target
any specific investment objectives, financial situation or particular needs of any recipient. No representation or warranty, either
expressed or implied, is made regarding the accuracy, completeness or reliability of the information contained herein. This
material should not be regarded by recipients as a substitute for the exercise of their own judgment.

                                           Conference Calls: March 15th, 2012
                                                          Portuguese
                                9:30 a.m. (Brasília) / 8:30 a.m. (US EST) / 12:30 p.m. (GMT)
                                                Dial-in: +55 (11) 4688-6361
                                                         Code: Marfrig

                                                             English
                                11:00 a.m. (Brasília) / 10:00 a.m. (US EST) / 2:00 p.m. (GMT)
                                             Dial-in (Brazil): +55 (11) 4688-6361
                                        Dial-in (other countries): +1 (786) 924-6977
                                                         Code: Marfrig

                                       Live audio webcast with slide presentation.
                          Replay available for download on our website: www.marfrig.com.br/ir


                    Rua Chedid Jafet, 222 Bloco A - 1º andar - Vila Olímpia - São Paulo - SP – CEP: 04551-065
                      Tel: (11) 3792-8600/8650      www.marfrig.com.br/ri        e-mail: ri@marfrig.com.br
                                                                                                                                16
Var. %      Var. %
Income Statement
                                                               1Q12          1Q11          4Q11         1Q12 /      1Q12 /
(in million R$)
                                                                                                         1Q11        4Q11
NET OPERATING REVENUE                                            5,232.5      5,252.1       5,786.6         -0.4%       -9.6%
 Cost of goods sold                                            (4,429.3)    (4,523.4)     (4,898.0)         -2.1%       -9.6%
 % net revenue                                                    -84.6%      -86.1%         -84.6%       150 bps        0 bps
GROSS PROFIT                                                       803.2        728.8         888.5         10.2%       -9.6%
% Gross margin                                                     15.4%        13.9%         15.4%       150 bps        0 bps
SG&A                                                             (573.7)      (547.0)       (561.9)          4.9%        2.1%
% of Net revenue                                                  -11.0%      -10.4%          -9.7%       -50 bps    -130 bps
 OPERATING REVENUE (EXPENSES)                                    (578.9)      (569.9)       (560.9)          1.6%        3.2%
Selling                                                          (362.7)      (351.1)       (367.9)          3.3%       -1.4%
General and administrative                                       (211.0)      (195.9)       (194.0)          7.7%        8.7%
Other operating revenue (expenses)                                  (5.2)       (22.8)           1.0       -77.3%     -630.0%
OPERATING INCOME (LOSS) before financial result                    224.4        158.9         327.6         41.2%      -31.5%
 % Operation Margin                                                 4.3%         3.0%          5.7%       130 bps    -140 bps
 FINANCIAL INCOME (EXPENSES)                                     (249.5)      (178.9)       (539.5)         39.4%      -53.8%
 Financial income                                                    85.6       143.9          91.0        -40.5%       -5.9%
 Exchange and monetary effects - Gains                             217.3          93.1         55.9       133.5%       288.8%
 Financial expenses                                              (429.8)      (370.6)       (528.7)         16.0%      -18.7%
 Exchange and monetary effects - Losses                          (122.6)        (45.2)      (157.7)       171.1%       -22.2%
OPERATING RESULT                                                   (25.2)       (20.0)      (211.9)         25.4%      -88.2%
 Provision for Income and Social Contribution taxes                  54.4         45.2         70.4         20.3%      -22.8%
 Income Tax                                                          42.6         34.2         54.5         24.5%      -21.9%
 Social Contribution                                                 11.8         11.0         15.9          7.1%      -25.6%
NET INCOME (LOSS) before minotity Interest                           29.3         25.2      (141.5)         36.8%     -124.4%
Minority Interest                                                     5.2        (1.7)           2.9      203.6%      -279.6%
NET INCOME (LOSS)                                                    34.5         23.5      (138.6)         46.7%     -124.9%
 # Shares (million)                                                347.0        347.0         347.0           N/A         N/A
 EARNINGS PER SHARE - R$                                          0.1000       0.0678      (0.3994)         46.7%     -124.9%
EBITDA                                                             410.7        337.3         521.2         21.8%      -21.2%
EBITDA Margin                                                       7.8%         6.4%          9.0%       140 bps    -120 bps

ADJUSTED EBITDA (*)                                               415.9         360.1        520.2         15.5%       -20.1%
ADJUSTED EBITDA Margin                                             7.9%          6.9%         9.0%        110 bps    -100 bps
(*)Excludes Other operating revenues/expenses


                    Rua Chedid Jafet, 222 Bloco A - 1º andar - Vila Olímpia - São Paulo - SP – CEP: 04551-065
                      Tel: (11) 3792-8600/8650      www.marfrig.com.br/ri        e-mail: ri@marfrig.com.br
                                                                                                                           17
Var. %          Var. %
CONSOLIDATED BALANCE SHEET (In R$ million)                1Q12          1Q11          4Q11
                                                                                                  1Q12 / 1Q11     1Q12 / 4Q11
 CURRENT ASSETS                                              9,310.1     9,210.9       9,359.1            -2.1%           -3.7%
Cash and cash equivalents                                    3,321.1     3,163.2       3,477.0            -4.5%          -13.1%
Accounts receivable from domestic clients                    1,075.8     1,067.9       1,032.5             0.7%            4.2%
Accounts receivable from foreign clients                       249.4       322.3         270.4           -22.6%           -7.8%
Inventories                                                  2,530.4     2,452.3       2,526.8             3.2%            0.1%
Biological assets                                              698.0       733.4         711.2            -4.8%           -1.9%
Recoverable taxes                                            1,107.2     1,024.5       1,025.5             8.1%            8.0%
Deferred expenses                                              102.1         78.2          85.7           30.5%           19.1%
Notes receivable                                                 19.4        92.2          28.4          -79.0%          -31.6%
Advances to suppliers                                            36.6        89.7          33.2          -54.6%           22.8%
Other accounts receivable                                      170.1       187.1         168.5            -9.1%            0.9%
 NON CURRENT ASSETS                                        14,401.9     13,192.6      14,464.3             9.2%           -0.4%
Financial investments                                             0.9         7.5           0.9          -88.1%            0.0%
Demand deposits                                                  26.3        19.6          24.9           34.3%            5.8%
Notes receivable                                                 31.5        39.7          37.9          -20.5%          -16.9%
Deferred taxes                                               1,489.0       968.9       1,443.5            53.7%            3.2%
Recoverable taxes                                            1,222.1       984.9       1,188.6            24.1%            2.8%
Other accounts receivable                                        81.0      117.2           85.3          -30.9%           -5.0%
Investments                                                      13.5        10.2          13.2           33.1%            2.5%
Fixed assets                                                 7,026.3     6,800.6       7,095.3             3.3%           -1.0%
Biological assets                                              214.0       201.7         219.8             6.1%           -2.6%
Intangible assets                                            4,297.2     4,042.3       4,355.0             6.3%           -1.3%
TOTAL ASSETS                                               23,712.1     22,403.5      23,823.4             5.9%           -0.5%
 CURRENT LIABILITIES                                         6,919.7     6,672.1       6,673.1             3.8%            3.8%
  Trade accounts payable                                     2,525.1     2,366.3       2,783.1             6.7%           -9.3%
  Payroll and related charges                                  476.9       535.2         483.7           -10.9%           -1.4%
  Taxes, fees and contributions                                161.8       171.4         171.2            -5.6%           -5.5%
  Loans and financing                                        2,625.3     2,759.6       2,277.0           -12.1%            6.5%
  Leasing payable                                                54.6        76.2          59.9          -28.4%           -8.9%
  Notes payable                                                398.6       126.2         434.2          215.8%            -8.2%
  Prepaid accounts from clients                                116.6       185.6         106.9           -37.2%            9.1%
  Interest on debentures                                       197.7       222.8         180.3            78.2%         120.2%
  Other payables                                               167.7       194.0         161.8           -13.5%            3.6%
 NON CURRENT LIABILITIES                                   10,811.3      9,289.6      11,251.8            16.4%           -3.9%
Loans and financing                                          8,239.8     5,956.6       8,326.0            36.7%           -2.2%
Leasing payable                                                235.5       224.8         242.8             4.7%           -3.0%
Debentures payable                                             395.2       592.6         594.0           -33.3%          -33.5%
Taxes, fees and contributions                                  248.2       276.2         244.0           -10.2%            1.7%
Deferred taxes                                               1,376.6     1,402.4       1,415.7            -1.8%           -2.8%
Provision for contingencies                                    210.7       209.7         188.7             0.4%           11.6%
Notes payable                                                     5.7      365.9           30.5          -98.4%          -81.4%
Other                                                          199.6       261.2         210.0           -23.5%           -4.9%
 SHAREHOLDERS’ EQUITY                                        5,881.1     6,292.9       5,733.7            -9.0%           -0.1%
 Share Capital                                               4,061.5     4,061.5       4,061.5             0.0%            0.0%
 (-) Expenses with capital increase                            (75.0)      (75.0)        (75.0)            0.0%            0.0%
  Capital Reserve                                            2,460.1     2,487.7       2,460.1            -1.1%            0.0%
 Profit reserve                                                  31.6        45.8          38.1          -31.2%          -17.2%
Asset valuation adjustments                                    (65.0)        30.4        (51.4)        -314.0%            26.6%
Cumulative translation adjustments                             494.8       285.9         560.2            73.1%          -11.7%
Accumulated Losses                                         (1,217.2)     (547.7)       (513.8)          122.3%          136.9%
Net Income for the period                                        34.5        23.5      (746.0)            46.7%        -104.6%
  Minority Interest                                            155.8       148.9         164.8             4.6%           -5.5%
TOTAL LIABILITIES                                          23,712.1     22,403.5      23,823.4             4.5%           -1.7%


                      Rua Chedid Jafet, 222 Bloco A - 1º andar - Vila Olímpia - São Paulo - SP – CEP: 04551-065
                        Tel: (11) 3792-8600/8650      www.marfrig.com.br/ri        e-mail: ri@marfrig.com.br
                                                                                                                                  18
CASH FLOW – R$ million                                                                    1Q12            1Q11     4Q11
 Operating Activities
NET INCOME FOR THE PERIOD                                                                  34,5            23,5    (138,6)
ITEMS NOT AFFECTING CASH                                                                  389,1           417,6     563,7
 Depreciation                                                                             121,7           116,8     125,1
 Amortization                                                                              64,6            61,6      68,5
 Minority interest                                                                         (5,2)            1,7      (2,9)
 Provision for contingencies and non appropriated tax credit                                2,1            (1,7)     12,1
 Deferred taxes                                                                           (55,8)          (41,5)    (77,8)
 Exchange variation over financing                                                       (153,4)          (77,0)    124,6
 Exchange variation over other assets and liabilities accounts                             58,7            45,4     (22,8)
 Interest expenses over financial debt                                                    214,0           176,2     219,2
 Interest expenses over financial leasing                                                   5,8            10,1       5,2
 Interest expenses over Debentures                                                        100,1            90,8      99,4
 Adjustment to present value                                                                2,6            (5,8)      0,3
 Contingency payment reversion                                                               -               -      (18,0)
 Fixed assets write-off                                                                    33,7            41,0      31,1
EQUITY CHANGES                                                                           (564,9)         (800,8)    278,8
 Accounts receivable from clients                                                         (34,8)            6,7      20,8
 Inventories                                                                              (20,9)         (284,1)    181,8
 Judicial deposits                                                                         (1,5)            4,8      (1,5)
 Accrued payroll and related charges                                                       (1,0)            1,2     (18,4)
 Suppliers                                                                               (231,3)           56,4     171,8
 Current and deferred taxes                                                              (121,8)         (233,8)    (25,8)
 Notes receivable and payable                                                             (57,8)         (206,8)      7,7
 Other assets and liabilities accounts                                                    (96,0)         (145,3)    (57,5)
CASH FLOW FROM OPERATING ACTIVITIES                                                      (141,3)         (359,7)    703,9
 Investing activities
    Investments                                                                           (0,7)           (0,0)     125,1
    Investment in fixed assets                                                           (189,5)         (278,4)   (228,4)
    Investment in intangible assets                                                       (1,3)           (5,6)     (0,2)

CASH FLOW FROM INVESTING ACTIVITIES                                                      (191,5)         (284,0)   (103,5)

 Financing activities
 Dividends / Interest on own capital paid in the period                                   (14,9)          (61,9)      0,0
Interest on Debentures                                                                    (62,8)             -         -
Debentures                                                                                  0,7           592,6        -
Loans and financing                                                                       321,4          (558,4)   (689,3)
Leasing payable                                                                           (17,6)          (18,1)    (28,9)
Treasury shares                                                                            (6,6)            1,4      (9,8)
CASH FLOW FROM FINANCING ACTIVITIES                                                       220,3           (44,4)   (728,0)
 Exchange variation over cash and equivalent (USD)                                          4,1              -       (0,8)
 Exchange variation over cash and equivalent                                              (47,4)          (25,1)     17,2
CASH FLOW FOR THE PERIOD                                                                 (155,8)         (713,2)   (111,2)
 Cash, banking accounts, short term investments
 Balance at the end of the period                                                        3.321,1         3.163,2   3.477,0
 Balance at the beginning of the period                                                  3.477,0         3.876,4   3.713,1
CHANGES IN THE PERIOD                                                                    (155,8)         (713,2)   (236,2)


                      Rua Chedid Jafet, 222 Bloco A - 1º andar - Vila Olímpia - São Paulo - SP – CEP: 04551-065
                        Tel: (11) 3792-8600/8650      www.marfrig.com.br/ri        e-mail: ri@marfrig.com.br
                                                                                                                             19
NET REVENUES BY SEGMENT / MARKET                                                                        Var %       Var %
                                                                 1Q12         1Q11          4Q11
(R$ Million)                                                                                         1Q12 x 1Q11 1Q12 x 4Q11
BEEF - BRAZIL                                                       866.7       1,090.0      1,007.5      -20.5%      -14.0%
Domestic Market                                                     600.9        760.5         714.4      -21.0%      -15.9%
Fresh Beef                                                          396.5        675.1         459.4      -41.3%      -13.7%
Processed and Elaborated Products                                   204.4         85.4         255.0      139.4%      -19.8%
Exports                                                             265.8        329.5         293.1      -19.3%       -9.3%
Fresh Beef                                                          224.1        297.9         265.6      -24.8%      -15.6%
Processed and Elaborated Products                                    41.7         31.7          27.5       31.6%       51.8%
BEEF - INTERNATIONAL                                                556.5        480.9         527.8       15.7%        5.4%
Domestic Market                                                     300.5        276.3         314.6           8.8%    -4.5%
Fresh Beef                                                          176.8        177.0         196.1       -0.1%       -9.8%
Processed and Elaborated Products                                   123.6         99.3         118.6       24.5%        4.3%
Exports                                                             256.0        204.6         213.2       25.1%       20.1%
Fresh Beef                                                          227.7        194.7         206.4       17.0%       10.4%
Processed and Elaborated Products                                    28.2            9.9           6.8    184.9%      312.7%
Others                                                              314.2        352.9         354.4      -11.0%      -11.4%
TOTAL - BEEF                                                       1,737.3      1,923.8      1,889.8       -9.7%       -8.1%
Fresh Beef                                                         1,025.2      1,344.6      1,127.5      -23.8%       -9.1%
Processed and Elaborated Products                                   398.0        226.3         407.9       75.9%       -2.4%
Others                                                              314.2        352.9         354.4      -11.0%      -11.4%


POULTRY & PORK - BRAZIL                                            1,341.9      1,364.3      1,655.9       -1.6%      -19.0%
Domestic Market                                                     526.2        422.3         576.0       24.6%       -8.7%
Fresh Poutry                                                         98.6         91.8         123.1           7.5%   -19.9%
Fresh Pork                                                           43.5         29.7          32.4       46.4%       34.4%
Processed and Elaborated Products                                   384.1        300.8         420.6       27.7%       -8.7%
Exports                                                             815.8        942.1       1,079.8      -13.4%      -24.5%
Fresh Poutry                                                        682.9        787.8         923.0      -13.3%      -26.0%
Fresh Pork                                                           77.3         93.6          97.5      -17.4%      -20.8%
Processed and Elaborated Products                                    55.6         60.7          59.3       -8.3%       -6.2%
POULTRY & PORK - INTERNATIONAL                                     1,825.0      1,652.5      1,877.9       10.4%       -2.8%
Domestic Market                                                    1,626.0      1,371.1      1,634.4       18.6%       -0.5%
Fresh Meat                                                          280.7        280.1         320.5           0.2%   -12.4%
Industrialized Products                                            1,345.3      1,091.0      1,313.9       23.3%        2.4%
Exports                                                             198.9        281.4         243.5      -29.3%      -18.3%
Fresh Meat                                                           28.8         47.0          36.6      -38.7%      -21.2%
Industrialized Products                                             170.1        234.4         206.9      -27.4%      -17.8%
Others                                                              328.3        311.6         363.1           5.4%    -9.6%
TOTAL - POULTRY & PORK                                             3,495.2      3,328.4      3,896.8           5.0%   -10.3%
Fresh Meat                                                         1,211.7      1,329.9      1,533.0       -8.9%      -21.0%
Processed and Elaborated Products                                  1,955.2      1,686.9      2,000.7       15.9%       -2.3%
Others                                                              328.3        311.6         363.1           5.4%    -9.6%


TOTAL - MARFRIG PROTEINS                                           5,232.5      5,252.1      5,786.6       -0.4%       -9.6%
Fresh Meat                                                         2,236.9      2,674.5      2,660.5      -16.4%      -15.9%
Processed and Elaborated Products                                  2,353.2      1,913.2      2,408.6       23.0%       -2.3%
Others                                                              642.5        664.5         717.5       -3.3%      -10.5%
TOTAL MARFRIG PROTEINS                                             5,232.5      5,252.1      5,786.6       -0.4%       -9.6%
Domestic markets                                                   3,053.6      2,830.1      3,239.5           7.9%    -5.7%
Export markets                                                     1,536.5      1,757.6      1,829.6      -12.6%      -16.0%
Others                                                              642.5        664.5         717.5       -3.3%      -10.5%


                   Rua Chedid Jafet, 222 Bloco A - 1º andar - Vila Olímpia - São Paulo - SP – CEP: 04551-065
                     Tel: (11) 3792-8600/8650      www.marfrig.com.br/ri        e-mail: ri@marfrig.com.br
                                                                                                                               20
VOLUME BY SEGMENT / MARKET                                                                                Var %            Var %
                                                               1Q12          1Q11          4Q11
(TONNS)                                                                                                1Q12 x1Q11       1Q12 x 4Q11
BEEF - BRAZIL                                                     93,550       139,782       103,854          -33.1%              -9.9%
Domestic Market                                                   63,956        95,878        74,795         -33.3%            -14.5%
Fresh Beef                                                        48,521        86,534        55,514         -43.9%            -12.6%
Processed and Elaborated Products                                 15,435         9,344        19,281           65.2%           -19.9%
Exports                                                           29,593        43,904        29,059         -32.6%               1.8%
Fresh Beef                                                        26,065        40,489        26,414         -35.6%              -1.3%
Processed and Elaborated Products                                  3,529         3,415         2,645            3.3%            33.4%
BEEF - INTERNATIONAL                                              64,363        63,605        62,480            1.2%               3.0%
Domestic Market                                                   43,866        45,158        45,297           -2.9%             -3.2%
Fresh Beef                                                        25,168        28,854        27,914         -12.8%              -9.8%
Processed and Elaborated Products                                 18,697        16,304        17,382           14.7%              7.6%
Exports                                                           20,497        18,447        17,183          11.1%             19.3%
Fresh Beef                                                        17,921        17,318        16,338            3.5%              9.7%
Processed and Elaborated Products                                  2,577         1,129           845         128.2%           204.8%
Others                                                           125,867       174,939       147,125          -28.1%            -14.4%
TOTAL - BEEF                                                     283,779       378,326      313,459           -25.0%             -9.5%
Fresh Beef                                                       117,675       173,195      126,180          -32.1%             -6.7%
Processed and Elaborated Products                                 40,237        30,192       40,154            33.3%             0.2%
Others                                                           125,867       174,939      147,125          -28.1%            -14.4%

POULTRY & PORK - BRAZIL                                          331,674       362,508      353,928            -8.5%             -6.3%
Domestic Market                                                  121,969       117,363      124,766            3.9%             -2.2%
Fresh Poutry                                                      26,601        30,278       27,531          -12.1%             -3.4%
Fresh Pork                                                         9,390         8,799        8,379            6.7%             12.1%
Processed and Elaborated Products                                 85,978        78,286       88,856            9.8%             -3.2%
Exports                                                          209,705       245,145      229,162          -14.5%             -8.5%
Fresh Poutry                                                     182,646       213,560      200,056          -14.5%             -8.7%
Fresh Pork                                                        17,286        21,240       19,789          -18.6%            -12.6%
Processed and Elaborated Products                                  9,773        10,345        9,317           -5.5%              4.9%
POULTRY & PORK - INTERNATIONAL                                   352,926       353,356      364,934            -0.1%             -3.3%
Domestic Market                                                  310,452       310,050      323,890            0.1%             -4.1%
Fresh Meat                                                        29,898        36,857       33,002          -18.9%             -9.4%
Industrialized Products                                          280,554       273,193      290,888            2.7%             -3.6%
Exports                                                           42,474        43,306       41,044           -1.9%              3.5%
Fresh Meat                                                         5,013        10,257        6,584          -51.1%            -23.9%
Industrialized Products                                           37,461        33,049       34,460           13.4%              8.7%
Others                                                           147,182       126,030      149,592           16.8%              -1.6%
TOTAL - POULTRY & PORK                                           831,782       841,894       868,455           -1.2%             -4.2%
Fresh Meat                                                       270,834       320,991       295,341         -15.6%              -8.3%
Processed and Elaborated Products                                413,766       394,873       423,521             4.8%            -2.3%
Others                                                           147,182       126,030       149,592          16.8%              -1.6%


TOTAL - MARFRIG PROTEINS                                       1,115,561     1,220,220     1,181,914           -8.6%             -5.6%
Fresh Meat                                                       388,509       494,186       421,522         -21.4%              -7.8%
Processed and Elaborated Products                                454,004       425,065       463,675             6.8%            -2.1%
Others                                                           273,049       300,969       296,718           -9.3%             -8.0%
TOTAL MARFRIG PROTEÍNAS                                        1,115,561     1,220,220     1,181,914           -8.6%             -5.6%
Domestic markets                                                 540,243       568,449       568,748           -5.0%             -5.0%
Export markets                                                   302,270       350,802       316,449         -13.8%              -4.5%
Others                                                           273,049       300,969       296,718           -9.3%             -8.0%


                     Rua Chedid Jafet, 222 Bloco A - 1º andar - Vila Olímpia - São Paulo - SP – CEP: 04551-065
                       Tel: (11) 3792-8600/8650      www.marfrig.com.br/ri        e-mail: ri@marfrig.com.br
                                                                                                                                     21
AVERAGE PRICE BY MARKET / SEGMENT                                                          Var %           Var %
                                              1Q12          1Q11          4Q11
(R$/kg)                                                                                 1Q12 x 1Q11     1Q12 x 4Q11
BEEF - BRAZIL                                        9.26          7.80          9.70           18.8%           -4.5%
Domestic Market                                      9.40          7.93          9.55          18.5%            -1.6%
Fresh Beef                                           8.17          7.80          8.28           4.7%            -1.3%
Processed and Elaborated Products                 13.24            9.14      13.23             44.9%            0.1%
Exports                                              8.98          7.51      10.09             19.7%           -11.0%
Fresh Beef                                           8.60          7.36      10.06             16.9%           -14.5%
Processed and Elaborated Products                 11.82            9.28      10.38             27.4%           13.8%
BEEF - INTERNATIONAL                                 8.65          7.56          8.45          14.4%            2.3%
Domestic Market                                      6.85          6.12          6.95          12.0%            -1.4%
Fresh Beef                                           7.03          6.13          7.02          14.5%            0.0%
Processed and Elaborated Products                    6.61          6.09          6.82           8.6%            -3.1%
Exports                                           12.49        11.09         12.41             12.6%            0.6%
Fresh Beef                                        12.71        11.24         12.63             13.1%            0.6%
Processed and Elaborated Products                 10.96            8.78          8.09          24.8%           35.4%
Others                                               2.50          2.02          2.41          23.7%            3.6%
TOTAL - BEEF                                         6.12          5.08          6.03          20.4%            1.5%
Fresh Beef                                           8.71          7.76          8.94          12.2%            -2.5%
Processed and Elaborated Products                    9.89          7.49      10.16             32.0%            -2.6%
Otherrs                                              2.50          2.02          2.41          23.7%            3.6%


POULTRY & PORK - BRAZIL                              4.05          3.76          4.68           7.5%           -13.5%
Domestic Market                                      4.31          3.60          4.62          19.9%            -6.6%
Fresh Poutry                                         3.71          3.03          4.47          22.3%           -17.1%
Fresh Pork                                           4.63          3.37          3.86          37.2%           19.9%
Processed and Elaborated Products                    4.47          3.84          4.73          16.3%            -5.6%
Exports                                              3.89          3.84          4.71           1.2%           -17.4%
Fresh Poutry                                         3.74          3.69          4.61           1.4%           -19.0%
Fresh Pork                                           4.47          4.41          4.93           1.5%            -9.3%
Processed and Elaborated Products                    5.69          5.87          6.37           -3.0%          -10.6%
POULTRY & PORK - INTERNATIONAL                       5.17          4.68          5.15          10.6%            0.5%
Domestic Market                                      5.24          4.42          5.05          18.4%            3.8%
Fresh Meat                                           9.39          7.60          9.71          23.5%            -3.3%
Industrialized Products                              4.80          3.99          4.52          20.1%            6.2%
Exports                                              4.68          6.50          5.93          -27.9%          -21.0%
Fresh Meat                                           5.75          4.58          5.55          25.4%            3.5%
Industrialized Products                              4.54          7.09          6.00          -36.0%          -24.4%
Others                                               2.23          2.47          2.43           -9.8%           -8.1%
TOTAL - POULTRY & PORK                               4.20          3.95          4.49           6.3%            -6.4%
Fresh Meat                                           4.47          4.14          5.19           8.0%           -13.8%
Processed and Elaborated Products                    4.73          4.27          4.72          10.6%            0.0%
Others                                               2.23          2.47          2.43           -9.8%           -8.1%


TOTAL - MARFRIG PROTEINS                             4.69          4.30          4.90           9.0%            -4.2%
Fresh Meat                                           5.76          5.41          6.31           6.4%            -8.8%
Processed and Elaborated Products                    5.18          4.50          5.19          15.2%            -0.2%
Others                                               2.35          2.21          2.42           6.6%            -2.7%
TOTAL - MARFRIG PROTEINS                             4.69          4.30          4.90           9.0%            -4.2%
Domestic Markets                                     5.65          4.98          5.70          13.5%            -0.8%
Exports                                              5.08          5.01          5.78           1.5%           -12.1%
Others                                               2.35          2.21          2.42           6.6%            -2.7%


             Rua Chedid Jafet, 222 Bloco A - 1º andar - Vila Olímpia - São Paulo - SP – CEP: 04551-065
               Tel: (11) 3792-8600/8650      www.marfrig.com.br/ri        e-mail: ri@marfrig.com.br
                                                                                                                        22

More Related Content

What's hot

WEG 2Q09 Earnings Conference Call Presentation
WEG 2Q09 Earnings Conference Call PresentationWEG 2Q09 Earnings Conference Call Presentation
WEG 2Q09 Earnings Conference Call PresentationWEG
 
Q2 15 earnings slides-final
Q2 15 earnings slides-finalQ2 15 earnings slides-final
Q2 15 earnings slides-finalInvestorBruker
 
Press Release 1Q12
Press Release 1Q12Press Release 1Q12
Press Release 1Q12Gafisa RI !
 
air products & chemicals 5 December 2007 Citi Basic Materials
air products & chemicals 5 December 2007 Citi Basic Materialsair products & chemicals 5 December 2007 Citi Basic Materials
air products & chemicals 5 December 2007 Citi Basic Materialsfinance26
 
Non-Deal Roadshow'
Non-Deal Roadshow'Non-Deal Roadshow'
Non-Deal Roadshow'CPFL RI
 
goodrich 4Q06_Slides
goodrich  4Q06_Slidesgoodrich  4Q06_Slides
goodrich 4Q06_Slidesfinance44
 
Gail ru4 qfy2010-18-05-10
Gail ru4 qfy2010-18-05-10Gail ru4 qfy2010-18-05-10
Gail ru4 qfy2010-18-05-10Angel Broking
 
textron annual report 1999
textron annual report 1999textron annual report 1999
textron annual report 1999finance21
 
Lehman Brothers 2007 Industrial Select Conference
	Lehman Brothers 2007 Industrial Select Conference	Lehman Brothers 2007 Industrial Select Conference
Lehman Brothers 2007 Industrial Select Conferencefinance10
 
LEAR 2005 sholders meet
 LEAR  2005 sholders meet LEAR  2005 sholders meet
LEAR 2005 sholders meetfinance16
 
ApresentaçãO Resultados 1 T09 Eng Final
ApresentaçãO Resultados 1 T09 Eng FinalApresentaçãO Resultados 1 T09 Eng Final
ApresentaçãO Resultados 1 T09 Eng Finalguestdf58562
 
Q1 2009 Earning Report of Life Technologies Corp.
Q1 2009 Earning Report of Life Technologies Corp.Q1 2009 Earning Report of Life Technologies Corp.
Q1 2009 Earning Report of Life Technologies Corp.earningreport earningreport
 
monsanto 01-08-08
monsanto 01-08-08monsanto 01-08-08
monsanto 01-08-08finance28
 
3Q 2008T RANSCRIPT
3Q 2008T RANSCRIPT3Q 2008T RANSCRIPT
3Q 2008T RANSCRIPTfinance22
 

What's hot (17)

WEG 2Q09 Earnings Conference Call Presentation
WEG 2Q09 Earnings Conference Call PresentationWEG 2Q09 Earnings Conference Call Presentation
WEG 2Q09 Earnings Conference Call Presentation
 
Luminex Q4 2010 Earnings Call
Luminex Q4 2010 Earnings CallLuminex Q4 2010 Earnings Call
Luminex Q4 2010 Earnings Call
 
Q2 15 earnings slides-final
Q2 15 earnings slides-finalQ2 15 earnings slides-final
Q2 15 earnings slides-final
 
Press Release 1Q12
Press Release 1Q12Press Release 1Q12
Press Release 1Q12
 
air products & chemicals 5 December 2007 Citi Basic Materials
air products & chemicals 5 December 2007 Citi Basic Materialsair products & chemicals 5 December 2007 Citi Basic Materials
air products & chemicals 5 December 2007 Citi Basic Materials
 
Non-Deal Roadshow'
Non-Deal Roadshow'Non-Deal Roadshow'
Non-Deal Roadshow'
 
goodrich 4Q06_Slides
goodrich  4Q06_Slidesgoodrich  4Q06_Slides
goodrich 4Q06_Slides
 
Gail ru4 qfy2010-18-05-10
Gail ru4 qfy2010-18-05-10Gail ru4 qfy2010-18-05-10
Gail ru4 qfy2010-18-05-10
 
textron annual report 1999
textron annual report 1999textron annual report 1999
textron annual report 1999
 
Lehman Brothers 2007 Industrial Select Conference
	Lehman Brothers 2007 Industrial Select Conference	Lehman Brothers 2007 Industrial Select Conference
Lehman Brothers 2007 Industrial Select Conference
 
Apresentação resultados eng 1 t10.final
Apresentação resultados eng 1 t10.finalApresentação resultados eng 1 t10.final
Apresentação resultados eng 1 t10.final
 
LEAR 2005 sholders meet
 LEAR  2005 sholders meet LEAR  2005 sholders meet
LEAR 2005 sholders meet
 
ApresentaçãO Resultados 1 T09 Eng Final
ApresentaçãO Resultados 1 T09 Eng FinalApresentaçãO Resultados 1 T09 Eng Final
ApresentaçãO Resultados 1 T09 Eng Final
 
Q1 2009 Earning Report of Life Technologies Corp.
Q1 2009 Earning Report of Life Technologies Corp.Q1 2009 Earning Report of Life Technologies Corp.
Q1 2009 Earning Report of Life Technologies Corp.
 
monsanto 01-08-08
monsanto 01-08-08monsanto 01-08-08
monsanto 01-08-08
 
Pirelli 1 H09 Financial Results
Pirelli 1 H09 Financial ResultsPirelli 1 H09 Financial Results
Pirelli 1 H09 Financial Results
 
3Q 2008T RANSCRIPT
3Q 2008T RANSCRIPT3Q 2008T RANSCRIPT
3Q 2008T RANSCRIPT
 

Viewers also liked

Agronegocio brasilemfoco 17-04-12
Agronegocio brasilemfoco 17-04-12Agronegocio brasilemfoco 17-04-12
Agronegocio brasilemfoco 17-04-12cleberson.souza
 
Apresentação kit festa 2012
Apresentação kit festa 2012Apresentação kit festa 2012
Apresentação kit festa 2012cleberson.souza
 
Corporate run 2012 etapa sp
Corporate run 2012   etapa spCorporate run 2012   etapa sp
Corporate run 2012 etapa spcleberson.souza
 
Agronegocio Brasil em Foco
Agronegocio Brasil em FocoAgronegocio Brasil em Foco
Agronegocio Brasil em Fococleberson.souza
 
Apresentação de resultados 1 t12
Apresentação de resultados 1 t12Apresentação de resultados 1 t12
Apresentação de resultados 1 t12cleberson.souza
 

Viewers also liked (8)

Mrfg release 2 t12
Mrfg release 2 t12Mrfg release 2 t12
Mrfg release 2 t12
 
Agronegocio brasilemfoco 17-04-12
Agronegocio brasilemfoco 17-04-12Agronegocio brasilemfoco 17-04-12
Agronegocio brasilemfoco 17-04-12
 
Apresentação kit festa 2012
Apresentação kit festa 2012Apresentação kit festa 2012
Apresentação kit festa 2012
 
Corporate run 2012 etapa sp
Corporate run 2012   etapa spCorporate run 2012   etapa sp
Corporate run 2012 etapa sp
 
Agronegocio Brasil em Foco
Agronegocio Brasil em FocoAgronegocio Brasil em Foco
Agronegocio Brasil em Foco
 
Conjuntura Ma
Conjuntura MaConjuntura Ma
Conjuntura Ma
 
Apresentação de resultados 1 t12
Apresentação de resultados 1 t12Apresentação de resultados 1 t12
Apresentação de resultados 1 t12
 
Brand Positioning Workshop
Brand Positioning WorkshopBrand Positioning Workshop
Brand Positioning Workshop
 

Similar to Mrfg release 1_t12_eng_14maio2012_vfinal

2Q11 Presentation
2Q11 Presentation2Q11 Presentation
2Q11 PresentationGafisa RI !
 
omnicom group Q4 2005 Investor Presentation
omnicom group  Q4 2005 Investor Presentation omnicom group  Q4 2005 Investor Presentation
omnicom group Q4 2005 Investor Presentation finance22
 
omnicom group Q4 2006 Investor Presentation
omnicom group  Q4 2006 Investor Presentationomnicom group  Q4 2006 Investor Presentation
omnicom group Q4 2006 Investor Presentationfinance22
 
dover Q206_Slides
dover Q206_Slidesdover Q206_Slides
dover Q206_Slidesfinance30
 
Colgate ru4 qfy2010-270510
Colgate ru4 qfy2010-270510Colgate ru4 qfy2010-270510
Colgate ru4 qfy2010-270510Angel Broking
 
dover Q306_Slides_2
dover Q306_Slides_2dover Q306_Slides_2
dover Q306_Slides_2finance30
 
omnicom group Q2 2006 Investor Presentation
omnicom group  Q2 2006 Investor Presentationomnicom group  Q2 2006 Investor Presentation
omnicom group Q2 2006 Investor Presentationfinance22
 
Final earnings presentation_conf_call_slides_1_q2013
Final earnings presentation_conf_call_slides_1_q2013Final earnings presentation_conf_call_slides_1_q2013
Final earnings presentation_conf_call_slides_1_q2013United_Stationers
 
Presentation 3Q 2011 (english)
Presentation 3Q 2011 (english)Presentation 3Q 2011 (english)
Presentation 3Q 2011 (english)ideiasnet
 
Presentation call3 t 2011 (english)
Presentation call3 t 2011 (english)Presentation call3 t 2011 (english)
Presentation call3 t 2011 (english)ideiasnet
 
Conference Call Presentation 4Q09
Conference Call Presentation 4Q09Conference Call Presentation 4Q09
Conference Call Presentation 4Q09Tempo
 
Recticel Annual Results 2011 - ENGLISH
Recticel Annual Results 2011 - ENGLISHRecticel Annual Results 2011 - ENGLISH
Recticel Annual Results 2011 - ENGLISHRecticel NV/SA
 

Similar to Mrfg release 1_t12_eng_14maio2012_vfinal (20)

Investors' Meeting Presentation - 4Q09 Results
Investors' Meeting Presentation - 4Q09 ResultsInvestors' Meeting Presentation - 4Q09 Results
Investors' Meeting Presentation - 4Q09 Results
 
2Q11 Presentation
2Q11 Presentation2Q11 Presentation
2Q11 Presentation
 
Call 4Q11
Call 4Q11 Call 4Q11
Call 4Q11
 
omnicom group Q4 2005 Investor Presentation
omnicom group  Q4 2005 Investor Presentation omnicom group  Q4 2005 Investor Presentation
omnicom group Q4 2005 Investor Presentation
 
Presentation CCR - 3Q09
Presentation CCR - 3Q09Presentation CCR - 3Q09
Presentation CCR - 3Q09
 
omnicom group Q4 2006 Investor Presentation
omnicom group  Q4 2006 Investor Presentationomnicom group  Q4 2006 Investor Presentation
omnicom group Q4 2006 Investor Presentation
 
dover Q206_Slides
dover Q206_Slidesdover Q206_Slides
dover Q206_Slides
 
Colgate ru4 qfy2010-270510
Colgate ru4 qfy2010-270510Colgate ru4 qfy2010-270510
Colgate ru4 qfy2010-270510
 
Presentation 4 t10 english
Presentation 4 t10   englishPresentation 4 t10   english
Presentation 4 t10 english
 
Piaggio Group - First Half 2010 Financial Results
Piaggio Group - First Half 2010 Financial ResultsPiaggio Group - First Half 2010 Financial Results
Piaggio Group - First Half 2010 Financial Results
 
Colgate Palmolive
Colgate PalmoliveColgate Palmolive
Colgate Palmolive
 
dover Q306_Slides_2
dover Q306_Slides_2dover Q306_Slides_2
dover Q306_Slides_2
 
Piaggio Group - Full Year 2010 Financial Results
Piaggio Group - Full Year 2010 Financial ResultsPiaggio Group - Full Year 2010 Financial Results
Piaggio Group - Full Year 2010 Financial Results
 
omnicom group Q2 2006 Investor Presentation
omnicom group  Q2 2006 Investor Presentationomnicom group  Q2 2006 Investor Presentation
omnicom group Q2 2006 Investor Presentation
 
Final earnings presentation_conf_call_slides_1_q2013
Final earnings presentation_conf_call_slides_1_q2013Final earnings presentation_conf_call_slides_1_q2013
Final earnings presentation_conf_call_slides_1_q2013
 
First Quarter 2006 Earnings Presentation
	First Quarter 2006 Earnings Presentation	First Quarter 2006 Earnings Presentation
First Quarter 2006 Earnings Presentation
 
Presentation 3Q 2011 (english)
Presentation 3Q 2011 (english)Presentation 3Q 2011 (english)
Presentation 3Q 2011 (english)
 
Presentation call3 t 2011 (english)
Presentation call3 t 2011 (english)Presentation call3 t 2011 (english)
Presentation call3 t 2011 (english)
 
Conference Call Presentation 4Q09
Conference Call Presentation 4Q09Conference Call Presentation 4Q09
Conference Call Presentation 4Q09
 
Recticel Annual Results 2011 - ENGLISH
Recticel Annual Results 2011 - ENGLISHRecticel Annual Results 2011 - ENGLISH
Recticel Annual Results 2011 - ENGLISH
 

More from cleberson.souza

Agronegócio em análise
Agronegócio em análiseAgronegócio em análise
Agronegócio em análisecleberson.souza
 
Estudo global sobre responsabilidade social mar2012
Estudo global sobre responsabilidade social mar2012Estudo global sobre responsabilidade social mar2012
Estudo global sobre responsabilidade social mar2012cleberson.souza
 
Mrfg release 4_t11_por_24mar2012_vfinal (2)
Mrfg release 4_t11_por_24mar2012_vfinal (2)Mrfg release 4_t11_por_24mar2012_vfinal (2)
Mrfg release 4_t11_por_24mar2012_vfinal (2)cleberson.souza
 
Cenario economico global e domestico
Cenario economico global e domesticoCenario economico global e domestico
Cenario economico global e domesticocleberson.souza
 
Cenario economico global e domestico
Cenario economico global e domesticoCenario economico global e domestico
Cenario economico global e domesticocleberson.souza
 

More from cleberson.souza (12)

Conjuntura 20 04_12
Conjuntura 20 04_12Conjuntura 20 04_12
Conjuntura 20 04_12
 
Agronegocio no mercosul
Agronegocio no mercosulAgronegocio no mercosul
Agronegocio no mercosul
 
Industria de Alimentos
Industria de AlimentosIndustria de Alimentos
Industria de Alimentos
 
Agronegócio em análise
Agronegócio em análiseAgronegócio em análise
Agronegócio em análise
 
Estudo global sobre responsabilidade social mar2012
Estudo global sobre responsabilidade social mar2012Estudo global sobre responsabilidade social mar2012
Estudo global sobre responsabilidade social mar2012
 
Mrfg release 4_t11_por_24mar2012_vfinal (2)
Mrfg release 4_t11_por_24mar2012_vfinal (2)Mrfg release 4_t11_por_24mar2012_vfinal (2)
Mrfg release 4_t11_por_24mar2012_vfinal (2)
 
Carne avicola
Carne avicolaCarne avicola
Carne avicola
 
Carne suina
Carne suinaCarne suina
Carne suina
 
Carne bovina
Carne bovinaCarne bovina
Carne bovina
 
Milho projeção 2012
Milho projeção 2012Milho projeção 2012
Milho projeção 2012
 
Cenario economico global e domestico
Cenario economico global e domesticoCenario economico global e domestico
Cenario economico global e domestico
 
Cenario economico global e domestico
Cenario economico global e domesticoCenario economico global e domestico
Cenario economico global e domestico
 

Recently uploaded

FULL ENJOY Call Girls In Mahipalpur Delhi Contact Us 8377877756
FULL ENJOY Call Girls In Mahipalpur Delhi Contact Us 8377877756FULL ENJOY Call Girls In Mahipalpur Delhi Contact Us 8377877756
FULL ENJOY Call Girls In Mahipalpur Delhi Contact Us 8377877756dollysharma2066
 
Cracking the Cultural Competence Code.pptx
Cracking the Cultural Competence Code.pptxCracking the Cultural Competence Code.pptx
Cracking the Cultural Competence Code.pptxWorkforce Group
 
The Abortion pills for sale in Qatar@Doha [+27737758557] []Deira Dubai Kuwait
The Abortion pills for sale in Qatar@Doha [+27737758557] []Deira Dubai KuwaitThe Abortion pills for sale in Qatar@Doha [+27737758557] []Deira Dubai Kuwait
The Abortion pills for sale in Qatar@Doha [+27737758557] []Deira Dubai Kuwaitdaisycvs
 
Call Girls In Majnu Ka Tilla 959961~3876 Shot 2000 Night 8000
Call Girls In Majnu Ka Tilla 959961~3876 Shot 2000 Night 8000Call Girls In Majnu Ka Tilla 959961~3876 Shot 2000 Night 8000
Call Girls In Majnu Ka Tilla 959961~3876 Shot 2000 Night 8000dlhescort
 
Call Girls Service In Old Town Dubai ((0551707352)) Old Town Dubai Call Girl ...
Call Girls Service In Old Town Dubai ((0551707352)) Old Town Dubai Call Girl ...Call Girls Service In Old Town Dubai ((0551707352)) Old Town Dubai Call Girl ...
Call Girls Service In Old Town Dubai ((0551707352)) Old Town Dubai Call Girl ...allensay1
 
Marel Q1 2024 Investor Presentation from May 8, 2024
Marel Q1 2024 Investor Presentation from May 8, 2024Marel Q1 2024 Investor Presentation from May 8, 2024
Marel Q1 2024 Investor Presentation from May 8, 2024Marel
 
Organizational Transformation Lead with Culture
Organizational Transformation Lead with CultureOrganizational Transformation Lead with Culture
Organizational Transformation Lead with CultureSeta Wicaksana
 
Falcon Invoice Discounting: The best investment platform in india for investors
Falcon Invoice Discounting: The best investment platform in india for investorsFalcon Invoice Discounting: The best investment platform in india for investors
Falcon Invoice Discounting: The best investment platform in india for investorsFalcon Invoice Discounting
 
Call Girls In Noida 959961⊹3876 Independent Escort Service Noida
Call Girls In Noida 959961⊹3876 Independent Escort Service NoidaCall Girls In Noida 959961⊹3876 Independent Escort Service Noida
Call Girls In Noida 959961⊹3876 Independent Escort Service Noidadlhescort
 
Call Now ☎️🔝 9332606886🔝 Call Girls ❤ Service In Bhilwara Female Escorts Serv...
Call Now ☎️🔝 9332606886🔝 Call Girls ❤ Service In Bhilwara Female Escorts Serv...Call Now ☎️🔝 9332606886🔝 Call Girls ❤ Service In Bhilwara Female Escorts Serv...
Call Now ☎️🔝 9332606886🔝 Call Girls ❤ Service In Bhilwara Female Escorts Serv...Anamikakaur10
 
Dr. Admir Softic_ presentation_Green Club_ENG.pdf
Dr. Admir Softic_ presentation_Green Club_ENG.pdfDr. Admir Softic_ presentation_Green Club_ENG.pdf
Dr. Admir Softic_ presentation_Green Club_ENG.pdfAdmir Softic
 
It will be International Nurses' Day on 12 May
It will be International Nurses' Day on 12 MayIt will be International Nurses' Day on 12 May
It will be International Nurses' Day on 12 MayNZSG
 
Falcon Invoice Discounting: Empowering Your Business Growth
Falcon Invoice Discounting: Empowering Your Business GrowthFalcon Invoice Discounting: Empowering Your Business Growth
Falcon Invoice Discounting: Empowering Your Business GrowthFalcon investment
 
Call Girls Kengeri Satellite Town Just Call 👗 7737669865 👗 Top Class Call Gir...
Call Girls Kengeri Satellite Town Just Call 👗 7737669865 👗 Top Class Call Gir...Call Girls Kengeri Satellite Town Just Call 👗 7737669865 👗 Top Class Call Gir...
Call Girls Kengeri Satellite Town Just Call 👗 7737669865 👗 Top Class Call Gir...amitlee9823
 
How to Get Started in Social Media for Art League City
How to Get Started in Social Media for Art League CityHow to Get Started in Social Media for Art League City
How to Get Started in Social Media for Art League CityEric T. Tung
 
Chandigarh Escorts Service 📞8868886958📞 Just📲 Call Nihal Chandigarh Call Girl...
Chandigarh Escorts Service 📞8868886958📞 Just📲 Call Nihal Chandigarh Call Girl...Chandigarh Escorts Service 📞8868886958📞 Just📲 Call Nihal Chandigarh Call Girl...
Chandigarh Escorts Service 📞8868886958📞 Just📲 Call Nihal Chandigarh Call Girl...Sheetaleventcompany
 
Mysore Call Girls 8617370543 WhatsApp Number 24x7 Best Services
Mysore Call Girls 8617370543 WhatsApp Number 24x7 Best ServicesMysore Call Girls 8617370543 WhatsApp Number 24x7 Best Services
Mysore Call Girls 8617370543 WhatsApp Number 24x7 Best ServicesDipal Arora
 
Quick Doctor In Kuwait +2773`7758`557 Kuwait Doha Qatar Dubai Abu Dhabi Sharj...
Quick Doctor In Kuwait +2773`7758`557 Kuwait Doha Qatar Dubai Abu Dhabi Sharj...Quick Doctor In Kuwait +2773`7758`557 Kuwait Doha Qatar Dubai Abu Dhabi Sharj...
Quick Doctor In Kuwait +2773`7758`557 Kuwait Doha Qatar Dubai Abu Dhabi Sharj...daisycvs
 
Value Proposition canvas- Customer needs and pains
Value Proposition canvas- Customer needs and painsValue Proposition canvas- Customer needs and pains
Value Proposition canvas- Customer needs and painsP&CO
 

Recently uploaded (20)

FULL ENJOY Call Girls In Mahipalpur Delhi Contact Us 8377877756
FULL ENJOY Call Girls In Mahipalpur Delhi Contact Us 8377877756FULL ENJOY Call Girls In Mahipalpur Delhi Contact Us 8377877756
FULL ENJOY Call Girls In Mahipalpur Delhi Contact Us 8377877756
 
Cracking the Cultural Competence Code.pptx
Cracking the Cultural Competence Code.pptxCracking the Cultural Competence Code.pptx
Cracking the Cultural Competence Code.pptx
 
The Abortion pills for sale in Qatar@Doha [+27737758557] []Deira Dubai Kuwait
The Abortion pills for sale in Qatar@Doha [+27737758557] []Deira Dubai KuwaitThe Abortion pills for sale in Qatar@Doha [+27737758557] []Deira Dubai Kuwait
The Abortion pills for sale in Qatar@Doha [+27737758557] []Deira Dubai Kuwait
 
Call Girls In Majnu Ka Tilla 959961~3876 Shot 2000 Night 8000
Call Girls In Majnu Ka Tilla 959961~3876 Shot 2000 Night 8000Call Girls In Majnu Ka Tilla 959961~3876 Shot 2000 Night 8000
Call Girls In Majnu Ka Tilla 959961~3876 Shot 2000 Night 8000
 
Call Girls Service In Old Town Dubai ((0551707352)) Old Town Dubai Call Girl ...
Call Girls Service In Old Town Dubai ((0551707352)) Old Town Dubai Call Girl ...Call Girls Service In Old Town Dubai ((0551707352)) Old Town Dubai Call Girl ...
Call Girls Service In Old Town Dubai ((0551707352)) Old Town Dubai Call Girl ...
 
Marel Q1 2024 Investor Presentation from May 8, 2024
Marel Q1 2024 Investor Presentation from May 8, 2024Marel Q1 2024 Investor Presentation from May 8, 2024
Marel Q1 2024 Investor Presentation from May 8, 2024
 
Organizational Transformation Lead with Culture
Organizational Transformation Lead with CultureOrganizational Transformation Lead with Culture
Organizational Transformation Lead with Culture
 
Falcon Invoice Discounting: The best investment platform in india for investors
Falcon Invoice Discounting: The best investment platform in india for investorsFalcon Invoice Discounting: The best investment platform in india for investors
Falcon Invoice Discounting: The best investment platform in india for investors
 
Call Girls In Noida 959961⊹3876 Independent Escort Service Noida
Call Girls In Noida 959961⊹3876 Independent Escort Service NoidaCall Girls In Noida 959961⊹3876 Independent Escort Service Noida
Call Girls In Noida 959961⊹3876 Independent Escort Service Noida
 
Call Now ☎️🔝 9332606886🔝 Call Girls ❤ Service In Bhilwara Female Escorts Serv...
Call Now ☎️🔝 9332606886🔝 Call Girls ❤ Service In Bhilwara Female Escorts Serv...Call Now ☎️🔝 9332606886🔝 Call Girls ❤ Service In Bhilwara Female Escorts Serv...
Call Now ☎️🔝 9332606886🔝 Call Girls ❤ Service In Bhilwara Female Escorts Serv...
 
Dr. Admir Softic_ presentation_Green Club_ENG.pdf
Dr. Admir Softic_ presentation_Green Club_ENG.pdfDr. Admir Softic_ presentation_Green Club_ENG.pdf
Dr. Admir Softic_ presentation_Green Club_ENG.pdf
 
(Anamika) VIP Call Girls Napur Call Now 8617697112 Napur Escorts 24x7
(Anamika) VIP Call Girls Napur Call Now 8617697112 Napur Escorts 24x7(Anamika) VIP Call Girls Napur Call Now 8617697112 Napur Escorts 24x7
(Anamika) VIP Call Girls Napur Call Now 8617697112 Napur Escorts 24x7
 
It will be International Nurses' Day on 12 May
It will be International Nurses' Day on 12 MayIt will be International Nurses' Day on 12 May
It will be International Nurses' Day on 12 May
 
Falcon Invoice Discounting: Empowering Your Business Growth
Falcon Invoice Discounting: Empowering Your Business GrowthFalcon Invoice Discounting: Empowering Your Business Growth
Falcon Invoice Discounting: Empowering Your Business Growth
 
Call Girls Kengeri Satellite Town Just Call 👗 7737669865 👗 Top Class Call Gir...
Call Girls Kengeri Satellite Town Just Call 👗 7737669865 👗 Top Class Call Gir...Call Girls Kengeri Satellite Town Just Call 👗 7737669865 👗 Top Class Call Gir...
Call Girls Kengeri Satellite Town Just Call 👗 7737669865 👗 Top Class Call Gir...
 
How to Get Started in Social Media for Art League City
How to Get Started in Social Media for Art League CityHow to Get Started in Social Media for Art League City
How to Get Started in Social Media for Art League City
 
Chandigarh Escorts Service 📞8868886958📞 Just📲 Call Nihal Chandigarh Call Girl...
Chandigarh Escorts Service 📞8868886958📞 Just📲 Call Nihal Chandigarh Call Girl...Chandigarh Escorts Service 📞8868886958📞 Just📲 Call Nihal Chandigarh Call Girl...
Chandigarh Escorts Service 📞8868886958📞 Just📲 Call Nihal Chandigarh Call Girl...
 
Mysore Call Girls 8617370543 WhatsApp Number 24x7 Best Services
Mysore Call Girls 8617370543 WhatsApp Number 24x7 Best ServicesMysore Call Girls 8617370543 WhatsApp Number 24x7 Best Services
Mysore Call Girls 8617370543 WhatsApp Number 24x7 Best Services
 
Quick Doctor In Kuwait +2773`7758`557 Kuwait Doha Qatar Dubai Abu Dhabi Sharj...
Quick Doctor In Kuwait +2773`7758`557 Kuwait Doha Qatar Dubai Abu Dhabi Sharj...Quick Doctor In Kuwait +2773`7758`557 Kuwait Doha Qatar Dubai Abu Dhabi Sharj...
Quick Doctor In Kuwait +2773`7758`557 Kuwait Doha Qatar Dubai Abu Dhabi Sharj...
 
Value Proposition canvas- Customer needs and pains
Value Proposition canvas- Customer needs and painsValue Proposition canvas- Customer needs and pains
Value Proposition canvas- Customer needs and pains
 

Mrfg release 1_t12_eng_14maio2012_vfinal

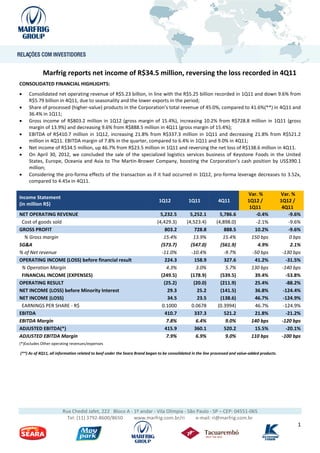
  • 1. Marfrig reports net income of R$34.5 million, reversing the loss recorded in 4Q11 CONSOLIDATED FINANCIAL HIGHLIGHTS:  Consolidated net operating revenue of R$5.23 billion, in line with the R$5.25 billion recorded in 1Q11 and down 9.6% from R$5.79 billion in 4Q11, due to seasonality and the lower exports in the period;  Share of processed (higher-value) products in the Corporation’s total revenue of 45.0%, compared to 41.6%(**) in 4Q11 and 36.4% in 1Q11;  Gross income of R$803.2 million in 1Q12 (gross margin of 15.4%), increasing 10.2% from R$728.8 million in 1Q11 (gross margin of 13.9%) and decreasing 9.6% from R$888.5 million in 4Q11 (gross margin of 15.4%);  EBITDA of R$410.7 million in 1Q12, increasing 21.8% from R$337.3 million in 1Q11 and decreasing 21.8% from R$521.2 million in 4Q11. EBITDA margin of 7.8% in the quarter, compared to 6.4% in 1Q11 and 9.0% in 4Q11;  Net income of R$34.5 million, up 46.7% from R$23.5 million in 1Q11 and reversing the net loss of R$138.6 million in 4Q11.  On April 30, 2012, we concluded the sale of the specialized logistics services business of Keystone Foods in the United States, Europe, Oceania and Asia to The Martin-Brower Company, boosting the Corporation’s cash position by US$390.1 million;  Considering the pro-forma effects of the transaction as if it had occurred in 1Q12, pro-forma leverage decreases to 3.52x, compared to 4.45x in 4Q11. Var. % Var. % Income Statement 1Q12 1Q11 4Q11 1Q12 / 1Q12 / (in million R$) 1Q11 4Q11 NET OPERATING REVENUE 5,232.5 5,252.1 5,786.6 -0.4% -9.6% Cost of goods sold (4,429.3) (4,523.4) (4,898.0) -2.1% -9.6% GROSS PROFIT 803.2 728.8 888.5 10.2% -9.6% % Gross margin 15.4% 13.9% 15.4% 150 bps 0 bps SG&A (573.7) (547.0) (561.9) 4.9% 2.1% % of Net revenue -11.0% -10.4% -9.7% -50 bps -130 bps OPERATING INCOME (LOSS) before financial result 224.3 158.9 327.6 41.2% -31.5% % Operation Margin 4.3% 3.0% 5.7% 130 bps -140 bps FINANCIAL INCOME (EXPENSES) (249.5) (178.9) (539.5) 39.4% -53.8% OPERATING RESULT (25.2) (20.0) (211.9) 25.4% -88.2% NET INCOME (LOSS) before Minority Interest 29.3 25.2 (141.5) 36.8% -124.4% NET INCOME (LOSS) 34.5 23.5 (138.6) 46.7% -124.9% EARNINGS PER SHARE - R$ 0.1000 0.0678 (0.3994) 46.7% -124.9% EBITDA 410.7 337.3 521.2 21.8% -21.2% EBITDA Margin 7.8% 6.4% 9.0% 140 bps -120 bps ADJUSTED EBITDA(*) 415.9 360.1 520.2 15.5% -20.1% ADJUSTED EBITDA Margin 7.9% 6.9% 9.0% 110 bps -100 bps (*)Excludes Other operating revenues/expenses (**) As of 4Q11, all information related to beef under the Seara Brand began to be consolidated in the line processed and value-added products. Rua Chedid Jafet, 222 Bloco A - 1º andar - Vila Olímpia - São Paulo - SP – CEP: 04551-065 Tel: (11) 3792-8600/8650 www.marfrig.com.br/ri e-mail: ri@marfrig.com.br 1
  • 2. In the first quarter of 2012, despite the adversities and uncertainties in the export market due to high chicken protein inventories in certain countries, the period marked another step forward in consolidating the Corporation’s new structure and in the execution of the strategy to optimize its capital structure: I. Structural Changes: a. Reorganization into two business segments: Seara Foods and Marfrig Beef b. Asset swap with Brasil Foods: important step for increasing capacity and volumes in higher-value processed products and strategic for optimizing the use of tax credits c. Capturing of synergies: integration of Seara Foods with expected synergies ranging from R$230.0 million to R$330.0 million over the next 2 to 5 years II. Optimization of capital structure: a. Sale of assets that are not part of the core business, especially of past acquisitions, increasing the focus on proteins and strengthening the cash position; and b. Consolidation of the Capital Structure: goal of obtaining an Investment Grade rating. The Corporation continued to pursue higher operating efficiency by capturing synergies across business segments and improving margins from the prior year, which attest to the strategy adopted and the commitment of our entire team to delivering consistent results and maximizing value for shareholders. The positive results achieved show that the strategy to build a complete portfolio of higher-value products, brands with strong customer loyalty and a global platform for developing, producing, marketing and distributing food products is increasingly more integrated and aligned with our goals. NET OPERATING REVENUE Net operating revenue was R$5.23 billion in 1Q12, in line with the R$5.25 billion recorded in 1Q11 and down 9.6% from R$5.79 billion in 4Q11, driven by the period’s seasonality (historically the first quarter is the weakest of the year) and by the impacts on the volumes and sale prices of chicken exports from Brazil caused by the excessively high inventories in certain countries and regions (particularly Japan and the Middle East). This quarter, the Seara Foods business segment accounted for 66.8% of the group’s total revenue, compared to 63.4% in 1Q11 and 67.3% in 4Q11, while the Marfrig Beef business segment accounted for 33.2% of total revenue, compared to 36.6% in 1Q11 and 32.7% in 4Q11. The increase in the share in total sales of processed and value-added products to 45.0% reflects the strategy adopted by the Group since 2007 and the organic growth in the operations of these segments. EXPORTS Marfrig’s consolidated exports totaled R$1.68 billion in 1Q12, down 11.1% from 1Q11 (R$1.89 billion), mainly due to the high levels of chicken inventories in the first few months of the year in major consumer markets in Asia and the Middle East. The lower volumes were partially offset by the positive exchange impact on exports from Brazil due to the appreciation in the U.S. dollar against the Brazilian real in 2012. Europe remained the main destination for the Group’s exports in 1Q12, accounting for 37.4% of total exports in the period (31.0% in 1Q11). After Europe, the main destinations were: Asia with an 18.8% share (17.8% in 1Q11) and Middle East with 16.9% of the Group’s exports (21.5% in 1Q11). A breakdown of the Marfrig Group’s consolidated export revenue by destination is presented below: Rua Chedid Jafet, 222 Bloco A - 1º andar - Vila Olímpia - São Paulo - SP – CEP: 04551-065 Tel: (11) 3792-8600/8650 www.marfrig.com.br/ri e-mail: ri@marfrig.com.br 2
  • 3. Exports Marfrig - 1Q12 Exports Marfrig - 1Q11 8,2% Europe 6,4% Europe 8,8% Asia 10,2% Asia 31,0% 37,4% 9,8% Middle East 13,1% Middle East Central / South America Central / South America 16,9% Russia 21,5% 17,8% Russia 18,8% Other Other COST OF GOODS SOLD Var. % Var. % COGS 1Q12 Part % 1Q11 Part % 4Q11 Part % 1Q12 / 1Q12 / 1Q11 4Q11 Raw Materials (3,068.4) 69.3% (3,040.8) 67.2% (3,228.3) 65.9% 0.8% -5.0% Packaging (152.5) 3.4% (164.0) 3.6% (215.2) 4.4% -7.0% -29.1% Electricity (30.0) 0.7% (35.2) 0.8% (36.3) 0.7% -14.7% -17.3% Direct Expenses + MOD (*) (1,017.5) 23.0% (1,085.5) 24.0% (1,214.5) 24.8% -6.3% -16.2% Indirect Expenses + MOID (*) (160.7) 3.6% (197.8) 4.4% (203.8) 4.2% -18.8% -21.2% Total (4,429.1) 100.0% (4,523.4) 100.0% (4,898.0) 100.0% -2.1% -9.6% Cost of goods sold (COGS) was R$4.43 billion in 1Q12, compared to R$4.52 billion in 1Q11 and to R$4.90 billion in 4Q11. The reduction from the same period of last year was due to the improvements in raw material purchasing activities and to the reduction in cattle prices from a year earlier. The main component of COGS remained raw materials, which includes the acquisition of animals and carcasses and inputs used to make feed. In 1Q12, raw materials accounted for 69.3% of total COGS, up slightly from 67.2% in 1Q11 and 65.9% in 4Q11. In 1Q12, Seara Foods accounted for 69.2% of total COGS, compared to 65.8% in 1Q11 and 71.7% in 4Q11. Marfrig Beef accounted for 30.8% of COGS in 1Q12. Animal feed inputs were the main components of COGS at Seara Foods, accounting for approximately 64.9%. At the Marfrig Beef business segment, cattle and carcasses purchases were the main component in COGS, accounting for some 81.3% of the total. We continue to focus on reducing costs by: (i) improving processes by consolidating our operations (Marfrig Beef and Seara Foods); (ii) optimizing our plants and diluting fixed costs, and (iii) capturing synergies. GROSS INCOME AND GROSS MARGIN Gross income was R$803.2 million in 1Q12, increasing by 10.2% from 1Q11 (R$728.8 million) and decreasing by 9.6% from R$888.5 million in 4Q11. Gross margin was 15.4%, compared to 13.9% in 1Q11 and 15.4% in 4Q11. The growth in gross income compared to 1Q11 and the evolution in margins are explained by the better sales mix, with a higher share of processed and value-added products, and by the synergies captured in raw-material purchasing (cattle and grains). This improvement is also attributable to the various improvements implemented last year on the operational, synergy and efficiency fronts, such as optimizing the beef and poultry production facilities in order to boost capacity utilization and dilute fixed costs at plants. Rua Chedid Jafet, 222 Bloco A - 1º andar - Vila Olímpia - São Paulo - SP – CEP: 04551-065 Tel: (11) 3792-8600/8650 www.marfrig.com.br/ri e-mail: ri@marfrig.com.br 3
  • 4. SELLING, GENERAL AND ADMINISTRATIVE EXPENSES The selling, general and administrative (SG&A) expenses were R$573.7 million in 1Q12, increasing by 4.9% from R$547.0 million in 1Q11 and by 2.1% from 4Q11 (R$561.9 million), driven by the higher marketing investments and the increase in labor costs in the period. SG&A expenses corresponded to 11.0% of net revenue, increasing by 50 bps from 1Q11 (10.4%) and by 130 bps from 4Q11 (9.7%), reflecting the increases in general and administrative expenses of 7.7% compared to 1Q11 and of 8.7% compared to 4Q11. We continue to focus on improving and reducing our expenses by maintaining our strategy to control costs and expenses, mainly by integrating and consolidating the structures (Marfrig Beef and Seara Foods), where we believe there are synergies to be captured from the exchange of best practices and the dilution of fixed and variable expenses. EBITDA AND EBITDA Margin EBITDA was R$410.7 million in 1Q12, up 21.8% from R$337.3 in 1Q11 and down 21.2% from R$521.2 in 4Q11, reflecting the seasonality of the periods. EBITDA margin was 7.8% in the quarter, compared to 6.4% in 1Q11 and 9.0% in 4Q11. Adjusted EBITDA, which excludes the nonrecurring effects of other operating revenue/expenses, was R$415.9 million (margin of 7.9%), increasing by 15.5% from R$360.1 million in 1Q11 (margin of 6.9%) and decreasing by 20.1% from R$520.2 million in 4Q11 (margin of 9.0%). The growth in EBITDA and EBITDA margin was driven by the operational improvement at both Seara Foods and Marfrig Beef, due to the measures implemented over past year, with the effects continuing into this year, and to the increased share of higher-value processed products in the sales mix. The reconciliation of Adjusted EBITDA with the financial statements is shown below: EBITDA Reconciliation (in R$ million) 1Q12 1Q11 4Q11 NET INCOME (Loss) 34.5 23.5 (138.6) (-) Provision for Income and Social Contribution taxes 54.4 45.2 70.4 (-) Net financial charges (344.2) (226.7) (437.7) (-) Net exchange variation 94.7 47.8 (101.8) (+) Depreciation/amortization 186.3 178.4 193.6 (+) Minority interest (5.2) 1.7 (2.9) EBITDA 410.7 337.3 521.2 (-) Other operating revenues/expenses (5.2) (22.8) 1.0 Adjusted EBITDA 415.9 360.1 520.2 Rua Chedid Jafet, 222 Bloco A - 1º andar - Vila Olímpia - São Paulo - SP – CEP: 04551-065 Tel: (11) 3792-8600/8650 www.marfrig.com.br/ri e-mail: ri@marfrig.com.br 4
  • 5. NET FINANCIAL RESULT Var % Var % Financial Result (R$ million) 1Q12 1Q11 4Q11 1Q12 x 1Q12 x 4Q11 1Q11 Financial Income 85,6 143,9 91,0 -40,5% -5,9% Net Financial Derivatives 30,8 37,9 37,2 -18,7% -17,0% Interest Income and income from financial investments 48,6 85,1 49,7 -43,0% -2,3% Discounts obtained & Others 6,3 20,8 4,1 -69,9% 52,6% Exchange and monetary effects - Gains 217,3 93,1 55,9 133,5% 288,8% Total Financial Income 303,0 236,9 146,9 27,9% 106,3% Finacial Expenses (429,8) (370,6) (528,7) 16,0% -18,7% Accrued Interest (237,3) (213,5) (246,8) 11,1% -3,9% Interest on debentures (100,1) (90,8) (99,4) 10,3% 0,8% Interest on leasing (3,4) (7,4) (5,3) -54,6% -36,6% Derivatives (38,3) (26,8) (115,3) 43,0% -66,8% Bank charges, Comissions, Fees & others (29,5) (27,2) (40,0) 8,4% -26,3% Other (21,2) (4,9) (22,0) 336,7% -3,3% Exchange and monetary effects - Losses (122,6) (45,2) (157,7) 171,1% -22,2% Total Financial Expenses (552,5) (415,8) (686,4) 32,9% -19,5% Result (249,5) (178,9) (539,5) 39,4% -53,8% The Corporation registered a net financial result of an expense of R$249.5 million in the quarter, compared to the net financial expenses of R$178.9 million in 1Q11 and R$539.5 million in 4Q11. NET INCOME The Corporation posted net income of R$34.5 million or earnings per share of R$0.1000 in 1Q12, compared to the net income of R$23.5 million or earnings per share of R$0.0678 in 1Q11 and the net loss of R$138.6 million or negative earnings per share of R$0.3994 in 4Q11 Rua Chedid Jafet, 222 Bloco A - 1º andar - Vila Olímpia - São Paulo - SP – CEP: 04551-065 Tel: (11) 3792-8600/8650 www.marfrig.com.br/ri e-mail: ri@marfrig.com.br 5
  • 6. OTHER FINANCIAL HIGHLIGHTS Cash Flow: The quarter registered cash burn of R$141.3 million, with higher use of working capital due to the seasonal reduction in trade accounts payable from the prior quarter and to the variation in the balance of recoverable taxes that were not offset by operating activities in the period. Simplified Cash Flow 4Q11 (in R$ million) Operational Activities Net income (loss) in period 34.5 Items not affecting cash 389.4 Working capital changes - operating accounts(1) (408.7) Other assets and liabilities accounts (156.5) Cash Flow - Operating activities ¹ (141.3) ¹ Consider inventories, accounts receivables, supliers and current and deferred taxes Marfrig’s strategy to manage its long-term capital structure is based on lengthening its debt profile and reducing its weighted average cost of operations. These goals were not achieved in the period, with short-term debt reaching R$3.02 billion, or 25.9% of total debt. This percentage compares to 30.6% at the end of 1Q11 and 20.8% at the end of 4Q11. At the end of 1Q12, the weighted average cost of our consolidated debt was 8.25% per annum, compared to 8.01% at the end of 4Q11. Debt Maturity Breakdown (R$ million) Debt and Cash and Equivalents by Currency Short Term 2.340 Long Term 8.635 Foreing Currency Local Currency 1.490 1.412 1.349 1.048 1.009 79,9% 803 868 882 3.022 3.320 302 63,1% 54,6% 152 1 0 36,9% 20,1% 45,4% 2Q12 3Q12 4Q12 1Q13 2013 2014 2015 2016 2017 2018 2019 2020 2021 Short Term Long Term Cash and Debt Debt Equivalents The composition of gross debt by currency was 24.4% in Brazilian real and 75.6% in other currencies, which was consistent with the 75.3% of the Group’s revenue generated in currencies other than the Brazilian real. At the end of 1Q12, cash and cash equivalents totaled R$3.32 billion, for short-term debt coverage of 1.1 times. The leverage ratio (based on net debt of R$8,336.4 million) stood at 4.51 times. Considering on a pro-forma basis the sale of Keystone’s logistics assets concluded in late April as if it had occurred in 1Q12, the leverage ratio is 3.52 times (see table below). Rua Chedid Jafet, 222 Bloco A - 1º andar - Vila Olímpia - São Paulo - SP – CEP: 04551-065 Tel: (11) 3792-8600/8650 www.marfrig.com.br/ri e-mail: ri@marfrig.com.br 6
  • 7. Management of Long-Term Capital Structure (Debt): Debt Breakdown 3/31/2012 31/12/2011 (In R$ million) Current Non-current Total Current Non-current Total Domestic currency 1,115.6 1,732.5 2,848.1 956.5 1.809.6 2,766.0 Foreign currencies 1,906.8 6,902.5 8,809.3 1,500.9 7.110.4 8,611.3 Consolidated Debt 3,022.4 8,635.0 11,657.4 2,457.3 8,920.0 11,377.3 Cash and cash equivalents 3,321.0 3,477.0 - 3,477.0 Net debt 8,336.4 7,900.3 LTM EBITDA 1,847.4 1,773.8 Net Debt/LTM EBITDA 4.51 4.45 The table below shows our leverage on a pro-forma basis recognizing the sale of Keystone’s logistics assets, as if it had occurred in 1Q12. In this case, the Marfrig Group has a leverage ratio (net debt/EBITDA) of 3.52 times. Pro-forma including the Sale of Keystone Foods’s Logistics Assets in 1Q12 Debt Breakdown 3/31/2012 (In R$ million) Current Non-current Total Domestic currency 1,115.6 1,732.5 2,848.1 Foreign currencies 1,906.8 6,902.5 8,809.3 Consolidated Debt 3,022.4 8,635.0 11,657.4 Net debt 7,630.1 EBITDA 1,847.2 EBITDA Gain Sale (estimated) 318.0 PRO-FORMA EBITDA 2,165.2 Net Debt/LTM EBITDA 3.52 Capital expenditure: Investments 1Q12 (In R$ million) Investments in Fixed Assets 189.5 Fixed 103.5 Breeding stock 86.0 Investment in Intangible Assets 2.0 Total CAPEX 191.5 Marfrig invested R$189.5 million in the quarter in fixed assets (construction, maintenance, modernization and/or expansion of its plants and breeding stocks). For 2012, we continue to focus on reducing and controlling investments, prioritizing growth in higher-value products and increasing Free Cash Flow. Rua Chedid Jafet, 222 Bloco A - 1º andar - Vila Olímpia - São Paulo - SP – CEP: 04551-065 Tel: (11) 3792-8600/8650 www.marfrig.com.br/ri e-mail: ri@marfrig.com.br 7
  • 8. PERFORMANCE BY BUSINESS SEGMENT - SEARA FOODS FINANCIAL AND STRATEGIC HIGHLIGHTS:  Consolidated Net Revenue in the Seara Foods business segment of R$3.50 billion in 1Q12, increasing 5.0% from R$3.33 billion in 1Q11, driven by the good performance of the Seara operations in the domestic market and by the progress achieved in the international operations. Compared to 4Q11, the business segment’s net revenue decreased by 10.3%, reflecting both the lower volumes and prices of Brazil’s poultry and pork exports and the seasonality of the first quarter;  Share of processed and elaborated products in the business segment’s sales revenue of 55.9%, compared to 50.3% in 1Q11 and 51.1% in 4Q11;  EBITDA in the segment of R$208.6 million in 1Q12, up 15.9% from R$180.0 million in 1Q11, though 33.9% lower than the R$315.6 million recorded in 4Q11, driven by the period’s seasonality and the lower export volumes;  EBITDA margin of 6.0% in 1Q12, up 60 bps from 5.4% in 1Q11 and down 210 bps from 8.1% in 4Q11;  On April 30, we concluded the sale of the specialized logistics services business of Keystone Foods in the United States, Europe, Middle East, Australia and Asia to The Martin-Brower Company for US$400 million, with the proceeds of US$390.1 million received on that date. The sale of these logistics assets will enable the Marfrig Group to focus on its core business, which is the development, production and distribution of higher-value processed food products. Var. % Var. % INCOME STATEMENT - SEARA FOODS 1Q12 1Q11 4Q11 1Q12 / 1Q12 / R$ million 1Q11 4Q11 NET OPERATING REVENUE 3,495.2 3,328.4 3,896.8 5.0% -10.3% Cost of goods sold (3,063.9) (2,948.5) (3,368.9) 3.9% -9.1% GROSS PROFIT 431.3 379.9 527.9 13.5% -18.3% Gross margin 12.3% 11.4% 13.5% 90 bps -120 bps SG&A (367.3) (358.8) (366.4) 2.4% 0.2% % of Gross Revenue -10.5% -10.8% -9.4% 30 bps -110 bps OPERATING REVENUE (EXPENSES) (374.4) (381.9) (371.0) -2.0% 0.9% Selling (238.5) (233.5) (242.0) 2.2% -1.4% General and administrative (128.7) (125.3) (124.4) 2.7% 3.5% Other operating revenue/expenses (7.2) (23.1) (4.6) -68.9% 56.3% EBITDA 208.6 180.0 315.6 15.9% -33.9% EBITDA Margin 6.0% 5.4% 8.1% 60 bps -210 bps ADJUSTED EBITDA (*) 215.8 203.1 320.2 6.2% -32.6% ADJUSTED EBITDA MARGIN(*) 6.2% 6.1% 8.2% 10 bps -200 bps (*)Excludes Other operating revenues/expenses SLAUGHTER SLAUGHTER SLAUGHTER Var. Var. PRODUCTION 1Q12 1Q11 4Q11 1Q12 / 1Q11 1Q12 / 4Q11 POULTRY Brazil 155,226,000 166,956,887 155,605,000 -7.0% -0.2% Europe 52,317,741 50,233,453 50,939,996 4.1% 2.7% USA 45,416,082 45,141,013 42,558,988 0.6% 6.7% APMEA 4,101,551 7,662,501 -46.5% TOTAL POULTRY 257,061,374 262,331,353 256,766,485 -2.0% 0.1% TOTAL PORK 707,494 678,589 670,282 4.3% 5.6% TURKEY 1,400,148 1,250,602 2,136,549 12.0% -34.5% Rua Chedid Jafet, 222 Bloco A - 1º andar - Vila Olímpia - São Paulo - SP – CEP: 04551-065 Tel: (11) 3792-8600/8650 www.marfrig.com.br/ri e-mail: ri@marfrig.com.br 8
  • 9. FOCUS OF SEARA: 1- Accelerating the transition of the product mix towards higher-value products in Brazil, taking advantage of the gap left by the second brand, with the expectation of market share gains, establishing Seara as the second option in the consumption of value-added products; 2- Focusing on product brand and architecture, innovation efforts and price repositioning; 3- Optimizing the use of both existing and new assets, creating room for growth; 4- Substantially expanding distribution; 5- Investments in plants, capacity, brand and people; 6- Strong leadership team – performance, complexity, strategy – supported by a winning culture. Net Revenue: Seara Foods – Brazil Operation: Net revenue in the Brazil Operation of Seara Foods was R$1.34 billion in 1Q12, in line with 1Q11 and down 19.0% from R$1.66 billion in 4Q11. The performance in the period reflects the more adverse scenario for poultry and pork exports, especially in January and February, and the seasonal impacts weighing on sales typical at the start of each year. On the other hand, the 27.7% growth in domestic sales of processed and elaborated products compared to 1Q11 partially offset the lower exports. Processed and elaborated products accounted for 73.0% of Seara's sales in Brazil (71.2% in 1Q11), in line with the Corporation’s strategy to gradually increase the sale of higher-value products. This strategy has led to important market-share gains for Seara, especially in the categories frozen meats (ready-to-eat dishes, hamburgers, pastries, ready-to-eat snacks, meatballs, steaks, stuffed products, etc.). Rua Chedid Jafet, 222 Bloco A - 1º andar - Vila Olímpia - São Paulo - SP – CEP: 04551-065 Tel: (11) 3792-8600/8650 www.marfrig.com.br/ri e-mail: ri@marfrig.com.br 9
  • 10. Market Share Market Share Frozen Meat Industrialized Meat 17,3 SEARA SEARA 17,3 NOVAS MARCAS - TCD NOVAS MARCAS - TCD 8,3 9,6 9,0 7,0 7,2 7,8 7,7 5,0 Fev-Mar/10 Fev-Mar/11 Fev-Mar/12 Jan-Feb/10 Jan-Feb/11 Jan-Fev/12 Source: NIELSEN Seara Foods – International Operation: Net revenue in the International Operations of Seara Foods, represented by Moy Park, O’Kane Poultry and Keystone Foods, came to R$1.82 billion in 1Q12, up 14.2% from R$1.60 billion in 1Q11 and in line with 4Q11. The performance was driven by the higher domestic sales of processed and elaborated products, which grew by 23.3% from 1Q11 and remained stable in relation to 4Q11. The result was driven by organic growth at Moy Park and O’Kane Poultry, which benefitted from the change in the behavior of European consumers, who are now eating more meals at home. Another factor contributing to this result was Keystone's solid performance in serving fast-food chains in the USA, Europe and APMEA, as well as the more favorable currency translation for our revenues in foreign currencies, reflecting the depreciation of the Brazilian real in relation to the U.S. dollar compared to 1Q11. Seara Foods – Exports: Europe remained the main export destination of Seara Foods, with its share in the business segment’s total exports increasing to 38.1%, compared to 30.9% in 1Q11. Asia was the second most important destination, accounting for 23.8% (22.7% in 1Q11), while the Middle East, the segment’s third most important export destination, reduced its share to 20.9% in 1Q12, due to high levels of chicken inventories in certain countries in the region. In March, demand in the region already showed signs of recovery, indicating that the situation should gradually return to normal over the next few months. A breakdown of consolidated export revenue by destination in the Seara Foods business segment is presented below: Seara Foods - 1Q12 Seara Foods - 1Q11 3,5% 3,9% 6,2% Europe 3,9% Europe 7,1% Asia 14,8% 30,9% Asia 38,1% Middle East Middle East 20,9% Central / South America Central / South America 24,2% 23,8% Russia 22,7% Russia Other Other Rua Chedid Jafet, 222 Bloco A - 1º andar - Vila Olímpia - São Paulo - SP – CEP: 04551-065 Tel: (11) 3792-8600/8650 www.marfrig.com.br/ri e-mail: ri@marfrig.com.br 10
  • 11. Gross Margin: Seara Foods recorded gross margin of 12.3% in 1Q12, compared to 11.4% in 1Q11 and 13.5% in 4Q11. Compared to 1Q11, the margin expansion was driven by stability in the prices of the main commodities and the gradual increases in the share of processed and elaborated products in the brand’s sales mix and in the prices of these products. The compression compared to 4Q11 reflects the lower exports and the positive effect from the sales of commemorative/holiday products in 4Q11. On an annual basis, the average corn price in Brazil (ESALQ) decreased 2.2%, while the soybean price decreased 0.8%. In the international market, corn prices in U.S. dollar (CBOT) decreased 4.5%, while the soybean price decreased 8.1%. Compared to 4Q11, the main commodities registered slight price increases. In Brazil, the corn price increased 2.8% and the soybean price 5.5%, while in the international market prices increased by 3.4% for corn and 8.1% for soybean. EBITDA and EBITDA Margin: EBITDA in the segment was R$208.6 million or 6.0% of revenue in 1Q12, compared to R$180.0 million or 5.4% of revenue in 1Q11 and R$315.6 million or 8.1% of revenue in 4Q11. As explained above, the strengthening of Seara in Brazil’s domestic market and the international operations contributed positively to the segment’s margin expansion compared to 1Q11. Compared to 4Q11, the decrease is explained by seasonality and the unfavorable scenario for exports faced early this year. Rua Chedid Jafet, 222 Bloco A - 1º andar - Vila Olímpia - São Paulo - SP – CEP: 04551-065 Tel: (11) 3792-8600/8650 www.marfrig.com.br/ri e-mail: ri@marfrig.com.br 11
  • 12. PERFORMANCE BY BUSINESS SEGMENT – MARFRIG BEEF FINANCIAL AND STRATEGIC HIGHLIGHTS:  Consolidated Net Revenue in the Marfrig Beef business segment of R$1.74 billion in 1Q12, decreasing by 9.7% from R$1.92 billion in 1Q11 and by 8.1% from R$1.89 billion in 4Q11, driven by the adjustments in production to the lower demand in the domestic and export markets due to the period’s seasonality;  EBITDA in the segment of R$202.1 million in 1Q12, increasing 28.5% from R$157.3 million in 1Q11 and decreasing 1.7% from R$205.6 million in 4Q11;  EBITDA Margin of 11.6%, expanding 350 bps and 80 bps from 1Q11 (8.2%) and 4Q11 (10.9%), respectively, driven by the operational adjustments implemented over the course of the year and the better prices, mainly due to the depreciation in the Brazilian real in relation to the U.S. dollar. Var. % Var. % INCOME STATEMENT - MARFRIG BEEF 1Q12 1Q11 4Q11 1Q12 / 1Q11 1Q12 / 4Q11 R$ Million NET OPERATING REVENUE 1,737.3 1,923.8 1,889.8 -9.7% -8.1% Cost of goods sold (1,365.4) (1,574.9) (1,529.2) -13.3% -10.7% GROSS PROFIT 371.9 348.9 360.6 6.6% 3.1% Gross margin 21.4% 18.1% 19.1% 330 bps 230 bps SG&A (206.4) (188.2) (195.5) 9.7% 5.6% % Gross Revenue -11.9% -9.8% -10.3% -210 bps -150 bps OPERATING REVENUE (EXPENSES) (204.5) (187.9) (189.9) 8.8% 7.6% Selling (124.2) (117.6) (125.8) 5.5% -1.3% General and administrative (82.3) (70.6) (69.7) 16.6% 18.1% Other operating revenue/expenses 2.0 0.3 5.6 598.7% -64.1% EBITDA 202.1 157.3 205.6 28.5% -1.7% EBITDA Margin 11.6% 8.2% 10.9% 350 bps 80 bps ADJUSTED EBITDA (*) 200.1 157.0 200.0 27.5% 0.1% ADJUSTED EBITDA MARGIN(*) 11.5% 8.2% 10.6% 340 bps 90 bps (*)Excludes Other operating revenues/expenses Production: SLAUGHTER SLAUGHTER SLAUGHTER Var. Var. PRODUCTION 1Q12 1Q11 4Q11 1Q12 / 1Q11 1Q12 / 4Q11 BEEF Brazil 522,101 769,444 551,999 -32.1% -5.4% Argentina 137,265 139,952 132,201 -1.9% -3.8% Uruguay 99,506 108,317 125,739 -8.1% -20.9% TOTAL BEEF 758,872 1,017,713 809,939 -25.4% -6.3% LAMB Uruguay 3,347 12,502 34,861 -73.2% -90.4% Chile 95,343 110,914 -14.0% Brazil 26,961 54,624 21,138 -50.6% 27.5% TOTAL LAMB 125,651 178,040 55,999 -29.4% 124.4% ¹ Includes only the number of cattle slaughtered, excluding meat purchases from third parties. Rua Chedid Jafet, 222 Bloco A - 1º andar - Vila Olímpia - São Paulo - SP – CEP: 04551-065 Tel: (11) 3792-8600/8650 www.marfrig.com.br/ri e-mail: ri@marfrig.com.br 12
  • 13. FOCUS OF MARFRIG BEEF 1- Efficiency gains through higher capacity utilization and optimization of production facilities. 2- Unifying production across the three operations to capture operational improvements; 3- Expanding and unifying the sales team; 4- Market intelligence to identify the most profitable markets and clients; 5- IT platforms integrated across the three operations; 6- Adoption of best operational practices and industrial models used in the market; 7- Unified model for brand positioning 8- Focusing on product brand and architecture, innovation efforts and price repositioning; 9- Optimizing the use of both existing and new assets, creating room for growth; 10- Substantially expanding distribution for domestic and export sales. With the aim of improving the profitability of its operations to face the challenging scenario caused primarily by the period’s seasonality, we reduced slaughter volume and increased purchases of bone-in meats (carcasses). Our capacity utilization stood at 65%, compared to 68% in the prior quarter. Marfrig Beef plans to resume operations at 3 plants in 2Q12, given the stronger demand and better moment in Brazil’s beef cattle cycle. Net Revenue: Brazil Operation: Net operating revenue in the Marfrig Beef operations in Brazil was R$866.7 million in 1Q12, decreasing 20.5% from 1Q11 and 14.0% from 4Q11. In the domestic market, the reduction in sales was driven by weaker demand and the period’s seasonality, which were partially offset by the growth in exports of elaborated and processed products, which was accompanied by higher prices, due to the depreciation of the Brazilian real against the U.S. dollar. International Operations: Revenue from the international operations of the Marfrig Beef business segment was R$556.5 million in 1Q12, up 3.9% from 1Q11 and in line with 4Q11. In the domestic market, the decrease in fresh beef sales volume was partially offset by the higher sales of elaborated and processed products. Exports: Europe remained the main export destination for Marfrig Beef, with its share of the business segment’s total exports increasing to 36.3%, compared to 31.2% in 1Q11. Russia remained the second most important destination, with its share of exports decreasing to 16.9% (22.2% in 1Q11), reflecting the restrictions on Brazilian exports imposed during 2011. Central and South America was the business segment’s third most important export destination, with a share of 14.2%, driven by higher sales to the Chilean market and by exports of prime cuts from Argentina and Uruguay to serve the food-service market in Brazil. Rua Chedid Jafet, 222 Bloco A - 1º andar - Vila Olímpia - São Paulo - SP – CEP: 04551-065 Tel: (11) 3792-8600/8650 www.marfrig.com.br/ri e-mail: ri@marfrig.com.br 13
  • 14. Exports Marfrig Beef - 1Q12 Exports Marfrig Beef - 1Q11 11,4% Europe 11,6% Europe Asia 31,2% Asia 16,9% 36,3% Middle East 22,2% Middle East Central / South America Central / South America 14,2% 10,0% 8,4% 10,7% 10,5% Russia 16,6% Russia Other Other Gross Margin: The combination of the reduction in cattle prices in the quarter, the efforts to pursue more profitable sales channels and markets and the operational improvements implemented in the business segment since the integration of all operations, contributed to gross margin expansion of 330 bps compared to 1Q11 and of 230 bps compared to 4Q11. The average cattle price in Brazil during the quarter decreased by 10.8% (average in 16 different markets), while prices increased by 1.8% in Argentina and by 3.7% in Uruguay (both in U.S. dollar terms). EBITDA and EBITDA Margin: EBITDA in the Beef segment was R$202.1 million or 11.6% of revenue in 1Q12, increasing by 28.5% from R$157.3 million in 1Q11 (margin of 8.2%) and decreasing by 1.7% from R$205.6 million in 4Q11 (margin of 10.9%). The increases reflect the effects from the various initiatives implemented over the year to capture operational improvements and synergies, such as optimizing production infrastructure to increase capacity utilization and dilute fixed costs at plants, improvements in raw-material purchasing and concentrating exports in more profitable markets and channels. Rua Chedid Jafet, 222 Bloco A - 1º andar - Vila Olímpia - São Paulo - SP – CEP: 04551-065 Tel: (11) 3792-8600/8650 www.marfrig.com.br/ri e-mail: ri@marfrig.com.br 14
  • 15. About Marfrig Marfrig Alimentos S.A. is a Brazilian multinational public corporation operating in the food and food services industry in Brazil and abroad. It is engaged in the production, processing, marketing and distribution of food made from animal proteins (beef, pork, lamb, poultry and processed products) and the distribution of other food products (frozen foods, cold cuts and sausages, fish, ready-to-eat meals and pasta) and semi-finished and finished leather. Headquartered in the city of São Paulo, Marfrig Group operates nationwide in Brazil as well as in 21 other countries (Argentina, Uruguay, Chile, USA, France, Northern Ireland, United Kingdom, Holland, South Africa, Mexico, Germany, United Arab Emirates, Kuwait, Qatar, Bahrain, China, Thailand, Malaysia, South Korea, Australia and New Zealand) through 150 production units, distribution centers and sales offices, with production capacity of more than 120,000 tonnes of processed food per month. It is present on five continents, employs over 85,000 direct employees and exports products to more than 140 countries, including Europe, the Middle East, Asia and the Americas. In 2007, the Group went public and listed its shares on the Novo Mercado corporate governance segment of the BM&FBovespa. As part of its initiative to diversify its operations across different geographic regions and animal proteins, Marfrig launched a series of acquisitions of assets, companies and brands, which over the past four years have totaled 40 operations. As a result, the Group has consolidated itself as one of the leading companies in the food global industry, ranking as the third largest player in the global protein industry, the world’s fourth largest beef producer and Brazil’s second largest producer and exporter of poultry and processed products. With approximately 85,000 employees, the Marfrig Group is the largest poultry producer in the United Kingdom, the largest private company in Uruguay and Northern Ireland, the largest lamb producer in South America, the largest meat company in Argentina and the fourth largest food company in the world, as well as the world’s third largest producer of beef products and Brazil’s second largest producer and exporter of poultry and processed products. In 2010, it was recognized as the “Best Agribusiness Company” and “Best Meat Company” by Exame magazine’s “Best and Biggest Guide” published by Grupo Abril, the “Best Company in Financial Sustainability” by Isto É Dinheiro magazine and the "Best Meat Company" by Globo Rural magazine published by Organizações Globo. In 2011, it was once again elected the “Best Meat Company” by Exame magazine’s “Best and Biggest Guide” and the "Best Meat Company" by Globo Rural magazine and also received the 2011 Transparency Trophy from Anefac, Fipecafi and Serasa Experian, which marked the first time this trophy was awarded to a food company. With stock traded on the Novo Mercado special corporate governance segment of the BM&FBovespa S.A. - Securities, Commodities and Futures Exchange under the ticker MRFG3, Marfrig is a component of the main performance indicators for Brazil's capital markets, such as the Bovespa Index, the IBrX-50 and the Carbon Efficient Index (ICO2), the latter formed by companies that have adopted transparent practices for their greenhouse gas emissions. To ensure the long-term sustainability of its business, the Marfrig Group develops and implements innovative actions and a comprehensive policy of social and environmental responsibility throughout its supply chain. It has a unified Code of Ethics that permeates the Corporation and is applied in all countries where it operates. This enables the formation of a unique and global culture, guided by the same social and environmental values. The most visible face of the Corporation's engagement in sustainability practices lies in the working groups that it leads and the public commitments that it has assumed in partnership with the world's largest organizations in defense of sustainable production and the conservation of biodiversity. About this document This document may contain forward-looking statements in accordance with the definition in Section 27A of the U.S. Securities Act of 1933 and Section 21E of the U.S. Securities Exchange Act of 1934. These forward-looking statements are merely projections and do not constitute guarantees of future performance. Investors are cautioned that any forward-looking statements are subject to various risks, uncertainties and factors relating to the operations and business environments of Marfrig and its subsidiaries that could cause the actual results of these companies to be materially different from any future results expressed or implied by said forward-looking statements. Rua Chedid Jafet, 222 Bloco A - 1º andar - Vila Olímpia - São Paulo - SP – CEP: 04551-065 Tel: (11) 3792-8600/8650 www.marfrig.com.br/ri e-mail: ri@marfrig.com.br 15
  • 16. This material is published solely for informational purposes and should not be construed as a solicitation or an offer to buy or sell any securities or related financial instruments and should not be treated as investment advice. This material does not target any specific investment objectives, financial situation or particular needs of any recipient. No representation or warranty, either expressed or implied, is made regarding the accuracy, completeness or reliability of the information contained herein. This material should not be regarded by recipients as a substitute for the exercise of their own judgment. Conference Calls: March 15th, 2012 Portuguese 9:30 a.m. (Brasília) / 8:30 a.m. (US EST) / 12:30 p.m. (GMT) Dial-in: +55 (11) 4688-6361 Code: Marfrig English 11:00 a.m. (Brasília) / 10:00 a.m. (US EST) / 2:00 p.m. (GMT) Dial-in (Brazil): +55 (11) 4688-6361 Dial-in (other countries): +1 (786) 924-6977 Code: Marfrig Live audio webcast with slide presentation. Replay available for download on our website: www.marfrig.com.br/ir Rua Chedid Jafet, 222 Bloco A - 1º andar - Vila Olímpia - São Paulo - SP – CEP: 04551-065 Tel: (11) 3792-8600/8650 www.marfrig.com.br/ri e-mail: ri@marfrig.com.br 16
  • 17. Var. % Var. % Income Statement 1Q12 1Q11 4Q11 1Q12 / 1Q12 / (in million R$) 1Q11 4Q11 NET OPERATING REVENUE 5,232.5 5,252.1 5,786.6 -0.4% -9.6% Cost of goods sold (4,429.3) (4,523.4) (4,898.0) -2.1% -9.6% % net revenue -84.6% -86.1% -84.6% 150 bps 0 bps GROSS PROFIT 803.2 728.8 888.5 10.2% -9.6% % Gross margin 15.4% 13.9% 15.4% 150 bps 0 bps SG&A (573.7) (547.0) (561.9) 4.9% 2.1% % of Net revenue -11.0% -10.4% -9.7% -50 bps -130 bps OPERATING REVENUE (EXPENSES) (578.9) (569.9) (560.9) 1.6% 3.2% Selling (362.7) (351.1) (367.9) 3.3% -1.4% General and administrative (211.0) (195.9) (194.0) 7.7% 8.7% Other operating revenue (expenses) (5.2) (22.8) 1.0 -77.3% -630.0% OPERATING INCOME (LOSS) before financial result 224.4 158.9 327.6 41.2% -31.5% % Operation Margin 4.3% 3.0% 5.7% 130 bps -140 bps FINANCIAL INCOME (EXPENSES) (249.5) (178.9) (539.5) 39.4% -53.8% Financial income 85.6 143.9 91.0 -40.5% -5.9% Exchange and monetary effects - Gains 217.3 93.1 55.9 133.5% 288.8% Financial expenses (429.8) (370.6) (528.7) 16.0% -18.7% Exchange and monetary effects - Losses (122.6) (45.2) (157.7) 171.1% -22.2% OPERATING RESULT (25.2) (20.0) (211.9) 25.4% -88.2% Provision for Income and Social Contribution taxes 54.4 45.2 70.4 20.3% -22.8% Income Tax 42.6 34.2 54.5 24.5% -21.9% Social Contribution 11.8 11.0 15.9 7.1% -25.6% NET INCOME (LOSS) before minotity Interest 29.3 25.2 (141.5) 36.8% -124.4% Minority Interest 5.2 (1.7) 2.9 203.6% -279.6% NET INCOME (LOSS) 34.5 23.5 (138.6) 46.7% -124.9% # Shares (million) 347.0 347.0 347.0 N/A N/A EARNINGS PER SHARE - R$ 0.1000 0.0678 (0.3994) 46.7% -124.9% EBITDA 410.7 337.3 521.2 21.8% -21.2% EBITDA Margin 7.8% 6.4% 9.0% 140 bps -120 bps ADJUSTED EBITDA (*) 415.9 360.1 520.2 15.5% -20.1% ADJUSTED EBITDA Margin 7.9% 6.9% 9.0% 110 bps -100 bps (*)Excludes Other operating revenues/expenses Rua Chedid Jafet, 222 Bloco A - 1º andar - Vila Olímpia - São Paulo - SP – CEP: 04551-065 Tel: (11) 3792-8600/8650 www.marfrig.com.br/ri e-mail: ri@marfrig.com.br 17
  • 18. Var. % Var. % CONSOLIDATED BALANCE SHEET (In R$ million) 1Q12 1Q11 4Q11 1Q12 / 1Q11 1Q12 / 4Q11 CURRENT ASSETS 9,310.1 9,210.9 9,359.1 -2.1% -3.7% Cash and cash equivalents 3,321.1 3,163.2 3,477.0 -4.5% -13.1% Accounts receivable from domestic clients 1,075.8 1,067.9 1,032.5 0.7% 4.2% Accounts receivable from foreign clients 249.4 322.3 270.4 -22.6% -7.8% Inventories 2,530.4 2,452.3 2,526.8 3.2% 0.1% Biological assets 698.0 733.4 711.2 -4.8% -1.9% Recoverable taxes 1,107.2 1,024.5 1,025.5 8.1% 8.0% Deferred expenses 102.1 78.2 85.7 30.5% 19.1% Notes receivable 19.4 92.2 28.4 -79.0% -31.6% Advances to suppliers 36.6 89.7 33.2 -54.6% 22.8% Other accounts receivable 170.1 187.1 168.5 -9.1% 0.9% NON CURRENT ASSETS 14,401.9 13,192.6 14,464.3 9.2% -0.4% Financial investments 0.9 7.5 0.9 -88.1% 0.0% Demand deposits 26.3 19.6 24.9 34.3% 5.8% Notes receivable 31.5 39.7 37.9 -20.5% -16.9% Deferred taxes 1,489.0 968.9 1,443.5 53.7% 3.2% Recoverable taxes 1,222.1 984.9 1,188.6 24.1% 2.8% Other accounts receivable 81.0 117.2 85.3 -30.9% -5.0% Investments 13.5 10.2 13.2 33.1% 2.5% Fixed assets 7,026.3 6,800.6 7,095.3 3.3% -1.0% Biological assets 214.0 201.7 219.8 6.1% -2.6% Intangible assets 4,297.2 4,042.3 4,355.0 6.3% -1.3% TOTAL ASSETS 23,712.1 22,403.5 23,823.4 5.9% -0.5% CURRENT LIABILITIES 6,919.7 6,672.1 6,673.1 3.8% 3.8% Trade accounts payable 2,525.1 2,366.3 2,783.1 6.7% -9.3% Payroll and related charges 476.9 535.2 483.7 -10.9% -1.4% Taxes, fees and contributions 161.8 171.4 171.2 -5.6% -5.5% Loans and financing 2,625.3 2,759.6 2,277.0 -12.1% 6.5% Leasing payable 54.6 76.2 59.9 -28.4% -8.9% Notes payable 398.6 126.2 434.2 215.8% -8.2% Prepaid accounts from clients 116.6 185.6 106.9 -37.2% 9.1% Interest on debentures 197.7 222.8 180.3 78.2% 120.2% Other payables 167.7 194.0 161.8 -13.5% 3.6% NON CURRENT LIABILITIES 10,811.3 9,289.6 11,251.8 16.4% -3.9% Loans and financing 8,239.8 5,956.6 8,326.0 36.7% -2.2% Leasing payable 235.5 224.8 242.8 4.7% -3.0% Debentures payable 395.2 592.6 594.0 -33.3% -33.5% Taxes, fees and contributions 248.2 276.2 244.0 -10.2% 1.7% Deferred taxes 1,376.6 1,402.4 1,415.7 -1.8% -2.8% Provision for contingencies 210.7 209.7 188.7 0.4% 11.6% Notes payable 5.7 365.9 30.5 -98.4% -81.4% Other 199.6 261.2 210.0 -23.5% -4.9% SHAREHOLDERS’ EQUITY 5,881.1 6,292.9 5,733.7 -9.0% -0.1% Share Capital 4,061.5 4,061.5 4,061.5 0.0% 0.0% (-) Expenses with capital increase (75.0) (75.0) (75.0) 0.0% 0.0% Capital Reserve 2,460.1 2,487.7 2,460.1 -1.1% 0.0% Profit reserve 31.6 45.8 38.1 -31.2% -17.2% Asset valuation adjustments (65.0) 30.4 (51.4) -314.0% 26.6% Cumulative translation adjustments 494.8 285.9 560.2 73.1% -11.7% Accumulated Losses (1,217.2) (547.7) (513.8) 122.3% 136.9% Net Income for the period 34.5 23.5 (746.0) 46.7% -104.6% Minority Interest 155.8 148.9 164.8 4.6% -5.5% TOTAL LIABILITIES 23,712.1 22,403.5 23,823.4 4.5% -1.7% Rua Chedid Jafet, 222 Bloco A - 1º andar - Vila Olímpia - São Paulo - SP – CEP: 04551-065 Tel: (11) 3792-8600/8650 www.marfrig.com.br/ri e-mail: ri@marfrig.com.br 18
  • 19. CASH FLOW – R$ million 1Q12 1Q11 4Q11 Operating Activities NET INCOME FOR THE PERIOD 34,5 23,5 (138,6) ITEMS NOT AFFECTING CASH 389,1 417,6 563,7 Depreciation 121,7 116,8 125,1 Amortization 64,6 61,6 68,5 Minority interest (5,2) 1,7 (2,9) Provision for contingencies and non appropriated tax credit 2,1 (1,7) 12,1 Deferred taxes (55,8) (41,5) (77,8) Exchange variation over financing (153,4) (77,0) 124,6 Exchange variation over other assets and liabilities accounts 58,7 45,4 (22,8) Interest expenses over financial debt 214,0 176,2 219,2 Interest expenses over financial leasing 5,8 10,1 5,2 Interest expenses over Debentures 100,1 90,8 99,4 Adjustment to present value 2,6 (5,8) 0,3 Contingency payment reversion - - (18,0) Fixed assets write-off 33,7 41,0 31,1 EQUITY CHANGES (564,9) (800,8) 278,8 Accounts receivable from clients (34,8) 6,7 20,8 Inventories (20,9) (284,1) 181,8 Judicial deposits (1,5) 4,8 (1,5) Accrued payroll and related charges (1,0) 1,2 (18,4) Suppliers (231,3) 56,4 171,8 Current and deferred taxes (121,8) (233,8) (25,8) Notes receivable and payable (57,8) (206,8) 7,7 Other assets and liabilities accounts (96,0) (145,3) (57,5) CASH FLOW FROM OPERATING ACTIVITIES (141,3) (359,7) 703,9 Investing activities Investments (0,7) (0,0) 125,1 Investment in fixed assets (189,5) (278,4) (228,4) Investment in intangible assets (1,3) (5,6) (0,2) CASH FLOW FROM INVESTING ACTIVITIES (191,5) (284,0) (103,5) Financing activities Dividends / Interest on own capital paid in the period (14,9) (61,9) 0,0 Interest on Debentures (62,8) - - Debentures 0,7 592,6 - Loans and financing 321,4 (558,4) (689,3) Leasing payable (17,6) (18,1) (28,9) Treasury shares (6,6) 1,4 (9,8) CASH FLOW FROM FINANCING ACTIVITIES 220,3 (44,4) (728,0) Exchange variation over cash and equivalent (USD) 4,1 - (0,8) Exchange variation over cash and equivalent (47,4) (25,1) 17,2 CASH FLOW FOR THE PERIOD (155,8) (713,2) (111,2) Cash, banking accounts, short term investments Balance at the end of the period 3.321,1 3.163,2 3.477,0 Balance at the beginning of the period 3.477,0 3.876,4 3.713,1 CHANGES IN THE PERIOD (155,8) (713,2) (236,2) Rua Chedid Jafet, 222 Bloco A - 1º andar - Vila Olímpia - São Paulo - SP – CEP: 04551-065 Tel: (11) 3792-8600/8650 www.marfrig.com.br/ri e-mail: ri@marfrig.com.br 19
  • 20. NET REVENUES BY SEGMENT / MARKET Var % Var % 1Q12 1Q11 4Q11 (R$ Million) 1Q12 x 1Q11 1Q12 x 4Q11 BEEF - BRAZIL 866.7 1,090.0 1,007.5 -20.5% -14.0% Domestic Market 600.9 760.5 714.4 -21.0% -15.9% Fresh Beef 396.5 675.1 459.4 -41.3% -13.7% Processed and Elaborated Products 204.4 85.4 255.0 139.4% -19.8% Exports 265.8 329.5 293.1 -19.3% -9.3% Fresh Beef 224.1 297.9 265.6 -24.8% -15.6% Processed and Elaborated Products 41.7 31.7 27.5 31.6% 51.8% BEEF - INTERNATIONAL 556.5 480.9 527.8 15.7% 5.4% Domestic Market 300.5 276.3 314.6 8.8% -4.5% Fresh Beef 176.8 177.0 196.1 -0.1% -9.8% Processed and Elaborated Products 123.6 99.3 118.6 24.5% 4.3% Exports 256.0 204.6 213.2 25.1% 20.1% Fresh Beef 227.7 194.7 206.4 17.0% 10.4% Processed and Elaborated Products 28.2 9.9 6.8 184.9% 312.7% Others 314.2 352.9 354.4 -11.0% -11.4% TOTAL - BEEF 1,737.3 1,923.8 1,889.8 -9.7% -8.1% Fresh Beef 1,025.2 1,344.6 1,127.5 -23.8% -9.1% Processed and Elaborated Products 398.0 226.3 407.9 75.9% -2.4% Others 314.2 352.9 354.4 -11.0% -11.4% POULTRY & PORK - BRAZIL 1,341.9 1,364.3 1,655.9 -1.6% -19.0% Domestic Market 526.2 422.3 576.0 24.6% -8.7% Fresh Poutry 98.6 91.8 123.1 7.5% -19.9% Fresh Pork 43.5 29.7 32.4 46.4% 34.4% Processed and Elaborated Products 384.1 300.8 420.6 27.7% -8.7% Exports 815.8 942.1 1,079.8 -13.4% -24.5% Fresh Poutry 682.9 787.8 923.0 -13.3% -26.0% Fresh Pork 77.3 93.6 97.5 -17.4% -20.8% Processed and Elaborated Products 55.6 60.7 59.3 -8.3% -6.2% POULTRY & PORK - INTERNATIONAL 1,825.0 1,652.5 1,877.9 10.4% -2.8% Domestic Market 1,626.0 1,371.1 1,634.4 18.6% -0.5% Fresh Meat 280.7 280.1 320.5 0.2% -12.4% Industrialized Products 1,345.3 1,091.0 1,313.9 23.3% 2.4% Exports 198.9 281.4 243.5 -29.3% -18.3% Fresh Meat 28.8 47.0 36.6 -38.7% -21.2% Industrialized Products 170.1 234.4 206.9 -27.4% -17.8% Others 328.3 311.6 363.1 5.4% -9.6% TOTAL - POULTRY & PORK 3,495.2 3,328.4 3,896.8 5.0% -10.3% Fresh Meat 1,211.7 1,329.9 1,533.0 -8.9% -21.0% Processed and Elaborated Products 1,955.2 1,686.9 2,000.7 15.9% -2.3% Others 328.3 311.6 363.1 5.4% -9.6% TOTAL - MARFRIG PROTEINS 5,232.5 5,252.1 5,786.6 -0.4% -9.6% Fresh Meat 2,236.9 2,674.5 2,660.5 -16.4% -15.9% Processed and Elaborated Products 2,353.2 1,913.2 2,408.6 23.0% -2.3% Others 642.5 664.5 717.5 -3.3% -10.5% TOTAL MARFRIG PROTEINS 5,232.5 5,252.1 5,786.6 -0.4% -9.6% Domestic markets 3,053.6 2,830.1 3,239.5 7.9% -5.7% Export markets 1,536.5 1,757.6 1,829.6 -12.6% -16.0% Others 642.5 664.5 717.5 -3.3% -10.5% Rua Chedid Jafet, 222 Bloco A - 1º andar - Vila Olímpia - São Paulo - SP – CEP: 04551-065 Tel: (11) 3792-8600/8650 www.marfrig.com.br/ri e-mail: ri@marfrig.com.br 20
  • 21. VOLUME BY SEGMENT / MARKET Var % Var % 1Q12 1Q11 4Q11 (TONNS) 1Q12 x1Q11 1Q12 x 4Q11 BEEF - BRAZIL 93,550 139,782 103,854 -33.1% -9.9% Domestic Market 63,956 95,878 74,795 -33.3% -14.5% Fresh Beef 48,521 86,534 55,514 -43.9% -12.6% Processed and Elaborated Products 15,435 9,344 19,281 65.2% -19.9% Exports 29,593 43,904 29,059 -32.6% 1.8% Fresh Beef 26,065 40,489 26,414 -35.6% -1.3% Processed and Elaborated Products 3,529 3,415 2,645 3.3% 33.4% BEEF - INTERNATIONAL 64,363 63,605 62,480 1.2% 3.0% Domestic Market 43,866 45,158 45,297 -2.9% -3.2% Fresh Beef 25,168 28,854 27,914 -12.8% -9.8% Processed and Elaborated Products 18,697 16,304 17,382 14.7% 7.6% Exports 20,497 18,447 17,183 11.1% 19.3% Fresh Beef 17,921 17,318 16,338 3.5% 9.7% Processed and Elaborated Products 2,577 1,129 845 128.2% 204.8% Others 125,867 174,939 147,125 -28.1% -14.4% TOTAL - BEEF 283,779 378,326 313,459 -25.0% -9.5% Fresh Beef 117,675 173,195 126,180 -32.1% -6.7% Processed and Elaborated Products 40,237 30,192 40,154 33.3% 0.2% Others 125,867 174,939 147,125 -28.1% -14.4% POULTRY & PORK - BRAZIL 331,674 362,508 353,928 -8.5% -6.3% Domestic Market 121,969 117,363 124,766 3.9% -2.2% Fresh Poutry 26,601 30,278 27,531 -12.1% -3.4% Fresh Pork 9,390 8,799 8,379 6.7% 12.1% Processed and Elaborated Products 85,978 78,286 88,856 9.8% -3.2% Exports 209,705 245,145 229,162 -14.5% -8.5% Fresh Poutry 182,646 213,560 200,056 -14.5% -8.7% Fresh Pork 17,286 21,240 19,789 -18.6% -12.6% Processed and Elaborated Products 9,773 10,345 9,317 -5.5% 4.9% POULTRY & PORK - INTERNATIONAL 352,926 353,356 364,934 -0.1% -3.3% Domestic Market 310,452 310,050 323,890 0.1% -4.1% Fresh Meat 29,898 36,857 33,002 -18.9% -9.4% Industrialized Products 280,554 273,193 290,888 2.7% -3.6% Exports 42,474 43,306 41,044 -1.9% 3.5% Fresh Meat 5,013 10,257 6,584 -51.1% -23.9% Industrialized Products 37,461 33,049 34,460 13.4% 8.7% Others 147,182 126,030 149,592 16.8% -1.6% TOTAL - POULTRY & PORK 831,782 841,894 868,455 -1.2% -4.2% Fresh Meat 270,834 320,991 295,341 -15.6% -8.3% Processed and Elaborated Products 413,766 394,873 423,521 4.8% -2.3% Others 147,182 126,030 149,592 16.8% -1.6% TOTAL - MARFRIG PROTEINS 1,115,561 1,220,220 1,181,914 -8.6% -5.6% Fresh Meat 388,509 494,186 421,522 -21.4% -7.8% Processed and Elaborated Products 454,004 425,065 463,675 6.8% -2.1% Others 273,049 300,969 296,718 -9.3% -8.0% TOTAL MARFRIG PROTEÍNAS 1,115,561 1,220,220 1,181,914 -8.6% -5.6% Domestic markets 540,243 568,449 568,748 -5.0% -5.0% Export markets 302,270 350,802 316,449 -13.8% -4.5% Others 273,049 300,969 296,718 -9.3% -8.0% Rua Chedid Jafet, 222 Bloco A - 1º andar - Vila Olímpia - São Paulo - SP – CEP: 04551-065 Tel: (11) 3792-8600/8650 www.marfrig.com.br/ri e-mail: ri@marfrig.com.br 21
  • 22. AVERAGE PRICE BY MARKET / SEGMENT Var % Var % 1Q12 1Q11 4Q11 (R$/kg) 1Q12 x 1Q11 1Q12 x 4Q11 BEEF - BRAZIL 9.26 7.80 9.70 18.8% -4.5% Domestic Market 9.40 7.93 9.55 18.5% -1.6% Fresh Beef 8.17 7.80 8.28 4.7% -1.3% Processed and Elaborated Products 13.24 9.14 13.23 44.9% 0.1% Exports 8.98 7.51 10.09 19.7% -11.0% Fresh Beef 8.60 7.36 10.06 16.9% -14.5% Processed and Elaborated Products 11.82 9.28 10.38 27.4% 13.8% BEEF - INTERNATIONAL 8.65 7.56 8.45 14.4% 2.3% Domestic Market 6.85 6.12 6.95 12.0% -1.4% Fresh Beef 7.03 6.13 7.02 14.5% 0.0% Processed and Elaborated Products 6.61 6.09 6.82 8.6% -3.1% Exports 12.49 11.09 12.41 12.6% 0.6% Fresh Beef 12.71 11.24 12.63 13.1% 0.6% Processed and Elaborated Products 10.96 8.78 8.09 24.8% 35.4% Others 2.50 2.02 2.41 23.7% 3.6% TOTAL - BEEF 6.12 5.08 6.03 20.4% 1.5% Fresh Beef 8.71 7.76 8.94 12.2% -2.5% Processed and Elaborated Products 9.89 7.49 10.16 32.0% -2.6% Otherrs 2.50 2.02 2.41 23.7% 3.6% POULTRY & PORK - BRAZIL 4.05 3.76 4.68 7.5% -13.5% Domestic Market 4.31 3.60 4.62 19.9% -6.6% Fresh Poutry 3.71 3.03 4.47 22.3% -17.1% Fresh Pork 4.63 3.37 3.86 37.2% 19.9% Processed and Elaborated Products 4.47 3.84 4.73 16.3% -5.6% Exports 3.89 3.84 4.71 1.2% -17.4% Fresh Poutry 3.74 3.69 4.61 1.4% -19.0% Fresh Pork 4.47 4.41 4.93 1.5% -9.3% Processed and Elaborated Products 5.69 5.87 6.37 -3.0% -10.6% POULTRY & PORK - INTERNATIONAL 5.17 4.68 5.15 10.6% 0.5% Domestic Market 5.24 4.42 5.05 18.4% 3.8% Fresh Meat 9.39 7.60 9.71 23.5% -3.3% Industrialized Products 4.80 3.99 4.52 20.1% 6.2% Exports 4.68 6.50 5.93 -27.9% -21.0% Fresh Meat 5.75 4.58 5.55 25.4% 3.5% Industrialized Products 4.54 7.09 6.00 -36.0% -24.4% Others 2.23 2.47 2.43 -9.8% -8.1% TOTAL - POULTRY & PORK 4.20 3.95 4.49 6.3% -6.4% Fresh Meat 4.47 4.14 5.19 8.0% -13.8% Processed and Elaborated Products 4.73 4.27 4.72 10.6% 0.0% Others 2.23 2.47 2.43 -9.8% -8.1% TOTAL - MARFRIG PROTEINS 4.69 4.30 4.90 9.0% -4.2% Fresh Meat 5.76 5.41 6.31 6.4% -8.8% Processed and Elaborated Products 5.18 4.50 5.19 15.2% -0.2% Others 2.35 2.21 2.42 6.6% -2.7% TOTAL - MARFRIG PROTEINS 4.69 4.30 4.90 9.0% -4.2% Domestic Markets 5.65 4.98 5.70 13.5% -0.8% Exports 5.08 5.01 5.78 1.5% -12.1% Others 2.35 2.21 2.42 6.6% -2.7% Rua Chedid Jafet, 222 Bloco A - 1º andar - Vila Olímpia - São Paulo - SP – CEP: 04551-065 Tel: (11) 3792-8600/8650 www.marfrig.com.br/ri e-mail: ri@marfrig.com.br 22