SlideShare uma empresa Scribd logo
1 de 34
Baixar para ler offline
1
RESULTADOS 4T22
Santo André, 14 de março de 2023: CVC Brasil Operadora e Agência de Viagens S.A. (B3: CVCB3) informa aos seus acionistas
e demais participantes do mercado os resultados do quarto trimestre de 2022 (4T22) e do ano de 2022. As informações operacionais
e financeiras a seguir, exceto quando indicado ao contrário, são apresentadas em milhões de reais nominais, elaboradas de acordo
com as normas contábeis brasileiras, notadamente a Lei nº 6.404/76 e os pronunciamentos emitidos pelo Comitê de
Pronunciamentos Contábeis (“CPC”) e aprovados pela Comissão de Valores Mobiliários (“CVM”) e devem ser lidas em conjunto com
as demonstrações financeiras e notas explicativas do exercício findo em 31 de dezembro de 2022.
2022: Receita Líquida atinge R$ 1,2 bilhão (+48% vs 2021),
enquanto EBITDA soma R$ 167 milhões (ante –R$ 235 mi em 2021);
Jan/23 registra R$ 1,4 bilhão em Reservas Confirmadas (+90% vs
jan/22)
 Reservas Confirmadas e Consumidas cresceram respectivamente 56% e 64% (YoY) por retomada
de vendas de todas as Unidades
 Alavancagem operacional: Receita Líquida avançou 48% em 2022, em função da forte retomada
nas viagens à negócios, lazer e eventos. Despesas Gerais e Administrativas subiram 13% em 2022 e
no 4T22 foi similar à reportada no 4T21;
 Maior EBITDA trimestral desde o 3T19: R$ 83,0 milhões;
 Transformação Digital
 Roll out completo da nova plataforma que consolida relacionamento com clientes B2C – apps, e-
commerce e lojas – com o CRM
 Disponibilização da Central de Financiamento, marketplace de crédito que amplia formas de
pagamento atrativas ao consumidor
 Lançamento do Programa de Fidelidade – Clube CVC
 Novo backoffice unificado para as operações do B2B.
 Evento subsequente – Reperfilamento das debêntures: em 10 de março de 2023, a Companhia
chegou a um acordo sobre o reperfilamento de sua dívida com debenturistas representando mais
de 75% das debêntures em circulação da 4a
emissão de cada série e de 100% das debêntures em
circulação da 5a
emissão. A implementação do reperfilamento está sujeita à concordância dos
debenturistas, bem como aprovação nas respectivas AGDs. Mais detalhes na pág. 10.
R$ milhões 4T22 4T21 ∆ 2022 2021 ∆
Reservas Confirmadas 3.455,4 3.044,2 13,5% 13.942,4 8.967,1 55,5%
Reservas Consumidas 3.693,6 3.444,6 7,2% 14.428,7 8.816,4 63,7%
Receita Líquida 321,4 314,0 2,4% 1.221,6 825,9 47,9%
Take Rate 8,7% 9,1% -0,4 p.p. 8,5% 9,4% -0,9 p.p.
EBITDA 83,0 (35,4) n.a. 166,5 (235,1) n.a.
EBITDA Ajustado 4,2 8,9 -52,4% 72,6 (218,8) n.a.
Prejuízo Líquido (96,8) (145,8) -33,6% (433,4) (486,6) -10,9%
Mercado de Capitais (31/12)
CVCB3: R$ 4,49 por ação
Total de ações: 277.247.309
Valor de mercado: R$ 1,2 bilhão
Vol. fin. méd. diário 4T22: R$
99 milhões
Teleconferência de resultados
15 de março de 2023
14hs (BRT) / 13hs (EST)
Tel. +55 11 4290-1621 /
+55 11 3181-8565
Link para a webcast
Relações com Investidores
https://ri.cvc.com.br/
ri@cvc.com.br
2
RESULTADOS 4T22
Mensagem da Administração
O ano de 2022 foi um marco na trajetória da CVC Corp no que tange à Transformação Digital e o desenvolvimento
da ominicalidade, com entregas relevantes, tais como novo sistema de frente de lojas e interação com clientes no B2C,
Programa de Fidelidade (intitulado Clube CVC), Central de Financiamento (ou Marketplace de Crédito) e sistema de
precificação dinâmica de produtos. Estas entregas nos permitem buscar novos patamares de eficiência e possibilitarão
usufruir de uma maior eficiência de operação e, consequentemente, alavancagem operacional. Adicionalmente, vale
destacar a evolução do nosso CRM, que já supera 34 milhões de clientes contatáveis, criando assim, sustentação para
uma jornada de relacionamento através de campanhas direcionadas e que contribuirão no aumento da conversão e
fidelização dos clientes, nosso CRM já está integrado com a nova plataforma do B2C e com todos os canais de venda
(website, loja e app).
Foram mais de R$ 400 milhões investidos em tecnologia desde 2020, dos quais mais de R$ 240 milhões somente em
2022, recorde absoluto da companhia e que encerra um ciclo mais acelerado de desenvolvimento de ferramentas. Por
tudo o que foi feito ao longo de 2022, a CVC conquistou, pelo 12º ano consecutivo, o prêmio Top of Mind na categoria
“Agência de Turismo” e estreou em destaque na nova categoria “Aplicativo de Turismo”.
Em linha com a estratégia de digitalização, lançamos, há poucas semanas, o ConecTaaS, uma nova plataforma para
integração de APIs, que aumenta a conectividade e facilita o acesso das agências para venda de produtos. A plataforma
é plug and play e funciona como uma vitrine de produtos.
Com o objetivo de ampliar os meios de pagamento e conveniência para nossos clientes, recentemente passamos a
permitir a utilização de pontos Livelo, que podem ser utilizados para cobrir o valor total ou parcial da compra de
produtos de viagens. Esta novidade já está disponível em toda a rede CVC e todos os clientes Livelo podem usufruir
desse novo benefício em todas as lojas físicas da CVC. Possuímos uma parceria de longa data com a Livelo, desde
2016, quando nos tornamos fornecedores de produtos relativos ao setor de turismo, através do site oficial do programa
de recompensas da empresa.
Em relação aos resultados, ao longo de 2022, as reservas e nosso resultado progrediram, demonstrando a recuperação
do mercado e capacidade de execução da Companhia. As reservas confirmadas e consumidas apresentaram
crescimento tanto no Brasil quanto na Argentina, e consequentemente crescimento da receita líquida entre períodos.
Nossas entregas, sejam de resultados ou de aperfeiçoamento da nossa operação, se alinham a nossos valores, em
especial o Honramos nossos Compromissos (correspondente a letra “H”, do nosso SONHO).
Ao longo de 2022, nos empenhamos em apoiar nossos clientes no uso dos créditos de viagens oriundos das restrições
impostas pela pandemia. Esse montante reduziu 62% em relação ao saldo final de 2021 (de R$ 761 milhões para R$
293 milhões). Nós também avançamos na frente de eficiência operacional, que resultou em melhor controle de
despesas. No início do 4T22 iniciamos processo de reavaliação de estruturas, racionalização de fornecedores, além de
uma grande revisão de processos internos. Este processo se estenderá ao longo de 2023 e terá auxílio de consultoria
externa, focando principalmente na revisão de atividades operacionais.
Diante da forte recuperação das vendas de 2022 e dos prognósticos de crescimento dos próximos anos, temos avaliado
constantemente nossa estrutura de capital. Em junho último foi homologada Oferta de Ações de R$ 403 milhões e nos
encontramos, neste momento, em tratativas finais para reperfilamento da nossa dívida. Contratamos assessor para nos
auxiliar e este mês divulgamos ao mercado proposta de reperfilamento de toda nossa dívida, cuja ampla aceitação nos
indica que estamos no caminho certo, construindo uma companhia mais sólida e rentável, com apoio de acionistas e
debenturistas. Quando concluído, A CVC Corp terá seu menor nível de dívida bruta desde 2017.
Iniciamos 2023 com o melhor janeiro em vendas desde o início da pandemia, com todas as áreas da empresa focadas
em trazer as melhores ofertas de produtos, serviços, e condições de pagamento para nosso público. Isso tudo está
sendo feito amparado numa estrutura de TI renovada e robusta, com melhor experiência para o cliente, e capaz de
suportar o aumento de demanda. Acreditamos que essas bases nos permitirão, ao longo do ano, aproveitar
oportunidades no mercado e, assim, reportar crescimento de vendas e evolução na nossa rentabilidade.
3
RESULTADOS 4T22
Resultado CVC Corp
Reservas Confirmadas e Reservas Consumidas
R$ milhões 4T22 4T21 ∆ 2022 2021 ∆
Reservas Confirmadas 3.455,4 3.044,2 13,5% 13.942,4 8.967,1 55,5%
Brasil 2.502,9 2.229,5 12,3% 10.274,6 7.455,4 37,8%
B2C 1.164,6 1.051,0 10,8% 4.557,2 3.781,9 20,5%
B2B 1.338,2 1.178,5 13,6% 5.717,4 3.673,6 55,6%
Argentina 952,5 814,7 16,9% 3.667,8 1.511,6 142,6%
Reservas Consumidas 3.693,6 3.444,6 7,2% 14.428,7 8.816,4 63,7%
Brasil 2.741,0 2.630,0 4,2% 10.760,9 7.304,8 47,3%
B2C 1.322,3 1.393,6 -5,1% 4.995,5 3.563,9 40,2%
B2B 1.418,7 1.236,4 14,7% 5.765,3 3.740,9 54,1%
Argentina 952,5 814,7 16,9% 3.667,8 1.511,6 142,6%
As Reservas Confirmadas apresentaram no 4T22 aumento de 13,5% em comparação ao 4T21, sendo
a procura por destinos internacionais (aumento de 42% no Brasil e de 71% na Argentina frente ao 4T21)
beneficiada por maior disponibilidade da malha aérea e frequência de voos. Além disso, as reservas do 4T22,
no Brasil, foram influenciadas positivamente pela Black Friday, que apresentou crescimento em relação ao
evento de 2021, porém afetadas adversamente pela Copa do Mundo, especialmente no B2B, e pela troca
de plataforma do B2C, que apesar de bem-sucedida ao não trazer transtornos aos clientes, impactou
momentaneamente operação de loja no período. Vale destacar que a nova plataforma do B2C permite
maior integração dos canais físico e digital, e também uma abordagem customizada para clientes em
ofertas, compras e atendimento.
Destaca-se o desempenho relacionado à temporada de cruzeiros 22/23, com aumento de mais de
200% frente ao 4T21, dada expansão de oferta daquela que está prevista para ser a maior temporada
brasileira de cruzeiros marítimos dos últimos 10 anos1
. Em janeiro/23, as vendas de produto marítimo
representaram 20% das reservas da unidade de negócio B2C, sendo que mais de 25% dos passageiros
embarcados no território brasileiro nesse mês foram clientes da CVC Corp. As reservas confirmadas
consolidadas em janeiro/23 totalizaram cerca de R$ 1,4 bilhão.
As Reservas Confirmadas na CVC Corp para destinos internacionais, seguiu em alta e representaram
53% das reservas confirmadas no período (39% no 4T21). Abaixo detalhamos a abertura por destinos no
Brasil e Argentina:
1
Fonte: https://abremar.com.br/guia-clia-brasil/
4
RESULTADOS 4T22
4T22 4T21
Brasil
Argentina
No B2C, as Reservas Consumidas diminuíram frente ao 4T21 onde, naquele trimestre, houve forte
retomada do turismo local, reflexo da demanda reprimida pós reabertura para viagens, vacinação avançada
e também por maior presença de feriados longos. No B2B, as Reservas Consumidas cresceram 14,7% frente
ao 4T21, fruto da retomada de eventos corporativos e viagens a negócios verificada ao longo dos últimos
três trimestres. Na Argentina, as Reservas Consumidas seguiram crescentes, principalmente, para destinos
internacionais, sendo a Almundo com maior representatividade destas reservas, impulsionada pela Copa do
Mundo de Futebol.
Desde o início da reabertura de diversos destinos, a Companhia se empenhou em auxiliar seus clientes
no uso dos créditos de viagens oriundos dos reagendamentos decorrentes das restrições impostas pela
pandemia de COVID-19. Esses montantes foram reduzidos significativamente ao longo de 2022, totalizando
saldo de R$ 292,7 milhões ao final de 2022, redução de R$ 468,5 milhões (ou 62%) frente ao fechamento
do 4T21 atingindo, dessa forma, ao final de 2022, patamares mais normalizados considerada a operação
usual da companhia. Cabe lembrar, ainda, que a Lei 14.390/222
, publicada em 04 de julho de 2022, estendeu
até 31 de dezembro de 2023 prazos de remarcação e de utilização de créditos disponibilizados para hotéis
e outros serviços terrestres.
3
Texto completo disponível em http://www.planalto.gov.br/ccivil_03/_ato2019-2022/2022/lei/L14390.htm
61%
39%
69%
31%
10%
90%
39%
61%
5
RESULTADOS 4T22
Receita Líquida
R$ milhões 4T22 4T21 ∆ 2022 2021 ∆
Receita Líquida 321,4 314,0 2,4% 1.221,6 825,9 47,9%
Brasil 255,7 262,1 -2,5% 960,3 706,7 35,9%
B2C 167,1 183,9 -9,1% 637,7 451,4 41,3%
B2B 88,6 78,3 13,2% 322,6 255,3 26,4%
Argentina 65,7 51,9 26,6% 261,3 119,1 119,3%
Take Rate 8,7% 9,1% -0,4 p.p. 8,5% 9,4% -0,9 p.p.
Brasil 9,3% 10,0% -0,7 p.p. 8,9% 9,7% -0,8 p.p.
B2C 12,6% 13,2% -0,6 p.p. 12,8% 12,7% 0,1 p.p.
B2B 6,2% 6,3% -0,1 p.p. 5,6% 6,8% -1,2 p.p.
Argentina 6,9% 6,4% 0,5 p.p. 7,1% 7,9% -0,8 p.p.
A Receita Líquida em 2022 cresceu 47,9% frente a 2021, reflexo do desempenho nas Reservas
Consumidas, contribuindo para a melhora dos resultados operacionais. No 4T22, a Receita Líquida foi similar
ao mesmo período do ano passado, com o crescimento das Reservas parcialmente contraposto, por retração
no take rate, em virtude do mix de negócios e de produtos, como o aumento das vendas de produto
marítimo e menor ocupação em produtos exclusivos em certas localidades.
O Take Rate alcançou 8,7% no 4T22, refletindo o forte
crescimento do produto marítimo, que apesar de possuir
menor take rate nominal, quando comparado a outros
produtos, não requer capital de giro. Importante relembrar
que o 4T21 foi sustentado pelo aumento de viagens,
sobretudo domésticas, devido à maior disponibilidade de
voos e a demanda reprimida, favorecendo
momentaneamente o take rate. Desta forma, o take rate do
4T22 foi 0,4 p.p. inferior ao reportado no 4T21.
A temporada de cruzeiros 22/23 ocorre entre outubro/22 a maio/23 e, segundo dados da Abremar,
conforme mencionado anteriormente, deverá ser a maior dos últimos anos.
O Take Rate da Argentina atingiu 6,9% no 4T22, superior em 0,5 p.p. frente ao 4T21, impulsionado
pela Ola. Vale mencionar que houve aumento de impostos sobre viagens internacionais, que foram
adicionados ao valor das reservas consumidas, porém sem impactos na Receita Líquida, desta forma
diluindo o take rate.
Em 28 de fevereiro, o Senado Federal aprovou, sem alterações, a conversão da Medida Provisória
1.138/2022 na Lei 14.537/2023, que estabeleceu a redução da alíquota nominal de 25% para 6% do Imposto
sobre a Renda Retido na Fonte (IRRF) incidente sobre as remessas ao exterior relativas a gastos pessoais em
viagens de turismo, negócios, serviços, treinamento ou missões oficiais entre jan/23 e dez/24,
incrementando-se em 1% ao ano até 2027 (9%). Esta redução tem como objetivo estimular o turismo,
buscando dar mais competitividade para agências e operadoras de turismo, que foi um dos setores mais
afetados pela pandemia de COVID-19, sendo a CVC Corp beneficiária desta medida.
6
RESULTADOS 4T22
Despesas
R$ milhões 4T22 4T21 ∆ 2022 2021 ∆
Despesas Gerais e Administrativas (249,3) (254,7) -2,1% (908,4) (801,0) 13,4%
Despesas de Vendas (62,1) (64,8) -4,2% (243,3) (159,8) 52,2%
Outras Receitas/Despesas Operacionais 73,0 (29,9) n.a. 96,7 (100,2) n.a.
Subtotal Despesas Operacionais (238,4) (349,5) -31,8% (1.055,1) (1.060,9) -0,6%
(-) Itens não recorrentes 75,6 (53,4) n.a. 74,6 (46,1) n.a.
Subtotal Despesas Operacionais
Recorrentes
(314,0) (296,1) 6,0% (1.129,5) (1.014,8) 11,3%
(+) Taxa de Serviços - Fee Boleto (3,2) (9,1) -65,3% (19,3) (29,8) -35,3%
EBITDA Ajustado 4,2 8,9 -52,4% 72,6 (218,8) n.a.
As Despesas Gerais e Administrativas ficaram praticamente em linha quando comparadas às do
4T21 pela racionalização e maior controle de despesas fixas, apesar dos impactos negativos dos acordos
sindicais (reajuste de 5,82%, a partir de novembro de 2022 no Brasil e de cerca de 65% na moeda local da
Argentina nos últimos 12 meses). No acumulado do ano, o fortalecimento de algumas áreas, como
Operações e TI, contribuíram para o aumento de 13,4% nesta rubrica, além dos efeitos, ao longo do ano, de
reajuste salarial no Brasil de 10% ocorrido em novembro de 2021.
No 4T22 foi iniciado um programa formal de aumento de eficiência, focando na racionalização de
estruturas e processos, com consequente redução de despesas. Dado os investimentos feitos em automação
ao longo dos últimos anos, foram feitos ajustes na estrutura gerencial da CVC Corp, parte realizada no 4T22
e parte em janeiro/23. Este programa de eficiência seguirá ao longo de 2023, focado principalmente em
processos/atividades operacionais.
As Outras Receitas/Despesas Operacionais registraram valor positivo de R$ 73,0 milhões
composto principalmente por (i) reversão de provisões para riscos provenientes de aquisições passadas,
que não se materializaram, (ii) receitas provenientes de incentivos de distribuidores de bilhetes aéreos e
parcialmente compensados por (iii) despesas com reembolsos e cancelamentos. No 4T21, esta rubrica havia
registrado montante negativo em decorrência, principalmente, de despesas incorridas pela descontinuação
das operações da Companhia Aérea ITA. Em 2022 esta rubrica registou o valor positivo de R$ 96,7 milhões,
principalmente pelos efeitos citados do 4T22, em especial incentivos de distribuidores de bilhetes aéreos,
fruto da recuperação das Reservas Confirmadas ao longo do ano, que cresceram 55,5% ante 2021.
As Despesas não recorrentes no 4T22 totalizaram valor positivo de R$ 75,6 milhões, montante
composto majoritariamente pela reversão de provisões (vide item “i” de Outras Receitas/ Despesas
Operacionais).
R$ milhões 4T22 4T21 ∆ 2022 2021 ∆
Despesas de Vendas (62,1) (64,8) -4,2% (243,3) (159,8) 52,2%
Brasil (45,8) (43,2) 6,0% (185,9) (102,7) 81,0%
como % das Reservas Consumidas 1,7% 1,6% 0,1 p.p. 1,7% 1,4% 0,3 p.p.
Provisão para perda - PCLD (20,3) (8,2) n.a. (47,7) 2,8 n.a.
Marketing (9,4) (17,1) -45,2% (66,7) (54,8) 21,6%
Custo do Cartão de Crédito (16,1) (17,9) -10,5% (71,5) (50,7) 41,1%
Argentina (16,3) (21,6) -24,6% (57,4) (57,1) 0,6%
como % das Reservas Consumidas 1,7% 2,7% -1,0 p.p. 1,6% 3,8% -2,2 p.p.
7
RESULTADOS 4T22
No 4T22, as Despesas de Vendas da CVC Corp reduziram 4,2% em comparação ao 4T21 enquanto
que no acumulado do ano cresceram 52,2%, reflexo do aumento das Reservas Consumidas na Argentina
(+143%) e no Brasil (+47%).
No Brasil, houve diferente calendarização das despesas de marketing ao longo dos trimestres, fruto
da necessidade do negócio e ambiente do setor de turismo, estando o crescimento da rubrica, em 2022,
similar ao crescimento das Reservas Confirmadas do B2C (20,5% nas Reservas e 21,6% nas Despesas de
Marketing), lembrando que em 2022 celebramos 50 anos da CVC e tivemos ações de marketing ligadas a
isso.
Em 2022 as Despesas com Cartão de Crédito no Brasil tiveram crescimento inferior ao das Reservas
Consumidas (+47,3%), fruto das oscilações usuais no mix de recebimento ao longo do ano. Adicionalmente,
no 4T22, houve efeito do aumento de reservas consumidas do produto marítimo, no qual o pagamento é
processado diretamente na armadora, sendo a CVC Corp apenas comissionada por este serviço.
Ao longo do ano, houve menor representatividade do uso de boletos, principalmente em virtude da
implantação da central de financiamentos (Marketplace de Crédito).
Por fim, a PCLD acumulada do ano de 2022 retrata o crescimento das operações ocorrida no ano,
que segue com regras conservadoras na concessão de crédito, bem como observa-se que em 2021 essa
rubrica apresentou valor positivo em virtude de alto volume de reversões de provisões constituídas no ano
de 2020, por ocasião da pandemia.
Na operação argentina, houve redução nas despesas de vendas, quando comparadas com o 4T21,
por (i) redução das despesas associadas ao processamento de pagamentos por cartão de crédito, dada
restrição imposta pelo governo na forma de parcelamento de viagens internacionais na operação de varejo
(sobretudo Almundo), acarretando mais pagamentos à vista e (ii) menores despesas com marketing, assim
como no Brasil, em função da calendarização destas despesas ao longo dos trimestres. Na comparação
anual as despesas com vendas permaneceram estáveis.
EBITDA
R$ milhões 4T22 4T21 ∆ 2022 2021 ∆
EBITDA Ajustado 4,2 8,9 -52,4% 72,6 (218,8) n.a.
(+) Itens Não Recorrentes 75,6 (53,4) n.a. 74,6 (46,1) n.a.
(-) Taxa de Serviços - Fee Boleto (3,2) (9,1) -65,3% (19,3) (29,8) -35,3%
EBITDA 83,0 (35,4) n.a. 166,5 (235,1) n.a.
(+) Depreciação e amortização (53,4) (60,7) -12,0% (203,2) (208,6) -2,6%
(+) Equivalência Patrimonial (0,3) - n.a. (0,9) - n.a.
(+) Resultado Financeiro (111,6) (42,1) 165,1% (309,5) (101,7) n.a.
Prejuízo antes de IR e CS (82,4) (138,2) -40,4% (347,1) (545,3) -36,4%
(+) IR e CS (14,4) (7,5) 92,1% (86,4) 58,7 n.a.
Prejuízo Líquido (96,8) (145,8) -33,6% (433,4) (486,6) -10,9%
No 4T22, A CVC Corp registrou EBITDA de R$ 83,0 milhões, frente ao resultado negativo de R$ 35,4
milhões no 4T21, influenciado principalmente pelo controle das Despesas Operacionais e também pelo
resultado positivo das Outras Receitas/Despesas Operacionais, conforme descrito acima; enquanto que o
EBITDA do ano alcançou R$ 166,5 milhões, R$ 401,6 milhões superior ao registrado em 2021.
8
RESULTADOS 4T22
Resultado Financeiro
R$ milhões 4T22 4T21 ∆ 2022 2021 ∆
Despesas Financeiras (117,4) (81,1) 44,7% (375,5) (205,7) 82,5%
Encargos Financeiros (53,9) (35,3) 52,7% (198,1) (115,5) 71,5%
Juros - antecipação de recebíveis (50,6) (20,8) 143,6% (96,3) (20,8) n.a.
Taxa de Serviços - Fee Boleto (3,2) (9,1) -65,3% (19,3) (29,8) -35,2%
Outras despesas financeiras (9,8) (15,9) -38,7% (61,8) (39,7) 55,7%
Receitas Financeiras 10,3 22,0 -53,2% 80,3 67,3 19,4%
Rend. de aplicações financeiras 17,5 17,1 2,4% 63,6 44,5 42,9%
Outras receitas financeiras (7,2) 4,9 n.a. 16,7 22,7 -26,6%
Variação Cambial (hedge) (4,5) 17,0 n.a. (14,4) 36,8 n.a.
Resultado Financeiro (111,6) (42,1) 165,1% (309,5) (101,7) n.a.
O Resultado Financeiro totalizou despesa líquida de R$ 111,6 milhões no 4T22 e o aumento em
comparação ao 4T21 deve-se, principalmente, aos efeitos do aumento do CDI médio que incide sobre a
dívida líquida (7,63% a.a. no 4T21 para 13,65% a.a. no 4T22) e encargos sobre as antecipações de recebíveis,
sendo R$ 998,6 milhões o montante de antecipações realizadas neste trimestre, em virtude da maior
necessidade de caixa do período dado a sazonalidade do negócio e crescimento das operações.
A variação cambial registou, no 4T22, perda de R$ 4,5 milhões (que incluem marcação a mercado de
derivativos de proteção - hedge) ante ganho de R$ 17,0 milhões no 4T21, em função do resultado da
variação da marcação a mercado de derivativos, da variação cambial sobre saldo de bancos e pagamentos
internacionais.
No acumulado do ano, a variação do Resultado Financeiro está atrelada principalmente: (i) aumento
do CDI médio do período que incide sobre a dívida líquida, a qual saiu de 4,46% a.a. em 2021 para 12,45%
a.a. em 2022, (ii) despesas incorridas com antecipações de recebíveis ao longo de 2022 e também (iii)
aumento de R$ 22,1 milhões em Outras Despesas Financeiras em comparação a 2021, majoritariamente
explicado pelo incremento nos juros das aquisições feitas no passado e imposto sobre operações financeiras
(IOF). Para mais detalhes sobre Resultado Financeiro, vide Nota Explicativa 22 da Demonstração Financeira.
Em decorrência da Lei do PERSE, as alíquotas de IR/CSLL passaram a ser zero para as operações no
Brasil. Entretanto, no 4T22, o montante de R$ 14,4 milhões negativo apresentando nesta linha, refere-se
majoritariamente às operações no exterior e tributos diferidos cuja realização ocorrerá após o período de
vigência da lei do PERSE (mar/27). Adicionalmente, no período, houve a reversão de provisão para perda de
créditos fiscais sobre prejuízo fiscal em uma das controladas da CVC Corp, dado a adesão ao Programa de
Antecipação de Dívidas da PGFN 8.798/20223
.
No acumulado do ano, houve reversão de créditos tributários constituídos, que geraram impacto
contábil negativo de R$ 86,4 milhões, sendo que deste montante, R$ 62,1 milhões foram baixados no 1T22,
em decorrência da Lei do PERSE.
Em 2021, por outro lado, a Companhia ainda constituía créditos tributários ao longo do 1S21, sendo
que desde o 3T21 não foram mais constituídos créditos tributários diferidos na operação do Brasil. Para
mais detalhes sobre IR/CSLL, vide Nota Explicativa 15 da Demonstração Financeira.
No 4T22 foi registrado Prejuízo Líquido de R$ 96,8 milhões, 33,6% inferior aos R$ 145,8 milhões
apurados no 4T21, fruto da melhora do Resultado Operacional. Em 2022, o prejuízo registrado foi de R$
433,4 milhões, 10,9% inferior ao reportado em 2021, R$ 486,6 milhões.
3
Texto completo no link: http://normas.receita.fazenda.gov.br/sijut2consulta/link.action?idAto=126532
9
RESULTADOS 4T22
Investimentos (Capex) e Transformação Digital
R$ milhões
4T22 4T21 ∆ 2022 2021 ∆
78,6 60,5 30,0% 244,8 133,6 83,2%
Os Investimentos realizados pela CVC Corp no 4T22 totalizaram R$ 78,6 milhões e foram direcionados,
principalmente para finalização dos projetos focados na transformação digital e também destinados à
Tecnologia e Segurança da Informação, alinhado com o Plano de Investimento aprovado em 2021. Os
principais projetos foram:
(i) Atlas, maior projeto da transformação digital, é a plataforma para relacionamento com o cliente da
CVC e, já ativa em todas as lojas do Brasil, integrando todos os canais que atendem os clientes da
marca. O Atlas é importante pilar no objetivo da CVC de deixar de ter uma relação apenas transacional
com o cliente e estar com ele na jornada completa.
(ii) Clube CVC, o Programa de Fidelidade da CVC, permite que os clientes acumulem pontos e possam
resgatá-los posteriormente em viagens. O programa já está disponível no site e no aplicativo da CVC,
e deve chegar nas lojas físicas da marca a partir do segundo trimestre de 2023.
(iii) Marketplace de crédito, que funciona como uma central de financiamentos, permitindo que os
clientes tenham diversas opções para financiar suas viagens, podendo parcelar em até 24 vezes iguais,
junto às instituições financeiras parceiras da CVC.
(iv) Nova versão do Aplicativo CVC com melhor usabilidade na navegação, incluindo novas funções
como check-in de hotel via app e um marketplace de parceiros;
(v) Projetos de ganho de eficiência: a transformação digital acontece também para os times internos
da CVC. Como forma de trazer mais eficiência, transparência e integração para os nossos sistemas,
implementamos melhorias que somadas permitem obter ganhos de produtividade;
(vi) Lançamento do ConecTaaS, uma nova plataforma para integração de APIs, que aumenta a
conectividade e facilita o acesso das agências para venda de produtos. A plataforma é plug and play
e funciona como uma vitrine de produtos;
(vii) Ainda em implementação, a integração de sistemas operacionais e back-office no B2B, trazendo
mais produtividade para as agências, aprimorando a oferta de serviços a agentes de viagem,
promovendo também melhorias operacionais e de back-office;
Além de todas estas frentes, a CVC Corp segue em um contínuo trabalho de aperfeiçoamento da gestão de
informações por meio de datalake e CRM, que atualmente conta com mais de 34 milhões de clientes
cadastrados, e é pilar fundamental para aumentarmos cada vez mais o conhecimento sobre nossos clientes,
destacando que o CRM já está integrado com a nova plataforma do B2C e com todos os canais de venda
(site, loja e app).
Por fim, ao final de 2022, encerra-se o maior e mais acelerado ciclo de investimentos da trajetória da
Companhia. Para 2023 espera-se que os investimentos convirjam para patamares mais usuais e, portanto,
mais próximos ao Capex de manutenção da Companhia.
10
RESULTADOS 4T22
Fluxo de caixa
O fluxo de caixa nas atividades operacionais do trimestre geraram R$ 453,0 milhões, e estão
impactadas pelas antecipações de recebíveis que a companhia realizou.
No 4T22, o valor de recebíveis antecipados somava R$ 998,6 milhões, dada a maior necessidade de
caixa do período devido a sazonalidade inerente do negócio e crescimento das operações. O Caixa ao final
do trimestre somava R$ 687,5 milhões, valor superior ao caixa mínimo (R$ 250,0 milhões) definido em sua
política de gestão de caixa. Em 31 de dezembro de 2022, o valor de R$ 1.012,4 milhões de recebíveis
antecipados, é relativo a recebíveis de cartão de crédito que venceriam em 2023.
Em 2022, o fluxo de caixa da CVC Corp foi composto também por (i) investimentos no montante de
R$ 244,8 milhões, em linha com o Plano de Investimento da Companhia aprovado em 2021; (ii) aumento de
capital, que resultou em ingresso líquido de R$ 378,2 milhões no caixa, um importante reforço para a gestão
financeira que foi concluído com sucesso ao final de junho de 2022 e, (iii) a amortização de R$ 100,0 milhões
da debênture CVCB15, realizada em 30 de junho.
Endividamento
Ao final de 2022, o saldo em debêntures somava R$ 896,7 milhões, inferior aos R$ 990,1 milhões
verificados ao fim de 2021 devido a amortização de R$ 100 milhões em junho último e cerca de metade do
endividamento bruto verificado ao final de 2019 (pré-pandemia).
Desde 2020 a CVC Corp vem envidando esforços para melhor equalização de sua estrutura de capital
e gestão do seu passivo, que cresceu de forma acelerada nos anos anteriores pelas aquisições de empresas
realizadas no Brasil e na Argentina. Nesse interim, a despeito das dificuldades impostas pela Covid-19 ao
setor de turismo, foram realizados aumentos de capital (follow-on), com consequente diminuição gradativa
do endividamento da Companhia. Em 2022 foram empenhados esforços no tocante a reorganização integral
da dívida remanescente. Inicialmente, no 1º semestre, houve tratativas para uma possível nova emissão que
viria a substituir as séries existentes, estas sucedidas por um follow-on em meados do ano que possibilitou
a entrega de diversos projetos estratégicos e suporte ao capital de giro. Posteriormente, ao longo do 2º
semestre, novas alternativas foram avaliadas pela CVC Corp, culminando na contratação de assessor externo,
em jan/23, para conclusão das tratativas entre Companhia e debenturistas e acordo sobre a Proposta de
Reperfilamento de Dívida comunicado via Fato Relevante e Aviso aos Debenturistas em 10 de março de
2023.
R$ milhões 4T22 4T21 2022 2021
Prejuízo antes do Imposto de Renda e Contribuição Social (82,4) (138,2) (347,1) (545,3)
Ajustes itens não caixa 96,4 69,5 478,7 261,0
Variação no Capital de Giro 439,1 299,9 (13,3) 179,8
Caixa líquido nas atividades Operacionais 453,0 231,2 118,3 (104,5)
Caixa líquido das atividades de invest. - Capex (78,6) (60,5) (244,8) (133,6)
Empréstimos e Debêntures - - (100,0) (547,7)
Aumento de capital 0,1 (2,0) 378,2 806,6
Juros pagos (78,0) (37,5) (181,0) (88,1)
Aquisição de controladas (8,2) (0,8) (51,6) (39,5)
Outros (2,8) (2,5) (16,4) (20,7)
Caixa líquido nas atividades de financiamento (89,0) (42,8) 29,1 110,6
Variação Cambial Caixa e Equivalentes de caixa (0,3) 4,4 (10,9) 12,5
Fluxo de Caixa no período 285,2 132,3 (108,3) (115,0)
Caixa no início do período 402,4 663,5 795,8 910,8
Caixa no final do período 687,5 795,8 687,5 795,8
11
RESULTADOS 4T22
Nos termos apresentados, a Companhia chegou a um acordo com debenturistas representando mais
de 75% das debêntures em circulação da 4ª emissão de cada série e 100% das debêntures em circulação da
5ª emissão (“Debêntures”) para reperfilamento destas Debêntures, de modo a alongar o perfil de sua dívida,
e na redução do endividamento, por meio da amortização de R$ 124 milhões quando da conclusão da
celebração dos aditamentos às respectivas escrituras das Debêntures. Os principais termos e condições
propostos encontram-se resumidos detalhados no quadro-resumo a seguir.4
Atual Aditamento Proposto
4ª Emissão – série 1 4ª Emissão – série 2 5ª Emissão 4ª e 5ª Emissões
Juros
Taxa CDI + 6% a.a. CDI + 6,5% a.a. CDI + 5,75% a.a. CDI+5,5% a.a.
Prêmio - - -
3,6%, equivalente a diferença
entre a taxa acima e CDI+7%
a.a., ajustado no PU
Pgto. juros Semestral Semestral Trimestral Semestral
Carência n.a. n.a. n.a. Até mai/24
Pagamentos
Amortização inicial - - -
R$ 124 milhões
CVCB14: 20%
CVCB24: 10%
CVCB15: 10%
Amortização da
dívida
18/04/2023
18/04/2024 01/06/2023 Nov/24: 10%
18/04/2025 07/04/2023 Nov/25: 45%
Nov/26: 45%
Vencimento 18/04/2023 18/04/2025 01/06/2023 nov/26
Pré pagamento Sim Sim Sim Vedado pré pagamento
Conversibilidade e
capitalização
futura
- - - Ver abaixo
Outros
Covenants Dív. Líq/Ebitda ≤3,5x Dív. Líq/Ebitda ≤3,5x
Dív. Líq/Ebitda
≤3,5x
Dividend payout: 25%
Capex: R$ 125 mi/ano
Dív. Líq/EBITDA
Dez/23: <=3,5x
Mar/25: <=3,0x
Mar/26: <=2,5x
Garantias - - -
13,3%do saldo devedor em
recebíveis de cartões de crédito
Negative Pledge - - - Ativos > R$ 100 mi
Saldo 12/2022 R$ 388,0 R$ 211,7 R$ 297,3
Conversibilidade e capitalização futura5
:
a. Caso a Companhia realize uma captação por meio de aumento de capital até 30/11/2023 em
valor igual ou superior a R$125 milhões, a Companhia se comprometerá com a realização de
uma tender offer de ao menos R$75 milhões para as Debêntures Existentes reperfiladas
considerado o PU Par acrescido de prêmio de 3%.
b. Caso a Companhia não realize uma captação por meio de aumento de capital até 30/11/2023
em valor igual ou superior a R$125 milhões, a Companhia se obriga a aprovar um aumento de
capital limitado a R$ 200 milhões com o objetivo de capitalizar as Debêntures, onde o preço por
ação será fixado considerando o menor preço entre: (i) R$3,50 por ação; ou (ii) um deságio médio
4 Recomenda-se a leitura integral do Fato Relevante de 10/03/2023, incluindo o term sheet de reperfilamento anexo, disponível no site da Companhia e CVM
5 Recomenda-se a leitura integral do Fato Relevante de 10/03/2023, incluindo o term sheet de reperfilamento anexo, disponível no site da Companhia e CVM
12
RESULTADOS 4T22
de 20% (vinte por cento) sobre a cotação média de fechamento dos 30 (trinta) dias corridos
imediatamente anteriores à data de aprovação do aumento de capital pela Emissora.
Com a conclusão desse reperfilamento a Administração entende estar melhor equacionado, pelos
próximos anos, os vencimentos da dívida ao seu fluxo de caixa previsto, de forma a não comprometer sua
capacidade de crescimento e investimento em suas operações. Adicionalmente, o endividamento bruto da
Companhia é novamente reduzido e atinge o menor patamar desde dez/2017. Ainda que o endividamento
atual esteja condizente com o porte e momento da Companhia, seguirá avaliando possibilidades para
reduções adicionais do endividamento, a depender de como evoluírem as condições de mercado dos
próximos anos.
A implementação do reperfilamento está sujeita à concordância desses debenturistas em relação aos
documentos definitivos do reperfilamento, bem como de sua aprovação nas respectivas assembleias gerais
de debenturistas, sendo a da 4ª emissão de debêntures a ser realizada em 06/04/20236
. Se concluída com
sucesso, o endividamento da Companhia passará a ter o seguinte cronograma de amortização:
Cronograma atual de amortização das debêntures
R$ milhões
Cronograma proposto de amortização das debêntures
R$ milhões
6
Para mais informações acesse o Edital de Convocação publicado em 13/03/2023.
13
RESULTADOS 4T22
Anexos
Anexo 1: Balanço Patrimonial (R$ milhões)
Ativo 31/12/2022 31/12/2021 Passivo 31/12/2022 31/12/2021
Ativo Circulante Passivo Circulante
Caixa e equivalentes de caixa 687,5 795,8 Debentures 693,7 218,6
Aplicações Financeiras 127,4 190,8 Instrumentos Financeiros derivativos 2,0 1,8
Instrumentos financeiros derivativos 1,1 - Fornecedores 753,4 671,4
Contas a receber de clientes 515,5 1.092,9 Contratos a embarcar antecipados 1.363,7 2.112,4
Adiantamentos a fornecedores 445,1 714,2 Salários e encargos sociais 145,8 138,3
Despesas antecipadas 39,6 37,5 Impostos de Renda e Contribuição Social correntes 3,8 5,2
Impostos a Recuperar 80,7 108,0 Impostos e contribuições a pagar 66,5 65,8
Outras contas a receber 65,6 43,8 Contas a pagar de aquisição de controlada e investida 22,8 31,5
Total do ativo circulante 1.962,4 2.982,9 Passivo de arrendamento 16,7 12,8
Outras contas a pagar 61,8 101,8
Total do Passivo Circulante 3.130,4 3.359,7
Ativo Não Circulante Passivo Não Circulante
Despesas pagas antecipadamente 23,6 25,8 Debêntures 203,0 771,4
Impostos a recuperar 4,1 - Impostos de Renda e Contribuição Social a pagar 21,2 43,2
Impostos diferidos 555,3 654,7 Provisão demandas jud. e adm. e passivo contingente 94,8 243,7
Depósito Judicial 135,3 99,7 Contas a pagar de aquisição de controlada e investida 90,1 97,1
Outras contas a receber 11,1 12,7 Passivos de Arrendamento 43,6 27,7
Investimentos 4,5 - Contratos a embarcar antecipados 6,2 25,5
Ativo imobilizado 36,1 38,2 Outras contas a pagar 11,9 13,6
Ativo intangível 1.130,4 1.108,1 Total do passivo não circulante 470,7 1.222,2
Ativos de Direito de Uso 54,6 34,9
Total do ativo não circulante 1.955,1 1.974,2 Patrimônio Líquido
Capital social 1.414,0 1.371,7
Reservas de capital 812,6 478,7
Ágio em Transição de Capital (183,8) (183,8)
Outros Resultados abrangentes 61,7 63,3
Ações em Tesouraria (0,1) (0,1)
Prejuízos acumulados (1.787,9) (1.354,4)
Total do Patrimônio líquido 316,5 375,3
Total do Ativo 3.917,6 4.957,2 Total do Passivo e Patrimônio Líquido 3.917,6 4.957,2
14
RESULTADOS 4T22
Anexo 2: Demonstração de Resultados
Consolidado Brasil Argentina Consolidado Brasil Argentina
R$ milhões 4T22 4T21 4T22 4T21 4T22 4T21 2022 2021 2022 2021 2022 2021
Receita Líquida 321,4 314,0 255,7 262,1 65,7 51,9 1.221,6 825,9 960,3 706,7 261,3 119,1
Despesas de vendas (41,4) (56,3) (25,4) (35,0) (16,0) (21,2) (194,9) (161,6) (138,2) (105,5) (56,6) (56,1)
Perda por redução ao valor recuperável de
contas a receber
(20,7) (8,5) (20,3) (8,2) (0,4) (0,4) (48,4) 1,8 (47,7) 2,8 (0,7) (1,0)
Total das Despesas gerais e administrativas (302,7) (315,4) (226,4) (262,5) (76,3) (52,9) (1.111,6) (1.009,5) (877,4) (829,0) (234,2) (180,6)
Despesas gerais e administrativas (249,3) (254,7) (188,8) (227,2) (60,5) (27,6) (908,4) (801,0) (735,2) (704,0) (173,2) (97,0)
Depreciação e amortização (53,4) (60,7) (37,6) (35,4) (15,8) (25,3) (203,2) (208,6) (142,2) (125,0) (61,0) (83,6)
Equivalência Patrimonial (0,3) - (0,3) - - - (0,9) - (0,9) - - -
Outras receitas/despesas operacionais 73,0 (29,9) 36,5 (33,8) 36,5 3,8 96,7 (100,2) 43,8 (108,4) 52,8 8,2
Lucro (Prejuízo) antes do resultado
financeiro
29,2 (96,1) 19,7 (77,4) 9,6 (18,8) (37,6) (443,6) (60,1) (333,4) 22,5 (110,3)
Resultado financeiro (111,6) (42,1) (110,8) (58,7) (0,8) 16,6 (309,5) (101,7) (292,5) (129,2) (17,0) 27,6
Lucro (Prejuízo) antes do imposto de
renda e contribuição social
(82,4) (138,2) (91,1) (136,1) 8,8 (2,1) (347,1) (545,3) (352,6) (462,6) 5,5 (82,7)
Imposto de renda e CS (14,4) (7,5) (14,2) (2,1) (0,2) (5,4) (86,4) 58,7 (85,2) 61,8 (1,1) (3,1)
Corrente (0,1) 0,8 (0,1) 0,8 (0,0) (0,1) (0,9) 0,6 (0,8) 0,8 (0,0) (0,2)
Diferido (14,3) (8,3) (14,1) (2,9) (0,2) (5,4) (85,5) 58,1 (84,4) 61,0 (1,1) (2,9)
Lucro (Prejuízo) líquido do exercício (96,8) (145,8) (105,3) (138,2) 8,6 (7,6) (433,4) (486,6) (437,8) (400,8) 4,4 (85,8)
Atribuído a acionistas controladores (96,8) (147,2) (105,3) (138,2) 8,6 (9,0) (433,4) (476,3) (437,8) (401,4) 4,4 (74,9)
Atribuído a acionistas não controladores - 1,5 - - - 1,5 - (10,3) - 0,6 - (10,9)
15
RESULTADOS 4T22
Anexo 3: Fluxo de Caixa - Método indireto
R$ milhões 4T22 4T21 2022 2021
Prejuízo antes do Imposto de Renda e Contribuição Social (82,4) (138,2) (347,1) (545,3)
Ajustes para reconciliar o resultado do exercício com o caixa das atividades operacionais 96,4 69,5 478,7 261,0
Depreciação e amortização 53,4 60,7 203,2 208,6
Perda por redução ao valor recuperável de contas a receber 20,7 8,6 48,4 (1,8)
Juros e variações monetárias e cambiais 79,3 28,6 282,3 83,1
Equivalência patrimonial 0,3 - 0,9 -
Provisão (reversão) para demandas judiciais e administrativas (63,7) (36,4) (76,4) (61,3)
Mudanças do valor justo da opção de compra - (1,4) - (3,2)
Baixa de imobilizado, intangível e contratos de aluguéis – IFRS 16 7,2 5,8 17,8 16,2
Outras provisões (0,8) 3,6 2,5 19,4
Redução (aumento) em ativos e passivos 439,1 299,9 (13,3) 179,8
Contas a receber de clientes 408,4 442,2 440,8 61,1
Adiantamentos a fornecedores 231,8 41,8 267,7 117,0
Fornecedores 104,3 114,4 92,7 170,0
Contratos a embarcar antecipados (407,5) (295,6) (755,0) (24,4)
Variação em tributos a recuperar/ recolher 12,4 8,6 19,8 48,2
Liquidação de instrumentos derivativos (0,2) 1,4 (16,1) 0,5
Salários e encargos sociais (10,1) (5,9) 9,2 (8,5)
Imposto de renda e contribuição social pagos (5,2) (0,4) (4,7) (2,0)
Provisão para demandas judiciais e administrativas (30,4) 0,2 (32,9) (1,1)
Variação em outros ativos 123,9 (33,4) 0,9 (179,3)
Variação em outros passivos 11,7 26,7 (35,6) (1,7)
Caixa líquido nas atividades Operacionais 453,0 231,2 118,3 (104,5)
Ativo imobilizado (1,6) (11,7) (16,2) (12,1)
Ativo intangível (77,0) (49,6) (223,2) (121,5)
Aquisições de controladas 0,0 0,8 (5.4) -
Caixa líquido aplicado nas atividades de Investimentos - Capex (78,6) (60,5) (244,8) (133,6)
Captação de debêntures e empréstimos - - - 436,4
Liquidação de debêntures e empréstimos - - (100,0) (984,1)
Aumento de capital 0,1 (2,0) 378,2 806,6
Juros pagos (78,0) (37,5) (181,0) (88,1)
Captação/Liquidação de instrumentos derivativos - - - (9,8)
Exercício de opções com alienação de ações em tesouraria - - - -
Aquisição de controladas (8,2) (0,8) (51,6) (39,5)
Pagamento de arrendamento - IFRS16 (2,8) (2,5) (16,4) (10,9)
Caixa líquido (aplicado nas) proveniente das atividades de Financiamento (89,0) (42,8) 29,1 110,6
Variação Cambial Caixa e Equivalentes (0,3) 4,4 (10,9) 12,5
Aumento (redução) de caixa e equivalentes de caixa líquidos 285,2 132,3 (108,3) (115,0)
Caixa e equivalentes de caixa no início do período 402,4 663,5 795,8 910,8
Caixa e equivalentes de caixa no final do período 687,5 795,8 687,5 795,8
16
RESULTADOS 4T22
Anexo 4: Representatividade dos meios de pagamento nas Reservas Confirmadas CVC Lazer
Anexo 5: Evolução da rede de lojas
4T22 3T22 2T22 1T22 4T21
Brasil 1.111 1.129 1.147 1.158 1.176
CVC 1.059 1.076 1.093 1.103 1.119
Próprias 14 16 16 13 12
Novo Layout 12 12 12 9 4
Franquias 1.045 1.060 1.077 1.090 1.107
Novo Layout 29 19 13 6 -
Experimento 52 53 54 55 57
Próprias 4 4 4 4 4
Franquias 48 49 50 51 53
Argentina 107 107 98 98 103
Almundo 107 107 98 98 103
Próprias 5 5 7 7 7
Franquias 102 102 91 91 96
Total CVC Corp 1.218 1.236 1.245 1.256 1.279
17
RESULTADOS 4T22
Glossário
B2B: Unidade de negócio que apresenta uma solução completa para os agentes de viagens e seus respectivos clientes corporativos.
Composta pelas marcas: Esferatur, Trend Via, Visual Turismo, RexturAdvance e VHC. Descrição das marcas vide CVC Brasil.
B2C: Unidade de negócio focada no cliente final. Composta pelas marcas: CVC, Experimento, Submarino. Descrição das marcas vide
CVC Brasil.
Bibam: Marcas Biblos e Avantrip.
Contratos a embarcar: Desde o início da pandemia, a Companhia vem oferecendo a remarcação das reservas e dos serviços que
foram adiados ou a concessão de crédito para uso ou abatimento na compra futura de outras reservas ou serviços de turismo,
segundo a conveniência do próprio consumidor (o valor contabilizado é líquido de penalidades ou multas por cancelamento).
Conforme Nota Explicativa 19 da Demonstração Financeira da Companhia.
CVC Argentina: Maior agência de viagens da Argentina, composta pelas marcas Almundo (agência de viagens e serviços
complementares), Avantrip (plataforma online de viagens e serviços complementares), Biblos (agência focada em viagens de luxo e
personalizadas) e Ola Transatlantica (operadora de produtos e serviços de viagem).
CVC Brasil: Composto pelas marcas CVC (agência de viagens e serviços complementares, Top of Mind no Brasil pelo 12º ano
consecutivo), Experimento (agência de intercâmbio estudantil e serviços complementares, Submarino Viagens (portal de venda
online de passagens aéreas, hospedagens, pacotes turísticos, aluguel de carros e seguro viagem), Esferatur (consolidadora aérea e
hotéis, oferece também locação de carros), Trend Viagens (consolidadora de hotéis no Brasil e exterior, pacotes turísticos, locação
de carros, entre outros), Visual Turismo (especializada em viagens personalizadas, seja para viagens de lazer, lua de mel, ecoturismo,
peregrino-religiosos, cruzeiros ou incentivo), RexturAdvance (consolidadora aérea de voos nacionais e internacionais) e VHC (marca
de locação e administração de residências).
CVC Corp: Maior agência de turismo da América Latina, com operações no Brasil e Argentina, composta pelas marcas da CVC Brasil
e CVC Argentina, descritas acima.
Despesa Financeira: Despesas financeiras relacionadas principalmente aos empréstimos bancários e taxas sobre serviços financeiros,
incluindo as despesas de juros referente às antecipações de cartão de crédito
EBITDA (Earnings Before Interest, Taxes, Depreciation and Amortization): é uma medida não contábil elaborada pela Companhia em
consonância com a Instrução da CVM nº 527, de 4 de outubro de 2012 ("Instrução CVM 527"), conciliada com suas demonstrações
financeiras e consiste no lucro líquido antes do resultado financeiro líquido, excluindo as depreciações, amortizações e resultado
de equivalência patrimonial.
EBITDA Ajustado: conforme demostrado neste documento, toma como base o EBITDA, excluído os efeitos não recorrentes do
período e acrescido das despesas incorridas com emissões de boleto (reconhecidas contabilmente na rubrica Despesas Financeiras).
Também pode ser calculado a partir do Lucro Líquido, acrescendo o Resultado financeiro líquido, o Imposto de renda e contribuição
social e as Despesas com depreciação, amortização e resultado da equivalência patrimonial, líquidos dos valores referentes ao fee
do boleto – Financeiras e despesas não recorrentes. O EBITDA ajustado não é uma medida contábil utilizada nas práticas contábeis
adotadas no Brasil ou pelo IFRS, e não deve ser considerado como uma alternativa ao lucro líquido na qualidade de indicador do
desempenho operacional ou como uma alternativa ao fluxo de caixa na condição de indicador de liquidez. Nossa definição de
EBITDA ajustado pode não ser comparável ao EBITDA ajustado conforme definido por outras empresas.
Não recorrentes: Os efeitos não recorrentes registrados incluem, fundamentalmente (i) Impactos referente ao COVID-19 (impactos
ocasionados pelo cenário de pandemia, que inclui comissões de lojas não recuperadas por reembolso, multas, baixas de receitas
não realizadas e outros gastos não relacionados a reservas); (ii) impairment de intangíveis; (iii) passivos contingentes; entre outros.
Receita líquida: é o resultado das receitas de intermediação menos o custo dos serviços prestados e impostos sobre venda, e
usualmente denominadas dessa forma no setor. Nas Demonstrações Financeiras, essa métrica é reportada como Lucro Bruto.
Reservas confirmadas Brasil e Argentina: resultado de novas vendas e reagendamentos, líquidos de cancelamentos no período.
Reservas consumidas: Reservas que dão base à Receita Líquida, incluindo o online, segundo critérios de reconhecimento de receita
de cada marca, a saber: CVC no Check-in; Experimento no Check-in; Submarino Viagens aéreo na venda e terrestre + voos/produtos
exclusivos (popularmente conhecido como fretamento) no Check-in; RexturAdvance aéreo na venda e terrestre no Check-in;
Esferatur na venda; Trend no Check-in; Visual no Check-in e VHC nos checkouts realizados.
Reservas Consumidas Argentina: Reservas Confirmadas para a Biblos + Reservas Consumidas para a Ola Transatlantica
Take rate: importante métrica utilizada no setor, resulta da divisão da receita líquida pelas Reservas Consumidas.
1
RESULTS 4Q22
Santo André, March 14, 2023: CVC Brasil Operadora e Agência de Viagens S.A. (B3: CVCB3) informs its shareholders and other
market participants of the results for the fourth quarter of 2022 (4Q22) and the year of 2022 (2022). Unless otherwise indicated, the
financial and operating information below are presented in nominal million of reais (R$), prepared pursuant to the Brazilian
accounting standards, especially Law No. 6.404/76 and the standards issued by the Accounting Standards Committee (“CPC”) and
approved by the Securities and Exchange Commission of Brazil (“CVM”), and must be read together with the financial statements
and the explanatory notes for the period ended December 31, 2022.
2022: Net Revenue reaches R$ 1.2 billion (up 48% vs 2021), while
EBITDA totals R$ 167 million (compared to –R$ 235 million in 2021);
R$ 1.4 billion in Confirmed Bookings recorded in January 2023 (up 90%
vs January 2022)
 Bookings and Consumed Bookings grew 56% and 64% respectively (YoY), due to the resumption
of sales at all Units
 Operating leverage: Net Revenue grew 48% in 2022, as a result of the strong recovery in business
travel, pleasure travel, and event travel. General and Administrative Expenses increased 13% in 2022;
in 4Q22 they were like those reported in 4Q21;
 Highest quarterly EBITDA since 3Q19: R$ 83.0 million;
 Digital Transformation
 Complete roll-out of the new platform that consolidates relationships with B2C customers (apps, e-
commerce and stores) with CRM
 Availability of the Financing Center, a credit marketplace that expands payment methods that are
attractive to consumers
 Launch of Programa de Fidelidade - Clube CVC (Loyalty program)
 A new and unified backoffice for B2B operations.
 Subsequent event – Renegotiation of debentures: On March 10, the Company entered into an
agreement for the total renegotiation of its debt, in agreement with debenture holders representing
more than 75% of the outstanding debentures of the 4th issue of each series and 100% of the
outstanding debentures of the 5th issue. The implementation of the reprofiling is subject to the
consent of the debenture holders, as well as approval at the respective Debenture Holders General
Meeting. More details on pg. 10.
R$ million
4Q22 4Q21 ∆ 2022 2021 ∆
Bookings 3,455.4 3,044.2 13.5% 13,942.4 8,967.1 55.5%
Consumed Bookings 3,693.6 3,444.6 7.2% 14,428.7 8,816.4 63.7%
Net Revenue 321.4 314.0 2.4% 1,221.6 825,9 47.9%
Take Rate 8.7% 9.1% -40 bps 8.5% 9.4% -90 bps
EBITDA 83.0 (35.4) n.m. 166.5 (235.1) n.m.
Adjusted EBITDA 4.2 8.9 -52.4% 72.6 (218.8) n.m.
Net Loss (96.8) (145.8) -33.6% (433.4) (486.6) -10.9%
Capital Markets (Dec. 31)
CVCB3: R$ 4.49 per share
Total shares: 277,247,309
Market cap: R$ 1.2 billion
Daily avg fin vol. 4Q22: R$ 99
million
Results Conference Call
March 15, 2023
2:00 p.m. (BRT) / 1:00 p.m.
(EST)
Ph. +55 11 4290-1621 /
+55 11 3181-8565
Link for webcast
Investor Relations
https://ri.cvc.com.br/
ri@cvc.com.br
2
RESULTS 4Q22
Message from Management
The year 2022 was a milestone in the trajectory of CVC Corp in terms of Digital Transformation and the development
of “omnichannelity”, with relevant deliveries such as a new storefront system as well as interaction with customers in
B2C, Customer Loyalty Program (called “Clube CVC”), Financing Center (or Credit Marketplace), and dynamic product
pricing system. These deliveries have allowed us to seek new levels of efficiency and will make it possible for us to
enjoy greater operating efficiency and, consequently, operating leverage. Also noteworthy was the evolution of our
CRM, which already exceeds 34 million contactable customers, thus creating support for a relationship journey through
targeted campaigns that will contribute toward higher conversion and greater customer loyalty, our CRM is already
integrated with the new B2C platform and with all sales channels (website, store and app).
An amount of more than R$ 400 million has been invested in technology since 2020, of which more than R$ 240 million
was in 2022 alone, an absolute record for the company that ends a more accelerated cycle of tool development. Due
to everything that was done throughout 2022, CVC won, for the 12th
consecutive year, the Top-of-Mind award in the
“Tourism Agency” category and made its debut in the new “Tourism Application” category.
In line with the digitalization strategy, several weeks ago we launched ConecTaaS, a new platform for integrating APIs,
which increases connectivity and facilitates access for CVC agencies to sell products. The platform is plug-and-play,
and functions like a product showcase.
With the aim of expanding the means of payment and convenience for our customers, we recently started to allow the
use of Livelo (rewards program) points, which can be used to cover the total or partial amount of the purchase of travel
products. This new offering is now available throughout the CVC network, and all Livelo customers can enjoy this new
benefit at all CVC brick-and-mortar locations. We have a long-standing partnership with Livelo (since 2016), when we
became suppliers of products related to the tourism sector, through the official website of the company’s rewards
program.
With regard to results, our bookings and earnings progressed throughout 2022, demonstrating the recovery of the
market and the Company’s performance capacity. Confirmed and consumed bookings increased both in Brazil and
Argentina, and, consequently, the net revenue between periods grew as well. Our deliveries – whether in terms of
results or the enhancement of our operation – are aligned with our values, especially “We Honor our Commitments”.
Throughout 2022, we endeavored to support our customers in the use of travel credits resulting from the restrictions
imposed by the pandemic. This amount fell 62% compared to the final balance of 2021 (from R$ 761 million to R$ 293
million). We also made progress on the operating efficiency front, which resulted in better control of expenses. In early
4Q22, we began the process of reassessing structures and streamlining suppliers, in addition to a major overhaul of
internal processes. This process will extend throughout 2023 and will be supported by an external consulting firm,
focusing primarily on revising operational activities.
In view of the strong recovery in sales in 2022 and the growth forecasts for the coming years, we have been constantly
assessing our capital structure. Last June, the Offer of Shares of R$ 403 million was ratified, and we are currently in the
final stages of negotiations for the reprofiling of our debt. We hired an advisor to assist us, and this month we released
to the market a proposal for reprofiling our entire debt; the broad acceptance of this proposal indicates that we are
on the right path, building a more solid and profitable company, with the support of shareholders and debenture
holders. When completed, CVC Corp will have its lowest level of gross debt since 2017.
We started out 2023 with the best January in sales since the onset of the pandemic, with all areas of the company
focused on bringing the best offers in products, services, and payment terms to our target audience. This is all being
done in a way that is supported by a refurbished and robust IT structure, with a better customer experience, capable
of supporting the increase in demand. We believe that these bases will allow us to take advantage of opportunities on
the market throughout the year, and thus report sales growth and evolution in our profitability.
3
RESULTS 4Q22
CVC Corp Result
Bookings and Consumed Bookings
R$ million 4Q22 4Q21 ∆ 2022 2021 ∆
Bookings 3,455.4 3,044.2 13.5% 13,942.4 8,967.1 55.5%
Brazil 2,502.9 2,229.5 12.3% 10,274.6 7,455.4 37.8%
B2C 1,164.6 1,051.0 10.8% 4,557.2 3,781.9 20.5%
B2B 1,338.2 1,178.5 13.6% 5,717.4 3,673.6 55.6%
Argentina 952.5 814.7 16.9% 3,667.8 1,511.6 142.6%
Consumed Bookings 3,693.6 3,444.6 7.2% 14,428.7 8,816.4 63.7%
Brazil 2,741.0 2,630.0 4.2% 10,760.9 7,304.8 47.3%
B2C 1,322.3 1,393.6 -5.1% 4,995.5 3,563.9 40.2%
B2B 1,418.7 1,236.4 14.7% 5,765.3 3,740.9 54.1%
Argentina 952.5 814.7 16.9% 3,667.8 1,511.6 142.6%
Bookings increased by 13.5% in 4Q22 over 4Q21, with demand for international destinations (42%
increase in Brazil and 71% in Argentina compared to 4Q21) benefiting from greater availability of the airline
network and frequency of flights. Furthermore, 4Q22 bookings in Brazil were positively influenced by Black
Friday, which grew in relation to the 2021, but adversely affected by the World Cup, especially in B2B, and
by the change of B2C platform, which despite successful in not causing inconvenience to customers, it
momentarily impacted store operations in the period. It is worth mentioning that the new B2C platform
allows for greater integration of the physical and digital channels, as well as a customized approach for
customers in offers, purchases and service.
We also highlight our performance regarding the 2022/2023 cruise season, with an increase of more
than 200% compared to 4Q21, given the expansion of offer of what is expected to be the busiest Brazilian
cruise season in the last 10 years1
. In January 2023, cruise product sales accounted for 20% of the B2C
Business Unit’s bookings; more than 25% of all passengers who boarded cruise ships within Brazil that month
were customers of CVC Corp. Consolidated confirmed bookings in January 2023 totaled roughly R$ 1.4
billion.
Bookings at CVC Corp for international destinations continued to rise and accounted for 53% of
confirmed bookings in the period (39% in 4Q21). Below, we detail the breakdown by destination in Brazil
and Argentina:
1
Source: https://abremar.com.br/guia-clia-brasil/
4
RESULTS 4Q22
4Q22 4Q21
Brazil
Argentina
In B2C, Consumed Bookings were down compared to 4Q21, when there was a strong resumption of
local tourism, reflecting the pent-up demand following the reopening for travel as well as advanced
vaccination, and also due to the higher number of long weekends. In B2B, Consumed Bookings grew 14.7%
vis-à-vis 4Q21, because of the resumption of corporate events and business travel witnessed over the last
three quarters. In Argentina, Consumed Bookings continued to grow, mainly to international destinations,
with Almundo being the most highly representative of these bookings, driven by the FIFA World Cup.
Since the beginning of the reopening of various destinations, the Company has endeavored to assist
its customers in the use of travel credits stemming from rescheduling because of the restrictions imposed
by the COVID-19 pandemic. These amounts were significantly reduced throughout 2022, for a total a
balance of R$ 292.7 million at the end of 2022, a reduction of R$ 468.5 million (or 62%) compared to the
closing of 4Q21, thus reaching – at the end of 2022 – more normal levels considering the company’s usual
operation. It is also worth recalling that the Law 14390/222
, published on July 04, 2022, extended deadlines
for rescheduling and using credits available in hotels and other ground services to December 31, 2023.
3
Full text available at http://www.planalto.gov.br/ccivil_03/_ato2019-2022/2022/lei/L14390.htm
61%
39%
69%
31%
10%
90%
39%
61%
National International
5
RESULTS 4Q22
Net Revenue
R$ million 4Q22 4Q21 ∆ 2022 2021 ∆
Net Revenue 321.4 314.0 2.4% 1,221.6 825.9 47.9%
Brazil 255.7 262.1 -2.5% 960.3 706.7 35.9%
B2C 167.1 183.9 -9.1% 637.7 451.4 41.3%
B2B 88.6 78.3 13.2% 322.6 255.3 26.4%
Argentina 65.7 51.9 26.6% 261.3 119.1 119.3%
Take Rate 8.7% 9.1% -40 bps 8.5% 9.4% -90 bps
Brazil 9.3% 10.0% -70 bps 8.9% 9.7% -80 bps
B2C 12.6% 13.2% -60 bps 12.8% 12.7% 10 bps
B2B 6.2% 6.3% -10 bps 5.6% 6.8% -120 bps
Argentina 6.9% 6.4% 50 bps 7.1% 7.9% -80 bps
Net Revenue in 2022 grew 47.9% over 2021, reflecting the performance in Consumed Bookings,
contributing toward the improvement of operating income (loss). In 4Q22, Net Revenue was similar to the
same period last year, with the growth in Bookings partially offset by a downturn in the take rate, due to the
mix of businesses and products, such as increased sales of cruise products and lower occupancy on exclusive
products at certain locations.
The Take Rate reached 8.7% in 4Q22,
reflecting the strong growth of cruise products,
which – despite having a lower nominal take rate
compared to other products – does not require
working capital. It is worth noting that 4Q21 was
sustained by the increase in travel (mainly domestic),
due to the greater availability of flights and pent-up
demand, momentarily favoring the take rate. As a
result, the take rate in 4Q22 was 0.4% lower than the
one reported in 4Q21.
The 2022/2023 cruise season runs from October 2022 to May 2023 and – according to data from the
Brazilian Cruise Lines Association (Abremar) – is expected to be the busiest in recent years, as mentioned
above.
Argentina’s Take Rate reached 6.9% in 4Q22, 0.5% higher than in 4Q21, driven by Ola. It is also worth
mentioning that there was an increase in taxes on international travel, which were added to the value of
consumed bookings (albeit with no impact on Net Revenue), thereby diluting the take rate.
On February 28, Brazil’s Federal Senate approved (unaltered) the conversion of Provisional
Measure 1138/2022 into Law 14537/2023, which established the reduction of the nominal rate from 25% to
6% of Withholding Income Tax (IRRF) levied on remittances abroad related to personal expenses on travel
for tourism, business, services, training, or official missions from January 2023 to December 2024; thereafter,
increasing by 1% per annum until 2027 (capping at 9%). This reduction aims to stimulate tourism, seeking
to make tourism agencies and operators more competitive, which was one of the sectors most affected by
the COVID-19 pandemic, with CVC Corp benefiting from this measure.
37% 33%
46% 56%
17% 11%
4Q22 4Q21
Consumed Bookings - Product B2C (%)
Air Non - Air Cruise
6
RESULTS 4Q22
Expenses
R$ million 4Q22 4Q21 ∆ 2022 2021 ∆
General and administrative expenses (249.3) (254.7) -2.1% (908.4) (801.0) 13.4%
Sales expenses (62.1) (64.8) -4.2% (243.3) (159.8) 52.2%
Other operating revenue/expenses 73.0 (29.9) n.m. 96.7 (100.2) n.m.
Subtotal Operating Expenses (238.4) (349.5) -31.8% (1,055.1) (1,060.9) -0.6%
(-) Non-Recurring Items 75.6 (53.4) n.m. 74.6 (46.1) n.m.
Subtotal Recurring Operating Expenses (314.0) (296.1) 6.0% (1,129.5) (1,014.8) 11.3%
(+) Service Fee - Bank fee slips (3.2) (9.1) -65.3% (19.3) (29.8) -35.3%
Adjusted EBITDA 4.2 8.9 -52.4% 72.6 (218.8) n.m.
General and Administrative Expenses were practically in line when compared to 4Q21 due to the
rationalization and greater control of fixed expenses, despite the negative impacts of union agreements
(adjustment of 5.82%, as of November 2022 in Brazil, and around 65% in local currency in Argentina in the
last 12 months). In YTD, the strengthening of certain areas, such as Operations and IT, contributed to the
13.4% increase in this item, in addition to the effects, throughout the year, of the 10% wage readjustment
in Brazil in November 2021.
In 4Q22, a formal program to increase efficiency was initiated, focusing on the streamlining of
structures and processes, with a consequent reduction in expenses. Given the investments made in
automation over the past few years, adjustments were made to CVC Corp’s management structure, partly
carried out in 4Q22 and partly in January 2023. This efficiency program will continue throughout 2023,
focusing primarily on operating processes/activities.
Other Operating Revenues/Expenses recorded a positive amount of R$ 73.0 million, mostly
composed of (i) reversal of provisions for risks stemming from past acquisitions, which did not materialize;
(ii) revenues from incentives for airline ticket distributors and partially offset by (iii) expenses on refunds and
cancellations. In 4Q21, this item had recorded a negative amount, mainly due to expenses incurred by the
discontinuation of the operations of Companhia Aérea ITA. In 2022 this item recorded a positive amount of
R$ 96.7 million, mainly due to the effects mentioned in 4Q22, in particular incentives for air ticket
distributors, as a result of the recovery of Bookings throughout the year, which grew 55.5% compared to
2021.
Non-recurring expenses in 4Q22 totaled a positive amount of R$ 75.6 million, mostly composed of
the reversal of provisions (see item “i” of Other Operating Income/Expenses).
In the 4Q22, Sales expenses of CVC Corp decreased 4.2% against 4Q21, while in YTD grew 52.2%,
reflecting the increase in Consumed Bookings in Argentina (+143%) and Brazil (+47%).
R$ million 4Q22 4Q21 ∆ 2022 2021 ∆
Sales expenses (62.1) (64.8) -4.2% (243.3) (159.8) 52.2%
Brasil (45.8) (43.2) 6.0% (185.9) (102.7) 81.0%
as% of Consumed Bookings 1.7% 1.6% 10 bps 1.7% 1.4% 30 bps
Provision for Doubtful Accounts (20.3) (8.2) n.m. (47.7) 2.8 n.m.
Marketing (9.4) (17.1) -45.2% (66.7) (54.8) 21.6%
Credit Card Fees (16.1) (17.9) -10.5% (71.5) (50.7) 41.1%
Argentina (16.3) (21.6) -24.6% (57.4) (57.1) 0.6%
as% of Consumed Bookings 1.7% 2.7% -100 bps 1.6% 3.8% -220 bps
7
RESULTS 4Q22
In Brazil, there was a different timing of marketing expenses over the quarters, as a result of business
needs and the environment of the tourism sector; the growth of this item in 2022 was similar to the growth
of B2C Bookings (20.5% in Bookings and 21.6% in Marketing Expenses), bearing in mind that in 2022 we
celebrated the 50th
anniversary of CVC and we had marketing actions related to this fact.
In 2022, Credit Card Expenses in Brazil had a lower growth than Consumed Bookings (+47.3%), as a
result of the usual fluctuations in the receipt mix throughout the year. Additionally, in 4Q22, there was an
effect of the increase in consumed bookings of the maritime product, in which payment is processed directly
at the shipowner, with CVC Corp only commissioning for this service.
Throughout the year, there was less representation of the use of payment orders, mainly due to the
implementation of the financing center (Credit Marketplace).
Lastly, the accumulated Allowance for Doubtful Accounts for 2022 portrays the growth in operations
that occurred in the year, which follows conservative rules in granting credit; one can also see that this item
presented a positive value in 2021, stemming from the high volume of reversals of allowances recognized
in 2020 due to the pandemic.
In the Argentine operation, there was a reduction in selling expenses, compared to 4Q21, due to: (i)
reduction in expenses associated with processing payments by credit card, given the restriction imposed by
the government in the form of installment payments for international travel in the retail operation (mainly
Almundo), thereby resulting in more payments in cash; and (ii) lower marketing expenses, as was seen in
Brazil, due to the timing of these expenses over the quarters. In YoY, selling expenses remained stable.
EBITDA
R$ million 4Q22 4Q21 ∆ 2022 2021 ∆
Adjusted EBITDA 4.2 8.9 -52.4% 72.6 (218.8) n.m.
(+) Non-recurring items 75.6 (53.4) n.m. 74.6 (46.1) n.m.
(-) Service Fee - Bank fee slips (3.2) (9.1) -65.3% (19.3) (29.8) -35.3%
EBITDA 83.0 (35.4) n.m. 166.5 (235.1) n.m.
(+) Depreciation and amortization (53.4) (60.7) -12.0% (203.2) (208.6) -2.6%
(+) Equity Pick up (0.3) - n.m. (0.9) - n.m.
(+) Financial expenses (111.6) (42.1) 165.1% (309.5) (101.7) n.m.
Loss before income tax and social
contribution
(82.4) (138.2) -40.4% (347.1) (545.3) -36.4%
(+) Income tax and social contribution (14.4) (7.5) 92.1% (86.4) 58.7 n.m.
Net income / Loss (96.8) (145.8) -33.6% (433.4) (486.6) -10.9%
In 4Q22, CVC Corp recorded EBITDA of R$ 83.0 million, vis-à-vis a negative result of R$ 35.4 million in 4Q21,
mainly influenced by the control of Operating Expenses and by the positive result of Other Operating
Income/Expenses, as described above; while EBITDA for the year reached R$ 166.5 million, i.e., R$ 401.6
million higher than the one recorded in 2021.
8
RESULTS 4Q22
Financial Result
R$ million 4Q22 4Q21 ∆ 2022 2021 ∆
Financial expenses (117.4) (81.1) 44.7% (375.5) (205.7) 82.5%
Financial charges (53.9) (35.3) 52.7% (198.1) (115.5) 71.5%
Interest - receivable prepayment (50.6) (20.8) 143.6% (96.3) (20.8) n.m
Service Fee - Bank fee slips (3.2) (9.1) -65.3% (19.3) (29.8) -35.2%
Other Financial expenses (9.8) (15.9) -38.7% (61.8) (39.7) 55.7%
Financial Income 10.3 22.0 -53.2% 80.3 67.3 19.4%
Yield from interest earning bank
deposits
17.5 17.1 2.4% 63.6 44.5 42.9%
Other Financial Income (7.2) 4.9 n.m 16.7 22.7 -26.6%
Exchange rate (hedge) (4.5) 17.0 n.m (14.4) 36.8 n.m
Financial Result (111.6) (42.1) 165.1% (309.5) (101.7) n.m
The Financial income (loss) totaled a net expense of R$ 111.6 million in 4Q22. The growth compared
to 4Q21 is mainly due to the effects of the increase in the average CDI which levies on net debt (from 7.63%
p.a. in the 4Q21 to 13.65% p.a. in the 4Q22) and charges on prepayments of receivables and R$ 998.6 million
is the amount of prepayments made in this quarter due to a greater need for cash in the period due to
business seasonality and operation growth.
The exchange change recorded a loss pf R$ 4.5 million in the 4Q22 (which includes mark-to-market
of hedge derivatives) against a gain of R$ 17.0 million in 4Q21, due to the result of the mark-to-market
change of derivatives, exchange rate change on bank balances and international payments.
In YTD, the change in the Financial Income (loss) is mainly linked to: (i) the increase in the average CDI
rate for the period on net debt, which went from 4.46% p.a. in 2021 to 12.45% p.a. in 2022, (ii) expenses
incurred with prepayments of receivables during 2022 and also (iii) the increase of R$ 22.1 million in Other
Financial Expenses compared to 2021, mainly due to increase in interest of acquisitions made in the past
and tax on financial operations (IOF). For further details on Financial Income (Loss), see Note 22 of the
Financial Statement.
As a result of the PERSE Law, the income tax and social contribution rates became zero for
operations in Brazil. However, the negative amount of R$ 14.4 million in 4Q22 presented in this line refers
mainly to operations abroad and deferred taxes whose realization will occur after the effectiveness of the
PERSE Law (Mar/27). Furthermore, there was a reversal of the provision for loss of tax credits in the period
on tax losses in one of CVC Corp’s subsidiaries, considering the joining to the Debt Prepayment Program
PGFN 8798/2022.3
In YTD, there was a reversal of tax credits constituted, which generated a negative accounting impact
of R$ 86.4 million, of which R$ 62.1 million were derecognized in 1Q22, as a result of the PERSE Act [a law
that sets out tax incentives for the Events Sector, including hospitality, transportation, restaurants/bars, etc.].
In 2021, on the other hand, the Company still constituted tax credits throughout 1S21, and since 3Q21
no longer it recognized deferred tax credits in the operation in Brazil. For further details on IR/CSLL, see
Note 15 of the Financial Statement.
In 4Q22, CVC recorded a Net Loss of R$ 96.8 million, 33.6% lower than the amount of R$ 145.8 million
recorded in 4Q21, as a result of the improvement in the Operating income (loss). In 2022, the loss recorded
was R$ 433.4 million, 10.9% lower than the one reported in 2021 – R$ 486.6 million.
3
Full text in the link: http://normas.receita.fazenda.gov.br/sijut2consulta/link.action?idAto=126532
9
RESULTS 4Q22
Investments (Capex) and Digital Transformation
R$ million
4Q22 4Q21 ∆ 2022 2021 ∆
78.6 60.5 30.0% 244.8 133.6 83.2%
Investments made by CVC Corp in 4Q22 totaled R$ 78.6 million and were mainly directed towards the
completion of projects focused on digital transformation and also aimed at Information Technology and
Security, aligned with the Investment Plan approved in 2021. The main projects were:
(i) Atlas, the largest project of digital transformation, is CVC’s customer relationship platform and is
already active in all stores in Brazil integrating all channels that serve the brand’s customers. Atlas is
an essential pillar in CVC’s goal of moving from just a transactional relationship with the customer to
being with them on the full journey.
(ii) Clube CVC, CVC’s Loyalty Program allows customers to accumulate points and redeem them for
later trips. The program is available on the CVC’s website and app, and is expected to reach the brand’s
physical stores from the second quarter of 2023.
(iii) Credit Marketplace, which works as a financing center, which allows customers to have several
options to finance their trips, being able to pay in up to 24 equal installments with CVC’s partner
financial institutions.
(iv) New version of the CVC Application has a better navigation usability, including new functions such
as hotel check-in via the app and a partner marketplace;
(v) Efficiency gain projects: the digital transformation also happens for CVC’s internal teams. As a way
to bring more efficiency, transparency and integration to our systems, we have implemented
improvements that together allow obtaining productivity gains;
(vi) Launch of ConecTaaS, a new platform for integrating APIs, which increases connectivity and
facilitates CVC agencies’ access to product sales. The platform is plug-and-play, and functions like a
product showcase;
(vii) Still under implementation, the integration of operating and back-office systems in B2B, bringing
more productivity to agencies, improving the offer of services to travel agents, also promoting
operational and back-office improvements;
In addition to all these fronts, CVC Corp continues to work on improving information management through
datalake and CRM, which currently has more than 34 million registered customers, and it is an essential pillar
for us to increase knowledge about our customers, platform and with all sales channels (website, store and
app).
Lastly, at the end of 2022, the largest and most accelerated investment cycle in the Company’s trajectory
ended. For 2023, investments are expected to converge to more usual levels, therefore closer to the Capex
maintained by the Company.
10
RESULTS 4Q22
Cash Flow
Cash flow from operating activities in the quarter generated R$ 453.0 million, and are impacted by
prepayments of receivables that the company realized.
In 4Q22, the amount of prepaid receivables amounted to R$ 998.6 million, given the greater need
for cash in the period due to the inherent seasonality of the business as well as the growth in operations.
Cash, at the end of the quarter, totaled R$ 687.5 million, an amount higher than the minimum cash position
(R$ 250.0 million) defined in its cash management policy. At December 31, 2022, the amount of R$ 1,012.4
million in prepaid receivables relates to credit card receivables due in 2023.
In 2022, CVC Corp’s cash flow was also composed of (i) investments in the amount of R$ 244.8
million, in line with the Company’s Investment Plan approved in 2021; (ii) capital increase, which resulted in
a net cash inflow of R$ 378.2 million, a major reinforcement for financial management that was successfully
completed in late June 2022; and (iii) the amortization of R$ 100.0 million of the CVCB 15 debenture, made
on June 30.
Debt
At the end of 2022, the balance in debentures totaled R$ 896.7 million, lower than the R$ 990.1
million reported at the end of 2021, due to the amortization of R$ 100 million last June and roughly half of
the gross debt reported at the end of 2019 (pre-pandemic).
Since 2020, CVC Corp has been making efforts to better equalize its capital structure and manage its
liabilities, which grew rapidly in previous years due to the acquisitions of companies in Brazil and Argentina.
In the intervening period, despite the difficulties imposed by Covid-19 on the tourism sector, capital
increases (follow-on) were carried out, with a consequent gradual decrease in the Company’s indebtedness.
In 2022, efforts were made to fully reorganize the remaining debt. Initially, in the 1st semester of the year,
negotiations were carried out for a possible new issuance that would replace the existing series; these were
succeeded by a follow-on in the middle of the year that enabled the delivery of several strategic projects
and support for working capital. Subsequently, throughout the 2nd semester, new alternatives were
assessed by CVC Corp, culminating in the hiring of an external advisor, in January 2023, to conclude
negotiations between the Company and debenture holders and to present the Debt Reprofiling Proposal
communicated via Material Fact and Notice to Debenture Holders on March 10, 2023.
Under the terms presented, the Company reached an agreement with debenture holders
representing more than 75% of the outstanding debentures of the 4th issue of each series and 100% of the
R$ milhões 4Q22 4Q21 2022 2021
Net Income / Loss before taxes and social contribution (82.4) (138.2) (347.1) (545.3)
Non-cash Itens 96.4 69.5 478.7 261.0
Decrease in working capital 439.1 299.9 (13.3) 179.8
Net Cash Flow From Operations 453.0 231.2 118.3 (104.5)
Net Cash Flow invested in Investments activities - Capex (78.6) (60.5) (244.8) (133.6)
Debentures and loans - - (100.0) (547.7)
Capital Increase 0.1 (2.0) 378.2 806.6
Payment of interest (78.0) (37.5) (181.0) (88.1)
Acquisition of subsidiaries (8.2) (0.8) (51.6) (39.5)
Others (2.8) (2.5) (16.4) (20.7)
Net Cash Flow from Financing activities (89.0) (42.8) 29.1 110.6
Exchange-rate change and cash equivalents (0.3) 4.4 (10.9) 12.5
Cash flow 285.2 132.3 (108.3) (115.0)
Cash balance in the beginning of the period 402.4 663.5 795.8 910.8
Cash balance in the end of the period 687.5 795.8 687.5 795.8
11
RESULTS 4Q22
outstanding debentures of the 5th issue for the reprofiling of these Debentures, in order to lengthen the
profile of its debt, and in the reduction of indebtedness, through the amortization of R$ 124 million upon
conclusion of the execution of amendments, to the respective Debenture deeds. The main terms and
conditions proposed are summarized in the summary table below.4
Current Amendment Proposed
4th Issue – serie 1 4th Issue – serie 2 5th Issue 4th and 5th Issue
Interest
Fee CDI + 6% p.a. CDI + 6.5% p.a. CDI + 5.75% p.a. CDI+5.5% p.a.
Premium - - -
3.6%, equivalent to the difference
between the rate above and
CDI+7% p.a., adjusted for PU
Interest
Payment
Semester Semester Quarter Semester
Grace period n.m. n.m. n.m. Up to may/24
Payments
Initial
Amortization
- - -
R$ 124 million
CVCB14: 20%
CVCB24: 10%
CVCB15: 10%
Debt
Amortization
04/18/2023
04/18/2024 06/01/2023 Nov/24: 10%
04/18/2025 04/07/2023 Nov/25: 45%
Nov/26: 45%
Due date 04/18/2023 04/18/2025 06/01/2023 Nov/26
Prepayment Yes Yes Yes prepayment prohibited
Convertibility
and future
capitalization
- - - See below
Others
Covenants Net Debt/Ebitda ≤3.5x Net Debt/Ebitda ≤3.5x Net Debt/Ebitda ≤3.5x
Dividend payout: 25%
Capex: R$ 125 mi/year
Net Debt/EBITDA
Dec/23: <=3.5x
Mar/25: <=3.0x
Mar/26: <=2.5x
Warraties - - -
13.3% of the outstanding balance
in credit card receivables
Negative Pledge - - - Assets > R$ 100 milion
Balance Dec/2022 R$ 388.0 R$ 211.7 R$ 297.3
Convertibility and future capitalization5
:
a. If the Company raises funds through a capital increase by 11/30/2023 in an amount equal to or
greater than R$125 million, the Company will undertake to carry out a tender offer of at least
R$75 million for the reprofiled Existing Debentures considered UP Par plus a 3% premium.
b. If the Company does not raise funds by means of a capital increase by 11/30/2023 in an amount
equal to or greater than R$125 million, the Company undertakes to approve a capital increase,
limited to R$ 200 million, in order to capitalize the Debentures, where the price per share will be
fixed considering the lowest price between: (i) R$3.50 per share; or (ii) an average discount of
4 It is recommended to read the Material Fact of 03/10/2023 in full, including the attached reprofiling term sheet, available on the Company's website and CVM
5 It is recommended to read the Material Fact of 03/10/2023 in full, including the attached reprofiling term sheet, available on the Company's website and CVM
12
RESULTS 4Q22
20% (twenty percent) on the average closing price of the 30 (thirty) calendar days immediately
preceding the date of approval of the capital increase by the Issuer.
With the completion of this reprofiling, Management believes that debt maturities will be better
balanced with its expected cash flow over the coming years, in such a way as not to compromise its capacity
for growth and investment in its operations. Additionally, the Company's gross debt is again reduced and
reaches the lowest level since dec/2017. Even though the current debt is consistent with the Company’s size
and current moment, it will continue to evaluate possibilities for further debt reductions, depending on how
market conditions evolve over the next few years.
The implementation of the reprofiling is subject to the agreement of these debenture holders in relation to
the final reprofiling documents, as well as their approval at the respective general meetings of debenture
holders, being the general meetings of the 4th
issue to be held on 04/06/20236
. If completed successfully,
the Company's debt will have the following amortization schedule:
Current schedule for amortization of debentures
R$ million
Proposed schedule for amortization of debentures
R$ million
6
For further information, access the Call Notice from 03/13/2023
13
RESULTS 4Q22
Annexes
Annex 1: Balance sheet (R$ million)
Asset 12/31/2022 12/31/2021 Liability 12/31/2022 12/31/2021
Current Assets Current Liabilities
Cash & Cash Equivalents 687.5 795.8 Debentures 693.7 218.6
Marketable securities 127.4 190.8 Financial Instruments 2.0 1.8
Derivative Instruments 1.1 - Suppliers 753.4 671.4
Accounts Receivable 515.5 1,092.9 Advanced of travel agreements 1,363.7 2,112.4
Advances to Suppliers 445.1 714.2 Salaries & Social Charges 145.8 138.3
Prepaid Expenses 39.6 37.5 Taxes and social contribution current 3.8 5.2
Recoverable Taxes 80.7 108.0 Taxes Payable and Contribution 66.5 65.8
Other Accounts Receivable 65.6 43.8 Accounts payable from acquisition of subsidiary and investees 22.8 31.5
Total Current Assets 1,962.4 2,982.9 Lease liabilities 16.7 12.8
Other 61.8 101.8
Total Current Liabilities 3,130.4 3,359.7
Non-Current Asset Non-Current Liabilities
Prepaid Expenses 23.6 25.8 Debentures 203.0 771.4
Taxes to recover 4.1 - Payable Tax Liabilities 21.2 43.2
Deferred Taxes 555.3 654.7 Provision for Legal Claims 94.8 243.7
Judicial Deposit 135.3 99.7 Accounts payable from acquisition of subsidiary and investees 90.1 97.1
Other 11.1 12.7 Liabilities of leasing 43.6 27.7
Investments 4.5 - Advanced of travel agreements 6.2 25.5
Fixed Assets 36.1 38.2 Other 11.9 13.6
Intangible Assets 1,130.4 1,108.1 Total Non-Current Liabilities 470.7 1,222.2
Right of Use Assets 54.6 34.9
Total Non-Current Assets 1,955.1 1,974.2 Shareholders’ Equity
Capital Stock 1,414.0 1,371.7
Capital Reserve 812.6 478.7
Goodwill on Capital Transaction (183.8) (183.8)
Other Comprehensive Income (loss) 61.7 63.3
Treasury shares (0.1) (0.1)
Retained earnings (1,787.9) (1,354.4)
Total Shareholders' Equity 316.5 375.3
Total Asset 3,917.6 4,957.2 Total Liabilities and Shareholders' Equity 3,917.6 4,957.2
14
RESULTS 4Q22
Attachment 2: Statement of income
Consolidated Brazil Argentina Consolidated Brazil Argentina
R$ million 4Q22 4Q21 4Q22 4Q21 4Q22 4Q21 2022 2021 2022 2021 2022 2021
Net Revenue 321.4 314.0 255.7 262.1 65.7 51.9 1,221.6 825.9 960.3 706.7 261.3 119.1
Sales expenses (41.4) (56.3) (25.4) (35.0) (16.0) (21.2) (194.9) (161.6) (138.2) (105.5) (56.6) (56.1)
Estimated loss by recoverable amount (20.7) (8.5) (20.3) (8.2) (0.4) (0.4) (48.4) 1.8 (47.7) 2.8 (0.7) (1.0)
General and administrative expenses (302.7) (315.4) (226.4) (262.5) (76.3) (52.9) (1,111.6) (1,009.5) (877.4) (829.0) (234.2) (180.6)
General and administrative expenses (249.3) (254.7) (188.8) (227.2) (60.5) (27.6) (908.4) (801.0) (735.2) (704.0) (173.2) (97.0)
Depreciation and amortization (53.4) (60.7) (37.6) (35.4) (15.8) (25.3) (203.2) (208.6) (142.2) (125.0) (61.0) (83.6)
Equity Pick up (0.3) - (0.3) - - - (0.9) - (0.9) - - -
Other operating income/expenses 73.0 (29.9) 36.5 (33.8) 36.5 3.8 96.7 (100.2) 43.8 (108.4) 52.8 8.2
Income (loss) before financial result 29.2 (96.1) 19.7 (77.4) 9.6 (18.8) (37.6) (443.6) (60.1) (333.4) 22.5 (110.3)
Financial income/expenses (111.6) (42.1) (110.8) (58.7) (0.8) 16.6 (309.5) (101.7) (292.5) (129.2) (17.0) 27.6
Income (loss) before taxes and social
contribution
(82.4) (138.2) (91.1) (136.1) 8.8 (2.1) (347.1) (545.3) (352.6) (462.6) 5.5 (82.7)
Tax and Social Contribution (14.4) (7.5) (14.2) (2.1) (0.2) (5.4) (86.4) 58.7 (85.2) 61.8 (1.1) (3.1)
Current (0.1) 0.8 (0.1) 0.8 (0.0) (0.1) (0.9) 0.6 (0.8) 0.8 (0.0) (0.2)
Deferred (14.3) (8.3) (14.1) (2.9) (0.2) (5.4) (85.5) 58.1 (84.4) 61.0 (1.1) (2.9)
Net Income (Loss) (96.8) (145.8) (105.3) (138.2) 8.6 (7.6) (433.4) (486.6) (437.8) (400.8) 4.4 (85.8)
Attributable to controlling shareholders (96.8) (147.2) (105.3) (138.2) 8.6 (9.0) (433.4) (476.3) (437.8) (401.4) 4.4 (74.9)
Attributable to non controlling shareholders - 1.5 - - - 1.5 - (10.3) - 0.6 - (10.9)
15
RESULTS 4Q22
Annex 3: Cash flow - Indirect method
R$ million 4Q22 4Q21 2022 2021
Loss before taxes and social contribution (82.4) (138.2) (347.1) (545.3)
Adjustments to reconcile income (loss) for the period with cash from operating
activities
96.4 69.5 478.7 261.0
Depreciation and amortization 53.4 60.7 203.2 208.6
Impairment loss of accounts receivable 20.7 8.6 48.4 (1.8)
Interest and inflation adjustments and exchange-rate changes 79.3 28.6 282.3 83.1
Equity Pickup 0.3 - 0.9 -
Provisions for lawsuits and administrative proceedings (63.7) (36.4) (76.4) (61.3)
Changes in fair value of the call option - (1.4) - (3.2)
Write-off of fixed assets, intangible and lease contracts – IFRS 16 7.2 5.8 17.8 16.2
Other provisions (0.8) 3.6 2.5 19.4
(Increase) / decrease in assets and liabilities 439.1 299.9 (13.3) 179.8
Trade accounts receivable 408.4 442.2 440.8 61.1
Advances to suppliers 231.8 41.8 267.7 117.0
Suppliers 104.3 114.4 92.7 170.0
Advanced travel agreements of tour packages (407.5) (295.6) (755.0) (24.4)
Variation of taxes to be recovered and collected 12.4 8.6 19.8 48.2
Settlement of derivative instruments (0.2) 1.4 (16.1) 0.5
Salaries and social charges (10.1) (5.9) 9.2 (8.5)
Income tax and social contribution paid (5.2) (0.4) (4.7) (2.0)
Provisions for lawsuits and administrative proceedings (30.4) 0.2 (32.9) (1.1)
Change in other assets 123.9 (33.4) 15.0 (179.3)
Change in other liabilites 11.7 26.7 (35.6) (1.7)
Net Cash Flow From Operations 453.0 231.2 118.3 (104.5)
Fixed Asset - Property, plant and equipment (1.6) (11.7) (16.2) (12.1)
Intangible assets (77.0) (49.6) (223.2) (121.5)
Acquisitions of subsidiaries 0.0 0.8 (5.4) -
Net Cash Flow invested in Investment activities - Capex (78.6) (60.5) (244.8) (133.6)
Raising of debentures and loans - - - 436.4
Settlement of debentures and loans - - (100.0) (984.1)
Capital Increase 0.1 (2.0) 378.2 806.6
Interest paid (78.0) (37.5) (181.0) (88.1)
Raising/Settlement of derivative instruments - - - (9.8)
Exercise of options with the sale of treasury shares - - - -
Acquisition of subsidiaries (8.2) (0.8) (51.6) (39.5)
Payment of lease - IFRS16 (2.8) (2.5) (16.4) (10.9)
Cash flow from Financing activities (89.0) (42.8) 29.1 110.6
Exchange-rate change and cash equivalents (0.3) 4.4 (10.9) 12.5
Increase (decrease) in cash and cash equivalents 285.2 132.3 (108.3) (115.0)
Cash balance in the beginning of the period 402.4 663.5 795.8 910.8
Cash balance in the end of the period 687.5 795.8 687.5 795.8
16
RESULTS 4Q22
Annex 4: Representativeness of means of payment in CVC Lazer’s Confirmed Bookings
Annex 5: Evolution of the store network
4Q22 3Q22 2Q22 1Q22 4Q21
Brazil 1,111 1,129 1,147 1,158 1,176
CVC 1,059 1,076 1,093 1,103 1,119
Own stores 14 16 16 13 12
New Layout 12 12 12 9 4
Franchises 1,045 1,060 1,077 1,090 1,107
New Layout 29 19 13 6 -
Experimento 52 53 54 55 57
Own stores 4 4 4 4 4
Franchises 48 49 50 51 53
Argentina 107 107 98 98 103
Almundo 107 107 98 98 103
Own stores 5 5 7 7 7
Franchises 102 102 91 91 96
Total CVC Corp 1,218 1,236 1,245 1,256 1,279
24% 23% 23% 25% 23%
55% 58% 60% 60% 68%
15% 11% 11% 8%
3%
6% 7% 6% 7%
6%
4Q21 1Q22 2Q22 3Q22 4Q22
Upfront Payment Credit Card Bank Slips CVC Risk
17
RESULTS 4Q22
Glossary
B2B: Business unit that has a complete solution for travel agents and their respective corporate customers. Made up of brands:
Esferatur, Trend Via, Visual Turismo, RexturAdvance, and VHC. For description of the brands see CVC Brazil.
B2C: Business unit focused on the end customer. Made up of brands: CVC, Experimento, Submarino. For description of brands see
CVC Brazil.
Bibam: Biblos and Avantrip brands.
Boarding agreements: Since the beginning of the pandemic, the Company has been offering to reschedule bookings and services
that were postponed or the grant of credit for use or discount in future purchases of other bookings or tourism services, according
to consumer's own convenience (the amount recorded is net of penalties or fines for cancellation). Pursuant to Explanatory Note 19
of the Company’s Financial Statement.
CVC Argentina: Largest travel agency in Argentina, made up of brands Almundo (travel and supplementary service agency), Avantrip
(travel and supplementary online platform), Biblos (agency focused on luxury and customized travels) and Ola Transatlantica (trip
product and service operator).
CVC Brazil:. Include brands CVC (travel and supplementary service agency, Top of Mind in Brazil for the 12th consecutive year),
Experimento (student exchange and supplementary service agency), Submarino Viagens (online portal for sale of airline tickets,
accommodation, tour packages, car rental and travel insurance), Esferatur (airline and hotel consolidator, also offering car rental),
Trend Viagens (hotel consolidator in Brazil and abroad, tour packages, car rental, among others), Visual Turismo (specialized in
customized travels, whether leisure, honeymoon, ecotourism, pilgrimage and religious, cruises or incentive), RexturAdvance (airline
consolidator for national and international flights) and VHC (house management and rental brand).
CVC Corp: Largest tourism agency in Latin America, with operations in Brazil and Argentina, made up of the brands CVC Brazil and
CVC Argentina, described above.
Financial Expense: Financial expenses mainly regarding the bank loans and fees on financial services, including interest expenses
regarding credit card advancements.
EBITDA (Earnings Before Interest, Taxes, Depreciation and Amortization): a non-accounting measure prepared by the Company in
line with CVM Instruction No. 527, of October 4, 2012 (“CVM Instruction 527"), reconciled with its financial statements and consisting
of net profit before the net financial result, excluding the depreciations, amortizations and equity pick up results.
Adjusted EBITDA: as demonstrated in this document, is based on the EBITDA, excluding the non-recurring effects of the period and
including expenses incurred with the issuance of bank slips (recorded in the Financial Expenses line item). It can also be calculated
based on the Net Profit, plus the Net Financial Result, Income Tax and social contribution, and Expenses with depreciation,
amortization and equity pick up results, net of the amounts referring to the bank slip fee – Financial and non-recurring expenses.
The adjusted EBITDA is not an accounting measure used in the accounting practices adopted in Brazil or the IFRS, and shall not be
considered as an alternative to the net profit as an indicator of the operating performance or as an alternative to the cash flow as
an indicator of liquidity. Our definition of adjusted EBITDA cannot be compared to adjusted EBITDA as defined by other companies.
Non-recurring: The non-recurring effects recorded include basically (i) Impacts regarding COVID-19 (impacts due to the pandemic,
which include commissions of stores not recovered by reimbursement, fines, write-off of non-realized revenues and other expenses
not related to bookings); (ii) impairment of intangible assets; (iii) contingent liabilities; among others.
Net Revenue: the result of intermediation revenues minus the cost of services rendered and taxes on sales, and usually referred as
such in the sector. These metrics are reported as Gross Profit in the Financial Statements.
Bookings: result of new sales and rescheduling, net of cancellations in the period.
Consumed Bookings: Bookings that support the Net Revenue, including online, according to revenue recognition criteria of each
brand, namely: CVC in Check-in; Experimento in Check-in; Submarino Viagens airline ticket sale and land + exclusive flights/products
(known as charter) in Check-in; RexturAdvance airline ticket sale and land in Check-in; Esferatur in sale; Trend in Check-in; Visual in
Check-in and VHC in checkouts carried out.
Consumed Bookings Argentina: Bookings for Biblos + Consumed Bookings for Ola Transatlantica.
Take rate: significant metrics used in the sector, resulting from the division of net revenue by the Consumed Bookings.

Mais conteúdo relacionado

Semelhante a 023310000101011 (2).pdf

Semelhante a 023310000101011 (2).pdf (20)

025860000101011 (5).pdf
025860000101011 (5).pdf025860000101011 (5).pdf
025860000101011 (5).pdf
 
meliuz 4T22
meliuz 4T22meliuz 4T22
meliuz 4T22
 
alpargatas 4t22
alpargatas 4t22alpargatas 4t22
alpargatas 4t22
 
Via - 3t22
Via - 3t22Via - 3t22
Via - 3t22
 
025011000101011 (2).pdf
025011000101011 (2).pdf025011000101011 (2).pdf
025011000101011 (2).pdf
 
023795000101011.pdf
023795000101011.pdf023795000101011.pdf
023795000101011.pdf
 
024910000101011 (1)
024910000101011 (1)024910000101011 (1)
024910000101011 (1)
 
Americanas - 3T22
Americanas - 3T22Americanas - 3T22
Americanas - 3T22
 
Resultado do 3° trimestre da Via Varejo
Resultado do 3° trimestre da Via VarejoResultado do 3° trimestre da Via Varejo
Resultado do 3° trimestre da Via Varejo
 
000906000101011.pdf
000906000101011.pdf000906000101011.pdf
000906000101011.pdf
 
071bcbdb-4247-4efe-93f6-2fa6e21f9fdb_Apresentação Institucional_3T19.pdf
071bcbdb-4247-4efe-93f6-2fa6e21f9fdb_Apresentação Institucional_3T19.pdf071bcbdb-4247-4efe-93f6-2fa6e21f9fdb_Apresentação Institucional_3T19.pdf
071bcbdb-4247-4efe-93f6-2fa6e21f9fdb_Apresentação Institucional_3T19.pdf
 
via 2t23
via 2t23via 2t23
via 2t23
 
020362000101011 (1)
020362000101011 (1)020362000101011 (1)
020362000101011 (1)
 
BI&P- Indusval- Divulgação de Resultados 4T14
BI&P- Indusval- Divulgação de Resultados 4T14BI&P- Indusval- Divulgação de Resultados 4T14
BI&P- Indusval- Divulgação de Resultados 4T14
 
008087000101011 (2)
008087000101011 (2)008087000101011 (2)
008087000101011 (2)
 
017973000101011 (1).pdf
017973000101011 (1).pdf017973000101011 (1).pdf
017973000101011 (1).pdf
 
Carteira empresasamericanas
Carteira empresasamericanasCarteira empresasamericanas
Carteira empresasamericanas
 
015539000101011.pdf
015539000101011.pdf015539000101011.pdf
015539000101011.pdf
 
025259000101011 (1)
025259000101011 (1)025259000101011 (1)
025259000101011 (1)
 
009512000101011 (4).pdf
009512000101011 (4).pdf009512000101011 (4).pdf
009512000101011 (4).pdf
 

Mais de Renandantas16

0183760ssssssssssssssssssssssssssss00101011 (27).pdf
0183760ssssssssssssssssssssssssssss00101011 (27).pdf0183760ssssssssssssssssssssssssssss00101011 (27).pdf
0183760ssssssssssssssssssssssssssss00101011 (27).pdfRenandantas16
 
004170000101011 ddddddddddddddddddd(19).pdf
004170000101011 ddddddddddddddddddd(19).pdf004170000101011 ddddddddddddddddddd(19).pdf
004170000101011 ddddddddddddddddddd(19).pdfRenandantas16
 
020087000101011 (18).pdfddddddddddddddddddddddddddddddddd
020087000101011 (18).pdfddddddddddddddddddddddddddddddddd020087000101011 (18).pdfddddddddddddddddddddddddddddddddd
020087000101011 (18).pdfdddddddddddddddddddddddddddddddddRenandantas16
 
004170000101011 (1DDDDDDDDDDDDDDDDDDDDDDDDDDDDD8).pdf
004170000101011 (1DDDDDDDDDDDDDDDDDDDDDDDDDDDDD8).pdf004170000101011 (1DDDDDDDDDDDDDDDDDDDDDDDDDDDDD8).pdf
004170000101011 (1DDDDDDDDDDDDDDDDDDDDDDDDDDDDD8).pdfRenandantas16
 
021490000101011 (14).pdfcccccccccccccccccccccccccccccccc
021490000101011 (14).pdfcccccccccccccccccccccccccccccccc021490000101011 (14).pdfcccccccccccccccccccccccccccccccc
021490000101011 (14).pdfccccccccccccccccccccccccccccccccRenandantas16
 
vvvvvvvvvvvvvvvvvvvvvvvvvvvvvvvvvvvvvvvvvvvvvvvvvvvvvvvv
vvvvvvvvvvvvvvvvvvvvvvvvvvvvvvvvvvvvvvvvvvvvvvvvvvvvvvvvvvvvvvvvvvvvvvvvvvvvvvvvvvvvvvvvvvvvvvvvvvvvvvvvvvvvvvvv
vvvvvvvvvvvvvvvvvvvvvvvvvvvvvvvvvvvvvvvvvvvvvvvvvvvvvvvvRenandantas16
 
01837600010fffffffffffffffffffffffffffff1011 (24).pdf
01837600010fffffffffffffffffffffffffffff1011 (24).pdf01837600010fffffffffffffffffffffffffffff1011 (24).pdf
01837600010fffffffffffffffffffffffffffff1011 (24).pdfRenandantas16
 
020575000101011 (4).pdf
020575000101011 (4).pdf020575000101011 (4).pdf
020575000101011 (4).pdfRenandantas16
 
025038000101011 (4).pdf
025038000101011 (4).pdf025038000101011 (4).pdf
025038000101011 (4).pdfRenandantas16
 
025100000101011 (3).pdf
025100000101011 (3).pdf025100000101011 (3).pdf
025100000101011 (3).pdfRenandantas16
 
Ed_1_Petrobras_PSP_23_2_abertura.pdf
Ed_1_Petrobras_PSP_23_2_abertura.pdfEd_1_Petrobras_PSP_23_2_abertura.pdf
Ed_1_Petrobras_PSP_23_2_abertura.pdfRenandantas16
 
020257000101011 (15).pdf
020257000101011 (15).pdf020257000101011 (15).pdf
020257000101011 (15).pdfRenandantas16
 
020087000101011 (13).pdf
020087000101011 (13).pdf020087000101011 (13).pdf
020087000101011 (13).pdfRenandantas16
 

Mais de Renandantas16 (20)

0183760ssssssssssssssssssssssssssss00101011 (27).pdf
0183760ssssssssssssssssssssssssssss00101011 (27).pdf0183760ssssssssssssssssssssssssssss00101011 (27).pdf
0183760ssssssssssssssssssssssssssss00101011 (27).pdf
 
004170000101011 ddddddddddddddddddd(19).pdf
004170000101011 ddddddddddddddddddd(19).pdf004170000101011 ddddddddddddddddddd(19).pdf
004170000101011 ddddddddddddddddddd(19).pdf
 
020087000101011 (18).pdfddddddddddddddddddddddddddddddddd
020087000101011 (18).pdfddddddddddddddddddddddddddddddddd020087000101011 (18).pdfddddddddddddddddddddddddddddddddd
020087000101011 (18).pdfddddddddddddddddddddddddddddddddd
 
004170000101011 (1DDDDDDDDDDDDDDDDDDDDDDDDDDDDD8).pdf
004170000101011 (1DDDDDDDDDDDDDDDDDDDDDDDDDDDDD8).pdf004170000101011 (1DDDDDDDDDDDDDDDDDDDDDDDDDDDDD8).pdf
004170000101011 (1DDDDDDDDDDDDDDDDDDDDDDDDDDDDD8).pdf
 
021490000101011 (14).pdfcccccccccccccccccccccccccccccccc
021490000101011 (14).pdfcccccccccccccccccccccccccccccccc021490000101011 (14).pdfcccccccccccccccccccccccccccccccc
021490000101011 (14).pdfcccccccccccccccccccccccccccccccc
 
vvvvvvvvvvvvvvvvvvvvvvvvvvvvvvvvvvvvvvvvvvvvvvvvvvvvvvvv
vvvvvvvvvvvvvvvvvvvvvvvvvvvvvvvvvvvvvvvvvvvvvvvvvvvvvvvvvvvvvvvvvvvvvvvvvvvvvvvvvvvvvvvvvvvvvvvvvvvvvvvvvvvvvvvv
vvvvvvvvvvvvvvvvvvvvvvvvvvvvvvvvvvvvvvvvvvvvvvvvvvvvvvvv
 
01837600010fffffffffffffffffffffffffffff1011 (24).pdf
01837600010fffffffffffffffffffffffffffff1011 (24).pdf01837600010fffffffffffffffffffffffffffff1011 (24).pdf
01837600010fffffffffffffffffffffffffffff1011 (24).pdf
 
020575000101011 (4).pdf
020575000101011 (4).pdf020575000101011 (4).pdf
020575000101011 (4).pdf
 
025038000101011 (4).pdf
025038000101011 (4).pdf025038000101011 (4).pdf
025038000101011 (4).pdf
 
021130000101011.pdf
021130000101011.pdf021130000101011.pdf
021130000101011.pdf
 
025100000101011 (3).pdf
025100000101011 (3).pdf025100000101011 (3).pdf
025100000101011 (3).pdf
 
Helbor.pdf
Helbor.pdfHelbor.pdf
Helbor.pdf
 
Direcional.pdf
Direcional.pdfDirecional.pdf
Direcional.pdf
 
b3.pdf
b3.pdfb3.pdf
b3.pdf
 
Cogna.pdf
Cogna.pdfCogna.pdf
Cogna.pdf
 
Ed_1_Petrobras_PSP_23_2_abertura.pdf
Ed_1_Petrobras_PSP_23_2_abertura.pdfEd_1_Petrobras_PSP_23_2_abertura.pdf
Ed_1_Petrobras_PSP_23_2_abertura.pdf
 
020257000101011 (15).pdf
020257000101011 (15).pdf020257000101011 (15).pdf
020257000101011 (15).pdf
 
020087000101011 (13).pdf
020087000101011 (13).pdf020087000101011 (13).pdf
020087000101011 (13).pdf
 
JSL.pdf
JSL.pdfJSL.pdf
JSL.pdf
 
025658000101012.pdf
025658000101012.pdf025658000101012.pdf
025658000101012.pdf
 

023310000101011 (2).pdf

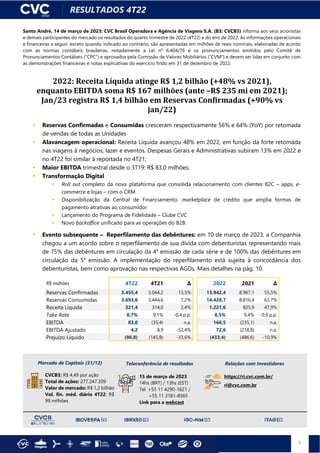
  • 1. 1 RESULTADOS 4T22 Santo André, 14 de março de 2023: CVC Brasil Operadora e Agência de Viagens S.A. (B3: CVCB3) informa aos seus acionistas e demais participantes do mercado os resultados do quarto trimestre de 2022 (4T22) e do ano de 2022. As informações operacionais e financeiras a seguir, exceto quando indicado ao contrário, são apresentadas em milhões de reais nominais, elaboradas de acordo com as normas contábeis brasileiras, notadamente a Lei nº 6.404/76 e os pronunciamentos emitidos pelo Comitê de Pronunciamentos Contábeis (“CPC”) e aprovados pela Comissão de Valores Mobiliários (“CVM”) e devem ser lidas em conjunto com as demonstrações financeiras e notas explicativas do exercício findo em 31 de dezembro de 2022. 2022: Receita Líquida atinge R$ 1,2 bilhão (+48% vs 2021), enquanto EBITDA soma R$ 167 milhões (ante –R$ 235 mi em 2021); Jan/23 registra R$ 1,4 bilhão em Reservas Confirmadas (+90% vs jan/22)  Reservas Confirmadas e Consumidas cresceram respectivamente 56% e 64% (YoY) por retomada de vendas de todas as Unidades  Alavancagem operacional: Receita Líquida avançou 48% em 2022, em função da forte retomada nas viagens à negócios, lazer e eventos. Despesas Gerais e Administrativas subiram 13% em 2022 e no 4T22 foi similar à reportada no 4T21;  Maior EBITDA trimestral desde o 3T19: R$ 83,0 milhões;  Transformação Digital  Roll out completo da nova plataforma que consolida relacionamento com clientes B2C – apps, e- commerce e lojas – com o CRM  Disponibilização da Central de Financiamento, marketplace de crédito que amplia formas de pagamento atrativas ao consumidor  Lançamento do Programa de Fidelidade – Clube CVC  Novo backoffice unificado para as operações do B2B.  Evento subsequente – Reperfilamento das debêntures: em 10 de março de 2023, a Companhia chegou a um acordo sobre o reperfilamento de sua dívida com debenturistas representando mais de 75% das debêntures em circulação da 4a emissão de cada série e de 100% das debêntures em circulação da 5a emissão. A implementação do reperfilamento está sujeita à concordância dos debenturistas, bem como aprovação nas respectivas AGDs. Mais detalhes na pág. 10. R$ milhões 4T22 4T21 ∆ 2022 2021 ∆ Reservas Confirmadas 3.455,4 3.044,2 13,5% 13.942,4 8.967,1 55,5% Reservas Consumidas 3.693,6 3.444,6 7,2% 14.428,7 8.816,4 63,7% Receita Líquida 321,4 314,0 2,4% 1.221,6 825,9 47,9% Take Rate 8,7% 9,1% -0,4 p.p. 8,5% 9,4% -0,9 p.p. EBITDA 83,0 (35,4) n.a. 166,5 (235,1) n.a. EBITDA Ajustado 4,2 8,9 -52,4% 72,6 (218,8) n.a. Prejuízo Líquido (96,8) (145,8) -33,6% (433,4) (486,6) -10,9% Mercado de Capitais (31/12) CVCB3: R$ 4,49 por ação Total de ações: 277.247.309 Valor de mercado: R$ 1,2 bilhão Vol. fin. méd. diário 4T22: R$ 99 milhões Teleconferência de resultados 15 de março de 2023 14hs (BRT) / 13hs (EST) Tel. +55 11 4290-1621 / +55 11 3181-8565 Link para a webcast Relações com Investidores https://ri.cvc.com.br/ ri@cvc.com.br
  • 2. 2 RESULTADOS 4T22 Mensagem da Administração O ano de 2022 foi um marco na trajetória da CVC Corp no que tange à Transformação Digital e o desenvolvimento da ominicalidade, com entregas relevantes, tais como novo sistema de frente de lojas e interação com clientes no B2C, Programa de Fidelidade (intitulado Clube CVC), Central de Financiamento (ou Marketplace de Crédito) e sistema de precificação dinâmica de produtos. Estas entregas nos permitem buscar novos patamares de eficiência e possibilitarão usufruir de uma maior eficiência de operação e, consequentemente, alavancagem operacional. Adicionalmente, vale destacar a evolução do nosso CRM, que já supera 34 milhões de clientes contatáveis, criando assim, sustentação para uma jornada de relacionamento através de campanhas direcionadas e que contribuirão no aumento da conversão e fidelização dos clientes, nosso CRM já está integrado com a nova plataforma do B2C e com todos os canais de venda (website, loja e app). Foram mais de R$ 400 milhões investidos em tecnologia desde 2020, dos quais mais de R$ 240 milhões somente em 2022, recorde absoluto da companhia e que encerra um ciclo mais acelerado de desenvolvimento de ferramentas. Por tudo o que foi feito ao longo de 2022, a CVC conquistou, pelo 12º ano consecutivo, o prêmio Top of Mind na categoria “Agência de Turismo” e estreou em destaque na nova categoria “Aplicativo de Turismo”. Em linha com a estratégia de digitalização, lançamos, há poucas semanas, o ConecTaaS, uma nova plataforma para integração de APIs, que aumenta a conectividade e facilita o acesso das agências para venda de produtos. A plataforma é plug and play e funciona como uma vitrine de produtos. Com o objetivo de ampliar os meios de pagamento e conveniência para nossos clientes, recentemente passamos a permitir a utilização de pontos Livelo, que podem ser utilizados para cobrir o valor total ou parcial da compra de produtos de viagens. Esta novidade já está disponível em toda a rede CVC e todos os clientes Livelo podem usufruir desse novo benefício em todas as lojas físicas da CVC. Possuímos uma parceria de longa data com a Livelo, desde 2016, quando nos tornamos fornecedores de produtos relativos ao setor de turismo, através do site oficial do programa de recompensas da empresa. Em relação aos resultados, ao longo de 2022, as reservas e nosso resultado progrediram, demonstrando a recuperação do mercado e capacidade de execução da Companhia. As reservas confirmadas e consumidas apresentaram crescimento tanto no Brasil quanto na Argentina, e consequentemente crescimento da receita líquida entre períodos. Nossas entregas, sejam de resultados ou de aperfeiçoamento da nossa operação, se alinham a nossos valores, em especial o Honramos nossos Compromissos (correspondente a letra “H”, do nosso SONHO). Ao longo de 2022, nos empenhamos em apoiar nossos clientes no uso dos créditos de viagens oriundos das restrições impostas pela pandemia. Esse montante reduziu 62% em relação ao saldo final de 2021 (de R$ 761 milhões para R$ 293 milhões). Nós também avançamos na frente de eficiência operacional, que resultou em melhor controle de despesas. No início do 4T22 iniciamos processo de reavaliação de estruturas, racionalização de fornecedores, além de uma grande revisão de processos internos. Este processo se estenderá ao longo de 2023 e terá auxílio de consultoria externa, focando principalmente na revisão de atividades operacionais. Diante da forte recuperação das vendas de 2022 e dos prognósticos de crescimento dos próximos anos, temos avaliado constantemente nossa estrutura de capital. Em junho último foi homologada Oferta de Ações de R$ 403 milhões e nos encontramos, neste momento, em tratativas finais para reperfilamento da nossa dívida. Contratamos assessor para nos auxiliar e este mês divulgamos ao mercado proposta de reperfilamento de toda nossa dívida, cuja ampla aceitação nos indica que estamos no caminho certo, construindo uma companhia mais sólida e rentável, com apoio de acionistas e debenturistas. Quando concluído, A CVC Corp terá seu menor nível de dívida bruta desde 2017. Iniciamos 2023 com o melhor janeiro em vendas desde o início da pandemia, com todas as áreas da empresa focadas em trazer as melhores ofertas de produtos, serviços, e condições de pagamento para nosso público. Isso tudo está sendo feito amparado numa estrutura de TI renovada e robusta, com melhor experiência para o cliente, e capaz de suportar o aumento de demanda. Acreditamos que essas bases nos permitirão, ao longo do ano, aproveitar oportunidades no mercado e, assim, reportar crescimento de vendas e evolução na nossa rentabilidade.
  • 3. 3 RESULTADOS 4T22 Resultado CVC Corp Reservas Confirmadas e Reservas Consumidas R$ milhões 4T22 4T21 ∆ 2022 2021 ∆ Reservas Confirmadas 3.455,4 3.044,2 13,5% 13.942,4 8.967,1 55,5% Brasil 2.502,9 2.229,5 12,3% 10.274,6 7.455,4 37,8% B2C 1.164,6 1.051,0 10,8% 4.557,2 3.781,9 20,5% B2B 1.338,2 1.178,5 13,6% 5.717,4 3.673,6 55,6% Argentina 952,5 814,7 16,9% 3.667,8 1.511,6 142,6% Reservas Consumidas 3.693,6 3.444,6 7,2% 14.428,7 8.816,4 63,7% Brasil 2.741,0 2.630,0 4,2% 10.760,9 7.304,8 47,3% B2C 1.322,3 1.393,6 -5,1% 4.995,5 3.563,9 40,2% B2B 1.418,7 1.236,4 14,7% 5.765,3 3.740,9 54,1% Argentina 952,5 814,7 16,9% 3.667,8 1.511,6 142,6% As Reservas Confirmadas apresentaram no 4T22 aumento de 13,5% em comparação ao 4T21, sendo a procura por destinos internacionais (aumento de 42% no Brasil e de 71% na Argentina frente ao 4T21) beneficiada por maior disponibilidade da malha aérea e frequência de voos. Além disso, as reservas do 4T22, no Brasil, foram influenciadas positivamente pela Black Friday, que apresentou crescimento em relação ao evento de 2021, porém afetadas adversamente pela Copa do Mundo, especialmente no B2B, e pela troca de plataforma do B2C, que apesar de bem-sucedida ao não trazer transtornos aos clientes, impactou momentaneamente operação de loja no período. Vale destacar que a nova plataforma do B2C permite maior integração dos canais físico e digital, e também uma abordagem customizada para clientes em ofertas, compras e atendimento. Destaca-se o desempenho relacionado à temporada de cruzeiros 22/23, com aumento de mais de 200% frente ao 4T21, dada expansão de oferta daquela que está prevista para ser a maior temporada brasileira de cruzeiros marítimos dos últimos 10 anos1 . Em janeiro/23, as vendas de produto marítimo representaram 20% das reservas da unidade de negócio B2C, sendo que mais de 25% dos passageiros embarcados no território brasileiro nesse mês foram clientes da CVC Corp. As reservas confirmadas consolidadas em janeiro/23 totalizaram cerca de R$ 1,4 bilhão. As Reservas Confirmadas na CVC Corp para destinos internacionais, seguiu em alta e representaram 53% das reservas confirmadas no período (39% no 4T21). Abaixo detalhamos a abertura por destinos no Brasil e Argentina: 1 Fonte: https://abremar.com.br/guia-clia-brasil/
  • 4. 4 RESULTADOS 4T22 4T22 4T21 Brasil Argentina No B2C, as Reservas Consumidas diminuíram frente ao 4T21 onde, naquele trimestre, houve forte retomada do turismo local, reflexo da demanda reprimida pós reabertura para viagens, vacinação avançada e também por maior presença de feriados longos. No B2B, as Reservas Consumidas cresceram 14,7% frente ao 4T21, fruto da retomada de eventos corporativos e viagens a negócios verificada ao longo dos últimos três trimestres. Na Argentina, as Reservas Consumidas seguiram crescentes, principalmente, para destinos internacionais, sendo a Almundo com maior representatividade destas reservas, impulsionada pela Copa do Mundo de Futebol. Desde o início da reabertura de diversos destinos, a Companhia se empenhou em auxiliar seus clientes no uso dos créditos de viagens oriundos dos reagendamentos decorrentes das restrições impostas pela pandemia de COVID-19. Esses montantes foram reduzidos significativamente ao longo de 2022, totalizando saldo de R$ 292,7 milhões ao final de 2022, redução de R$ 468,5 milhões (ou 62%) frente ao fechamento do 4T21 atingindo, dessa forma, ao final de 2022, patamares mais normalizados considerada a operação usual da companhia. Cabe lembrar, ainda, que a Lei 14.390/222 , publicada em 04 de julho de 2022, estendeu até 31 de dezembro de 2023 prazos de remarcação e de utilização de créditos disponibilizados para hotéis e outros serviços terrestres. 3 Texto completo disponível em http://www.planalto.gov.br/ccivil_03/_ato2019-2022/2022/lei/L14390.htm 61% 39% 69% 31% 10% 90% 39% 61%
  • 5. 5 RESULTADOS 4T22 Receita Líquida R$ milhões 4T22 4T21 ∆ 2022 2021 ∆ Receita Líquida 321,4 314,0 2,4% 1.221,6 825,9 47,9% Brasil 255,7 262,1 -2,5% 960,3 706,7 35,9% B2C 167,1 183,9 -9,1% 637,7 451,4 41,3% B2B 88,6 78,3 13,2% 322,6 255,3 26,4% Argentina 65,7 51,9 26,6% 261,3 119,1 119,3% Take Rate 8,7% 9,1% -0,4 p.p. 8,5% 9,4% -0,9 p.p. Brasil 9,3% 10,0% -0,7 p.p. 8,9% 9,7% -0,8 p.p. B2C 12,6% 13,2% -0,6 p.p. 12,8% 12,7% 0,1 p.p. B2B 6,2% 6,3% -0,1 p.p. 5,6% 6,8% -1,2 p.p. Argentina 6,9% 6,4% 0,5 p.p. 7,1% 7,9% -0,8 p.p. A Receita Líquida em 2022 cresceu 47,9% frente a 2021, reflexo do desempenho nas Reservas Consumidas, contribuindo para a melhora dos resultados operacionais. No 4T22, a Receita Líquida foi similar ao mesmo período do ano passado, com o crescimento das Reservas parcialmente contraposto, por retração no take rate, em virtude do mix de negócios e de produtos, como o aumento das vendas de produto marítimo e menor ocupação em produtos exclusivos em certas localidades. O Take Rate alcançou 8,7% no 4T22, refletindo o forte crescimento do produto marítimo, que apesar de possuir menor take rate nominal, quando comparado a outros produtos, não requer capital de giro. Importante relembrar que o 4T21 foi sustentado pelo aumento de viagens, sobretudo domésticas, devido à maior disponibilidade de voos e a demanda reprimida, favorecendo momentaneamente o take rate. Desta forma, o take rate do 4T22 foi 0,4 p.p. inferior ao reportado no 4T21. A temporada de cruzeiros 22/23 ocorre entre outubro/22 a maio/23 e, segundo dados da Abremar, conforme mencionado anteriormente, deverá ser a maior dos últimos anos. O Take Rate da Argentina atingiu 6,9% no 4T22, superior em 0,5 p.p. frente ao 4T21, impulsionado pela Ola. Vale mencionar que houve aumento de impostos sobre viagens internacionais, que foram adicionados ao valor das reservas consumidas, porém sem impactos na Receita Líquida, desta forma diluindo o take rate. Em 28 de fevereiro, o Senado Federal aprovou, sem alterações, a conversão da Medida Provisória 1.138/2022 na Lei 14.537/2023, que estabeleceu a redução da alíquota nominal de 25% para 6% do Imposto sobre a Renda Retido na Fonte (IRRF) incidente sobre as remessas ao exterior relativas a gastos pessoais em viagens de turismo, negócios, serviços, treinamento ou missões oficiais entre jan/23 e dez/24, incrementando-se em 1% ao ano até 2027 (9%). Esta redução tem como objetivo estimular o turismo, buscando dar mais competitividade para agências e operadoras de turismo, que foi um dos setores mais afetados pela pandemia de COVID-19, sendo a CVC Corp beneficiária desta medida.
  • 6. 6 RESULTADOS 4T22 Despesas R$ milhões 4T22 4T21 ∆ 2022 2021 ∆ Despesas Gerais e Administrativas (249,3) (254,7) -2,1% (908,4) (801,0) 13,4% Despesas de Vendas (62,1) (64,8) -4,2% (243,3) (159,8) 52,2% Outras Receitas/Despesas Operacionais 73,0 (29,9) n.a. 96,7 (100,2) n.a. Subtotal Despesas Operacionais (238,4) (349,5) -31,8% (1.055,1) (1.060,9) -0,6% (-) Itens não recorrentes 75,6 (53,4) n.a. 74,6 (46,1) n.a. Subtotal Despesas Operacionais Recorrentes (314,0) (296,1) 6,0% (1.129,5) (1.014,8) 11,3% (+) Taxa de Serviços - Fee Boleto (3,2) (9,1) -65,3% (19,3) (29,8) -35,3% EBITDA Ajustado 4,2 8,9 -52,4% 72,6 (218,8) n.a. As Despesas Gerais e Administrativas ficaram praticamente em linha quando comparadas às do 4T21 pela racionalização e maior controle de despesas fixas, apesar dos impactos negativos dos acordos sindicais (reajuste de 5,82%, a partir de novembro de 2022 no Brasil e de cerca de 65% na moeda local da Argentina nos últimos 12 meses). No acumulado do ano, o fortalecimento de algumas áreas, como Operações e TI, contribuíram para o aumento de 13,4% nesta rubrica, além dos efeitos, ao longo do ano, de reajuste salarial no Brasil de 10% ocorrido em novembro de 2021. No 4T22 foi iniciado um programa formal de aumento de eficiência, focando na racionalização de estruturas e processos, com consequente redução de despesas. Dado os investimentos feitos em automação ao longo dos últimos anos, foram feitos ajustes na estrutura gerencial da CVC Corp, parte realizada no 4T22 e parte em janeiro/23. Este programa de eficiência seguirá ao longo de 2023, focado principalmente em processos/atividades operacionais. As Outras Receitas/Despesas Operacionais registraram valor positivo de R$ 73,0 milhões composto principalmente por (i) reversão de provisões para riscos provenientes de aquisições passadas, que não se materializaram, (ii) receitas provenientes de incentivos de distribuidores de bilhetes aéreos e parcialmente compensados por (iii) despesas com reembolsos e cancelamentos. No 4T21, esta rubrica havia registrado montante negativo em decorrência, principalmente, de despesas incorridas pela descontinuação das operações da Companhia Aérea ITA. Em 2022 esta rubrica registou o valor positivo de R$ 96,7 milhões, principalmente pelos efeitos citados do 4T22, em especial incentivos de distribuidores de bilhetes aéreos, fruto da recuperação das Reservas Confirmadas ao longo do ano, que cresceram 55,5% ante 2021. As Despesas não recorrentes no 4T22 totalizaram valor positivo de R$ 75,6 milhões, montante composto majoritariamente pela reversão de provisões (vide item “i” de Outras Receitas/ Despesas Operacionais). R$ milhões 4T22 4T21 ∆ 2022 2021 ∆ Despesas de Vendas (62,1) (64,8) -4,2% (243,3) (159,8) 52,2% Brasil (45,8) (43,2) 6,0% (185,9) (102,7) 81,0% como % das Reservas Consumidas 1,7% 1,6% 0,1 p.p. 1,7% 1,4% 0,3 p.p. Provisão para perda - PCLD (20,3) (8,2) n.a. (47,7) 2,8 n.a. Marketing (9,4) (17,1) -45,2% (66,7) (54,8) 21,6% Custo do Cartão de Crédito (16,1) (17,9) -10,5% (71,5) (50,7) 41,1% Argentina (16,3) (21,6) -24,6% (57,4) (57,1) 0,6% como % das Reservas Consumidas 1,7% 2,7% -1,0 p.p. 1,6% 3,8% -2,2 p.p.
  • 7. 7 RESULTADOS 4T22 No 4T22, as Despesas de Vendas da CVC Corp reduziram 4,2% em comparação ao 4T21 enquanto que no acumulado do ano cresceram 52,2%, reflexo do aumento das Reservas Consumidas na Argentina (+143%) e no Brasil (+47%). No Brasil, houve diferente calendarização das despesas de marketing ao longo dos trimestres, fruto da necessidade do negócio e ambiente do setor de turismo, estando o crescimento da rubrica, em 2022, similar ao crescimento das Reservas Confirmadas do B2C (20,5% nas Reservas e 21,6% nas Despesas de Marketing), lembrando que em 2022 celebramos 50 anos da CVC e tivemos ações de marketing ligadas a isso. Em 2022 as Despesas com Cartão de Crédito no Brasil tiveram crescimento inferior ao das Reservas Consumidas (+47,3%), fruto das oscilações usuais no mix de recebimento ao longo do ano. Adicionalmente, no 4T22, houve efeito do aumento de reservas consumidas do produto marítimo, no qual o pagamento é processado diretamente na armadora, sendo a CVC Corp apenas comissionada por este serviço. Ao longo do ano, houve menor representatividade do uso de boletos, principalmente em virtude da implantação da central de financiamentos (Marketplace de Crédito). Por fim, a PCLD acumulada do ano de 2022 retrata o crescimento das operações ocorrida no ano, que segue com regras conservadoras na concessão de crédito, bem como observa-se que em 2021 essa rubrica apresentou valor positivo em virtude de alto volume de reversões de provisões constituídas no ano de 2020, por ocasião da pandemia. Na operação argentina, houve redução nas despesas de vendas, quando comparadas com o 4T21, por (i) redução das despesas associadas ao processamento de pagamentos por cartão de crédito, dada restrição imposta pelo governo na forma de parcelamento de viagens internacionais na operação de varejo (sobretudo Almundo), acarretando mais pagamentos à vista e (ii) menores despesas com marketing, assim como no Brasil, em função da calendarização destas despesas ao longo dos trimestres. Na comparação anual as despesas com vendas permaneceram estáveis. EBITDA R$ milhões 4T22 4T21 ∆ 2022 2021 ∆ EBITDA Ajustado 4,2 8,9 -52,4% 72,6 (218,8) n.a. (+) Itens Não Recorrentes 75,6 (53,4) n.a. 74,6 (46,1) n.a. (-) Taxa de Serviços - Fee Boleto (3,2) (9,1) -65,3% (19,3) (29,8) -35,3% EBITDA 83,0 (35,4) n.a. 166,5 (235,1) n.a. (+) Depreciação e amortização (53,4) (60,7) -12,0% (203,2) (208,6) -2,6% (+) Equivalência Patrimonial (0,3) - n.a. (0,9) - n.a. (+) Resultado Financeiro (111,6) (42,1) 165,1% (309,5) (101,7) n.a. Prejuízo antes de IR e CS (82,4) (138,2) -40,4% (347,1) (545,3) -36,4% (+) IR e CS (14,4) (7,5) 92,1% (86,4) 58,7 n.a. Prejuízo Líquido (96,8) (145,8) -33,6% (433,4) (486,6) -10,9% No 4T22, A CVC Corp registrou EBITDA de R$ 83,0 milhões, frente ao resultado negativo de R$ 35,4 milhões no 4T21, influenciado principalmente pelo controle das Despesas Operacionais e também pelo resultado positivo das Outras Receitas/Despesas Operacionais, conforme descrito acima; enquanto que o EBITDA do ano alcançou R$ 166,5 milhões, R$ 401,6 milhões superior ao registrado em 2021.
  • 8. 8 RESULTADOS 4T22 Resultado Financeiro R$ milhões 4T22 4T21 ∆ 2022 2021 ∆ Despesas Financeiras (117,4) (81,1) 44,7% (375,5) (205,7) 82,5% Encargos Financeiros (53,9) (35,3) 52,7% (198,1) (115,5) 71,5% Juros - antecipação de recebíveis (50,6) (20,8) 143,6% (96,3) (20,8) n.a. Taxa de Serviços - Fee Boleto (3,2) (9,1) -65,3% (19,3) (29,8) -35,2% Outras despesas financeiras (9,8) (15,9) -38,7% (61,8) (39,7) 55,7% Receitas Financeiras 10,3 22,0 -53,2% 80,3 67,3 19,4% Rend. de aplicações financeiras 17,5 17,1 2,4% 63,6 44,5 42,9% Outras receitas financeiras (7,2) 4,9 n.a. 16,7 22,7 -26,6% Variação Cambial (hedge) (4,5) 17,0 n.a. (14,4) 36,8 n.a. Resultado Financeiro (111,6) (42,1) 165,1% (309,5) (101,7) n.a. O Resultado Financeiro totalizou despesa líquida de R$ 111,6 milhões no 4T22 e o aumento em comparação ao 4T21 deve-se, principalmente, aos efeitos do aumento do CDI médio que incide sobre a dívida líquida (7,63% a.a. no 4T21 para 13,65% a.a. no 4T22) e encargos sobre as antecipações de recebíveis, sendo R$ 998,6 milhões o montante de antecipações realizadas neste trimestre, em virtude da maior necessidade de caixa do período dado a sazonalidade do negócio e crescimento das operações. A variação cambial registou, no 4T22, perda de R$ 4,5 milhões (que incluem marcação a mercado de derivativos de proteção - hedge) ante ganho de R$ 17,0 milhões no 4T21, em função do resultado da variação da marcação a mercado de derivativos, da variação cambial sobre saldo de bancos e pagamentos internacionais. No acumulado do ano, a variação do Resultado Financeiro está atrelada principalmente: (i) aumento do CDI médio do período que incide sobre a dívida líquida, a qual saiu de 4,46% a.a. em 2021 para 12,45% a.a. em 2022, (ii) despesas incorridas com antecipações de recebíveis ao longo de 2022 e também (iii) aumento de R$ 22,1 milhões em Outras Despesas Financeiras em comparação a 2021, majoritariamente explicado pelo incremento nos juros das aquisições feitas no passado e imposto sobre operações financeiras (IOF). Para mais detalhes sobre Resultado Financeiro, vide Nota Explicativa 22 da Demonstração Financeira. Em decorrência da Lei do PERSE, as alíquotas de IR/CSLL passaram a ser zero para as operações no Brasil. Entretanto, no 4T22, o montante de R$ 14,4 milhões negativo apresentando nesta linha, refere-se majoritariamente às operações no exterior e tributos diferidos cuja realização ocorrerá após o período de vigência da lei do PERSE (mar/27). Adicionalmente, no período, houve a reversão de provisão para perda de créditos fiscais sobre prejuízo fiscal em uma das controladas da CVC Corp, dado a adesão ao Programa de Antecipação de Dívidas da PGFN 8.798/20223 . No acumulado do ano, houve reversão de créditos tributários constituídos, que geraram impacto contábil negativo de R$ 86,4 milhões, sendo que deste montante, R$ 62,1 milhões foram baixados no 1T22, em decorrência da Lei do PERSE. Em 2021, por outro lado, a Companhia ainda constituía créditos tributários ao longo do 1S21, sendo que desde o 3T21 não foram mais constituídos créditos tributários diferidos na operação do Brasil. Para mais detalhes sobre IR/CSLL, vide Nota Explicativa 15 da Demonstração Financeira. No 4T22 foi registrado Prejuízo Líquido de R$ 96,8 milhões, 33,6% inferior aos R$ 145,8 milhões apurados no 4T21, fruto da melhora do Resultado Operacional. Em 2022, o prejuízo registrado foi de R$ 433,4 milhões, 10,9% inferior ao reportado em 2021, R$ 486,6 milhões. 3 Texto completo no link: http://normas.receita.fazenda.gov.br/sijut2consulta/link.action?idAto=126532
  • 9. 9 RESULTADOS 4T22 Investimentos (Capex) e Transformação Digital R$ milhões 4T22 4T21 ∆ 2022 2021 ∆ 78,6 60,5 30,0% 244,8 133,6 83,2% Os Investimentos realizados pela CVC Corp no 4T22 totalizaram R$ 78,6 milhões e foram direcionados, principalmente para finalização dos projetos focados na transformação digital e também destinados à Tecnologia e Segurança da Informação, alinhado com o Plano de Investimento aprovado em 2021. Os principais projetos foram: (i) Atlas, maior projeto da transformação digital, é a plataforma para relacionamento com o cliente da CVC e, já ativa em todas as lojas do Brasil, integrando todos os canais que atendem os clientes da marca. O Atlas é importante pilar no objetivo da CVC de deixar de ter uma relação apenas transacional com o cliente e estar com ele na jornada completa. (ii) Clube CVC, o Programa de Fidelidade da CVC, permite que os clientes acumulem pontos e possam resgatá-los posteriormente em viagens. O programa já está disponível no site e no aplicativo da CVC, e deve chegar nas lojas físicas da marca a partir do segundo trimestre de 2023. (iii) Marketplace de crédito, que funciona como uma central de financiamentos, permitindo que os clientes tenham diversas opções para financiar suas viagens, podendo parcelar em até 24 vezes iguais, junto às instituições financeiras parceiras da CVC. (iv) Nova versão do Aplicativo CVC com melhor usabilidade na navegação, incluindo novas funções como check-in de hotel via app e um marketplace de parceiros; (v) Projetos de ganho de eficiência: a transformação digital acontece também para os times internos da CVC. Como forma de trazer mais eficiência, transparência e integração para os nossos sistemas, implementamos melhorias que somadas permitem obter ganhos de produtividade; (vi) Lançamento do ConecTaaS, uma nova plataforma para integração de APIs, que aumenta a conectividade e facilita o acesso das agências para venda de produtos. A plataforma é plug and play e funciona como uma vitrine de produtos; (vii) Ainda em implementação, a integração de sistemas operacionais e back-office no B2B, trazendo mais produtividade para as agências, aprimorando a oferta de serviços a agentes de viagem, promovendo também melhorias operacionais e de back-office; Além de todas estas frentes, a CVC Corp segue em um contínuo trabalho de aperfeiçoamento da gestão de informações por meio de datalake e CRM, que atualmente conta com mais de 34 milhões de clientes cadastrados, e é pilar fundamental para aumentarmos cada vez mais o conhecimento sobre nossos clientes, destacando que o CRM já está integrado com a nova plataforma do B2C e com todos os canais de venda (site, loja e app). Por fim, ao final de 2022, encerra-se o maior e mais acelerado ciclo de investimentos da trajetória da Companhia. Para 2023 espera-se que os investimentos convirjam para patamares mais usuais e, portanto, mais próximos ao Capex de manutenção da Companhia.
  • 10. 10 RESULTADOS 4T22 Fluxo de caixa O fluxo de caixa nas atividades operacionais do trimestre geraram R$ 453,0 milhões, e estão impactadas pelas antecipações de recebíveis que a companhia realizou. No 4T22, o valor de recebíveis antecipados somava R$ 998,6 milhões, dada a maior necessidade de caixa do período devido a sazonalidade inerente do negócio e crescimento das operações. O Caixa ao final do trimestre somava R$ 687,5 milhões, valor superior ao caixa mínimo (R$ 250,0 milhões) definido em sua política de gestão de caixa. Em 31 de dezembro de 2022, o valor de R$ 1.012,4 milhões de recebíveis antecipados, é relativo a recebíveis de cartão de crédito que venceriam em 2023. Em 2022, o fluxo de caixa da CVC Corp foi composto também por (i) investimentos no montante de R$ 244,8 milhões, em linha com o Plano de Investimento da Companhia aprovado em 2021; (ii) aumento de capital, que resultou em ingresso líquido de R$ 378,2 milhões no caixa, um importante reforço para a gestão financeira que foi concluído com sucesso ao final de junho de 2022 e, (iii) a amortização de R$ 100,0 milhões da debênture CVCB15, realizada em 30 de junho. Endividamento Ao final de 2022, o saldo em debêntures somava R$ 896,7 milhões, inferior aos R$ 990,1 milhões verificados ao fim de 2021 devido a amortização de R$ 100 milhões em junho último e cerca de metade do endividamento bruto verificado ao final de 2019 (pré-pandemia). Desde 2020 a CVC Corp vem envidando esforços para melhor equalização de sua estrutura de capital e gestão do seu passivo, que cresceu de forma acelerada nos anos anteriores pelas aquisições de empresas realizadas no Brasil e na Argentina. Nesse interim, a despeito das dificuldades impostas pela Covid-19 ao setor de turismo, foram realizados aumentos de capital (follow-on), com consequente diminuição gradativa do endividamento da Companhia. Em 2022 foram empenhados esforços no tocante a reorganização integral da dívida remanescente. Inicialmente, no 1º semestre, houve tratativas para uma possível nova emissão que viria a substituir as séries existentes, estas sucedidas por um follow-on em meados do ano que possibilitou a entrega de diversos projetos estratégicos e suporte ao capital de giro. Posteriormente, ao longo do 2º semestre, novas alternativas foram avaliadas pela CVC Corp, culminando na contratação de assessor externo, em jan/23, para conclusão das tratativas entre Companhia e debenturistas e acordo sobre a Proposta de Reperfilamento de Dívida comunicado via Fato Relevante e Aviso aos Debenturistas em 10 de março de 2023. R$ milhões 4T22 4T21 2022 2021 Prejuízo antes do Imposto de Renda e Contribuição Social (82,4) (138,2) (347,1) (545,3) Ajustes itens não caixa 96,4 69,5 478,7 261,0 Variação no Capital de Giro 439,1 299,9 (13,3) 179,8 Caixa líquido nas atividades Operacionais 453,0 231,2 118,3 (104,5) Caixa líquido das atividades de invest. - Capex (78,6) (60,5) (244,8) (133,6) Empréstimos e Debêntures - - (100,0) (547,7) Aumento de capital 0,1 (2,0) 378,2 806,6 Juros pagos (78,0) (37,5) (181,0) (88,1) Aquisição de controladas (8,2) (0,8) (51,6) (39,5) Outros (2,8) (2,5) (16,4) (20,7) Caixa líquido nas atividades de financiamento (89,0) (42,8) 29,1 110,6 Variação Cambial Caixa e Equivalentes de caixa (0,3) 4,4 (10,9) 12,5 Fluxo de Caixa no período 285,2 132,3 (108,3) (115,0) Caixa no início do período 402,4 663,5 795,8 910,8 Caixa no final do período 687,5 795,8 687,5 795,8
  • 11. 11 RESULTADOS 4T22 Nos termos apresentados, a Companhia chegou a um acordo com debenturistas representando mais de 75% das debêntures em circulação da 4ª emissão de cada série e 100% das debêntures em circulação da 5ª emissão (“Debêntures”) para reperfilamento destas Debêntures, de modo a alongar o perfil de sua dívida, e na redução do endividamento, por meio da amortização de R$ 124 milhões quando da conclusão da celebração dos aditamentos às respectivas escrituras das Debêntures. Os principais termos e condições propostos encontram-se resumidos detalhados no quadro-resumo a seguir.4 Atual Aditamento Proposto 4ª Emissão – série 1 4ª Emissão – série 2 5ª Emissão 4ª e 5ª Emissões Juros Taxa CDI + 6% a.a. CDI + 6,5% a.a. CDI + 5,75% a.a. CDI+5,5% a.a. Prêmio - - - 3,6%, equivalente a diferença entre a taxa acima e CDI+7% a.a., ajustado no PU Pgto. juros Semestral Semestral Trimestral Semestral Carência n.a. n.a. n.a. Até mai/24 Pagamentos Amortização inicial - - - R$ 124 milhões CVCB14: 20% CVCB24: 10% CVCB15: 10% Amortização da dívida 18/04/2023 18/04/2024 01/06/2023 Nov/24: 10% 18/04/2025 07/04/2023 Nov/25: 45% Nov/26: 45% Vencimento 18/04/2023 18/04/2025 01/06/2023 nov/26 Pré pagamento Sim Sim Sim Vedado pré pagamento Conversibilidade e capitalização futura - - - Ver abaixo Outros Covenants Dív. Líq/Ebitda ≤3,5x Dív. Líq/Ebitda ≤3,5x Dív. Líq/Ebitda ≤3,5x Dividend payout: 25% Capex: R$ 125 mi/ano Dív. Líq/EBITDA Dez/23: <=3,5x Mar/25: <=3,0x Mar/26: <=2,5x Garantias - - - 13,3%do saldo devedor em recebíveis de cartões de crédito Negative Pledge - - - Ativos > R$ 100 mi Saldo 12/2022 R$ 388,0 R$ 211,7 R$ 297,3 Conversibilidade e capitalização futura5 : a. Caso a Companhia realize uma captação por meio de aumento de capital até 30/11/2023 em valor igual ou superior a R$125 milhões, a Companhia se comprometerá com a realização de uma tender offer de ao menos R$75 milhões para as Debêntures Existentes reperfiladas considerado o PU Par acrescido de prêmio de 3%. b. Caso a Companhia não realize uma captação por meio de aumento de capital até 30/11/2023 em valor igual ou superior a R$125 milhões, a Companhia se obriga a aprovar um aumento de capital limitado a R$ 200 milhões com o objetivo de capitalizar as Debêntures, onde o preço por ação será fixado considerando o menor preço entre: (i) R$3,50 por ação; ou (ii) um deságio médio 4 Recomenda-se a leitura integral do Fato Relevante de 10/03/2023, incluindo o term sheet de reperfilamento anexo, disponível no site da Companhia e CVM 5 Recomenda-se a leitura integral do Fato Relevante de 10/03/2023, incluindo o term sheet de reperfilamento anexo, disponível no site da Companhia e CVM
  • 12. 12 RESULTADOS 4T22 de 20% (vinte por cento) sobre a cotação média de fechamento dos 30 (trinta) dias corridos imediatamente anteriores à data de aprovação do aumento de capital pela Emissora. Com a conclusão desse reperfilamento a Administração entende estar melhor equacionado, pelos próximos anos, os vencimentos da dívida ao seu fluxo de caixa previsto, de forma a não comprometer sua capacidade de crescimento e investimento em suas operações. Adicionalmente, o endividamento bruto da Companhia é novamente reduzido e atinge o menor patamar desde dez/2017. Ainda que o endividamento atual esteja condizente com o porte e momento da Companhia, seguirá avaliando possibilidades para reduções adicionais do endividamento, a depender de como evoluírem as condições de mercado dos próximos anos. A implementação do reperfilamento está sujeita à concordância desses debenturistas em relação aos documentos definitivos do reperfilamento, bem como de sua aprovação nas respectivas assembleias gerais de debenturistas, sendo a da 4ª emissão de debêntures a ser realizada em 06/04/20236 . Se concluída com sucesso, o endividamento da Companhia passará a ter o seguinte cronograma de amortização: Cronograma atual de amortização das debêntures R$ milhões Cronograma proposto de amortização das debêntures R$ milhões 6 Para mais informações acesse o Edital de Convocação publicado em 13/03/2023.
  • 13. 13 RESULTADOS 4T22 Anexos Anexo 1: Balanço Patrimonial (R$ milhões) Ativo 31/12/2022 31/12/2021 Passivo 31/12/2022 31/12/2021 Ativo Circulante Passivo Circulante Caixa e equivalentes de caixa 687,5 795,8 Debentures 693,7 218,6 Aplicações Financeiras 127,4 190,8 Instrumentos Financeiros derivativos 2,0 1,8 Instrumentos financeiros derivativos 1,1 - Fornecedores 753,4 671,4 Contas a receber de clientes 515,5 1.092,9 Contratos a embarcar antecipados 1.363,7 2.112,4 Adiantamentos a fornecedores 445,1 714,2 Salários e encargos sociais 145,8 138,3 Despesas antecipadas 39,6 37,5 Impostos de Renda e Contribuição Social correntes 3,8 5,2 Impostos a Recuperar 80,7 108,0 Impostos e contribuições a pagar 66,5 65,8 Outras contas a receber 65,6 43,8 Contas a pagar de aquisição de controlada e investida 22,8 31,5 Total do ativo circulante 1.962,4 2.982,9 Passivo de arrendamento 16,7 12,8 Outras contas a pagar 61,8 101,8 Total do Passivo Circulante 3.130,4 3.359,7 Ativo Não Circulante Passivo Não Circulante Despesas pagas antecipadamente 23,6 25,8 Debêntures 203,0 771,4 Impostos a recuperar 4,1 - Impostos de Renda e Contribuição Social a pagar 21,2 43,2 Impostos diferidos 555,3 654,7 Provisão demandas jud. e adm. e passivo contingente 94,8 243,7 Depósito Judicial 135,3 99,7 Contas a pagar de aquisição de controlada e investida 90,1 97,1 Outras contas a receber 11,1 12,7 Passivos de Arrendamento 43,6 27,7 Investimentos 4,5 - Contratos a embarcar antecipados 6,2 25,5 Ativo imobilizado 36,1 38,2 Outras contas a pagar 11,9 13,6 Ativo intangível 1.130,4 1.108,1 Total do passivo não circulante 470,7 1.222,2 Ativos de Direito de Uso 54,6 34,9 Total do ativo não circulante 1.955,1 1.974,2 Patrimônio Líquido Capital social 1.414,0 1.371,7 Reservas de capital 812,6 478,7 Ágio em Transição de Capital (183,8) (183,8) Outros Resultados abrangentes 61,7 63,3 Ações em Tesouraria (0,1) (0,1) Prejuízos acumulados (1.787,9) (1.354,4) Total do Patrimônio líquido 316,5 375,3 Total do Ativo 3.917,6 4.957,2 Total do Passivo e Patrimônio Líquido 3.917,6 4.957,2
  • 14. 14 RESULTADOS 4T22 Anexo 2: Demonstração de Resultados Consolidado Brasil Argentina Consolidado Brasil Argentina R$ milhões 4T22 4T21 4T22 4T21 4T22 4T21 2022 2021 2022 2021 2022 2021 Receita Líquida 321,4 314,0 255,7 262,1 65,7 51,9 1.221,6 825,9 960,3 706,7 261,3 119,1 Despesas de vendas (41,4) (56,3) (25,4) (35,0) (16,0) (21,2) (194,9) (161,6) (138,2) (105,5) (56,6) (56,1) Perda por redução ao valor recuperável de contas a receber (20,7) (8,5) (20,3) (8,2) (0,4) (0,4) (48,4) 1,8 (47,7) 2,8 (0,7) (1,0) Total das Despesas gerais e administrativas (302,7) (315,4) (226,4) (262,5) (76,3) (52,9) (1.111,6) (1.009,5) (877,4) (829,0) (234,2) (180,6) Despesas gerais e administrativas (249,3) (254,7) (188,8) (227,2) (60,5) (27,6) (908,4) (801,0) (735,2) (704,0) (173,2) (97,0) Depreciação e amortização (53,4) (60,7) (37,6) (35,4) (15,8) (25,3) (203,2) (208,6) (142,2) (125,0) (61,0) (83,6) Equivalência Patrimonial (0,3) - (0,3) - - - (0,9) - (0,9) - - - Outras receitas/despesas operacionais 73,0 (29,9) 36,5 (33,8) 36,5 3,8 96,7 (100,2) 43,8 (108,4) 52,8 8,2 Lucro (Prejuízo) antes do resultado financeiro 29,2 (96,1) 19,7 (77,4) 9,6 (18,8) (37,6) (443,6) (60,1) (333,4) 22,5 (110,3) Resultado financeiro (111,6) (42,1) (110,8) (58,7) (0,8) 16,6 (309,5) (101,7) (292,5) (129,2) (17,0) 27,6 Lucro (Prejuízo) antes do imposto de renda e contribuição social (82,4) (138,2) (91,1) (136,1) 8,8 (2,1) (347,1) (545,3) (352,6) (462,6) 5,5 (82,7) Imposto de renda e CS (14,4) (7,5) (14,2) (2,1) (0,2) (5,4) (86,4) 58,7 (85,2) 61,8 (1,1) (3,1) Corrente (0,1) 0,8 (0,1) 0,8 (0,0) (0,1) (0,9) 0,6 (0,8) 0,8 (0,0) (0,2) Diferido (14,3) (8,3) (14,1) (2,9) (0,2) (5,4) (85,5) 58,1 (84,4) 61,0 (1,1) (2,9) Lucro (Prejuízo) líquido do exercício (96,8) (145,8) (105,3) (138,2) 8,6 (7,6) (433,4) (486,6) (437,8) (400,8) 4,4 (85,8) Atribuído a acionistas controladores (96,8) (147,2) (105,3) (138,2) 8,6 (9,0) (433,4) (476,3) (437,8) (401,4) 4,4 (74,9) Atribuído a acionistas não controladores - 1,5 - - - 1,5 - (10,3) - 0,6 - (10,9)
  • 15. 15 RESULTADOS 4T22 Anexo 3: Fluxo de Caixa - Método indireto R$ milhões 4T22 4T21 2022 2021 Prejuízo antes do Imposto de Renda e Contribuição Social (82,4) (138,2) (347,1) (545,3) Ajustes para reconciliar o resultado do exercício com o caixa das atividades operacionais 96,4 69,5 478,7 261,0 Depreciação e amortização 53,4 60,7 203,2 208,6 Perda por redução ao valor recuperável de contas a receber 20,7 8,6 48,4 (1,8) Juros e variações monetárias e cambiais 79,3 28,6 282,3 83,1 Equivalência patrimonial 0,3 - 0,9 - Provisão (reversão) para demandas judiciais e administrativas (63,7) (36,4) (76,4) (61,3) Mudanças do valor justo da opção de compra - (1,4) - (3,2) Baixa de imobilizado, intangível e contratos de aluguéis – IFRS 16 7,2 5,8 17,8 16,2 Outras provisões (0,8) 3,6 2,5 19,4 Redução (aumento) em ativos e passivos 439,1 299,9 (13,3) 179,8 Contas a receber de clientes 408,4 442,2 440,8 61,1 Adiantamentos a fornecedores 231,8 41,8 267,7 117,0 Fornecedores 104,3 114,4 92,7 170,0 Contratos a embarcar antecipados (407,5) (295,6) (755,0) (24,4) Variação em tributos a recuperar/ recolher 12,4 8,6 19,8 48,2 Liquidação de instrumentos derivativos (0,2) 1,4 (16,1) 0,5 Salários e encargos sociais (10,1) (5,9) 9,2 (8,5) Imposto de renda e contribuição social pagos (5,2) (0,4) (4,7) (2,0) Provisão para demandas judiciais e administrativas (30,4) 0,2 (32,9) (1,1) Variação em outros ativos 123,9 (33,4) 0,9 (179,3) Variação em outros passivos 11,7 26,7 (35,6) (1,7) Caixa líquido nas atividades Operacionais 453,0 231,2 118,3 (104,5) Ativo imobilizado (1,6) (11,7) (16,2) (12,1) Ativo intangível (77,0) (49,6) (223,2) (121,5) Aquisições de controladas 0,0 0,8 (5.4) - Caixa líquido aplicado nas atividades de Investimentos - Capex (78,6) (60,5) (244,8) (133,6) Captação de debêntures e empréstimos - - - 436,4 Liquidação de debêntures e empréstimos - - (100,0) (984,1) Aumento de capital 0,1 (2,0) 378,2 806,6 Juros pagos (78,0) (37,5) (181,0) (88,1) Captação/Liquidação de instrumentos derivativos - - - (9,8) Exercício de opções com alienação de ações em tesouraria - - - - Aquisição de controladas (8,2) (0,8) (51,6) (39,5) Pagamento de arrendamento - IFRS16 (2,8) (2,5) (16,4) (10,9) Caixa líquido (aplicado nas) proveniente das atividades de Financiamento (89,0) (42,8) 29,1 110,6 Variação Cambial Caixa e Equivalentes (0,3) 4,4 (10,9) 12,5 Aumento (redução) de caixa e equivalentes de caixa líquidos 285,2 132,3 (108,3) (115,0) Caixa e equivalentes de caixa no início do período 402,4 663,5 795,8 910,8 Caixa e equivalentes de caixa no final do período 687,5 795,8 687,5 795,8
  • 16. 16 RESULTADOS 4T22 Anexo 4: Representatividade dos meios de pagamento nas Reservas Confirmadas CVC Lazer Anexo 5: Evolução da rede de lojas 4T22 3T22 2T22 1T22 4T21 Brasil 1.111 1.129 1.147 1.158 1.176 CVC 1.059 1.076 1.093 1.103 1.119 Próprias 14 16 16 13 12 Novo Layout 12 12 12 9 4 Franquias 1.045 1.060 1.077 1.090 1.107 Novo Layout 29 19 13 6 - Experimento 52 53 54 55 57 Próprias 4 4 4 4 4 Franquias 48 49 50 51 53 Argentina 107 107 98 98 103 Almundo 107 107 98 98 103 Próprias 5 5 7 7 7 Franquias 102 102 91 91 96 Total CVC Corp 1.218 1.236 1.245 1.256 1.279
  • 17. 17 RESULTADOS 4T22 Glossário B2B: Unidade de negócio que apresenta uma solução completa para os agentes de viagens e seus respectivos clientes corporativos. Composta pelas marcas: Esferatur, Trend Via, Visual Turismo, RexturAdvance e VHC. Descrição das marcas vide CVC Brasil. B2C: Unidade de negócio focada no cliente final. Composta pelas marcas: CVC, Experimento, Submarino. Descrição das marcas vide CVC Brasil. Bibam: Marcas Biblos e Avantrip. Contratos a embarcar: Desde o início da pandemia, a Companhia vem oferecendo a remarcação das reservas e dos serviços que foram adiados ou a concessão de crédito para uso ou abatimento na compra futura de outras reservas ou serviços de turismo, segundo a conveniência do próprio consumidor (o valor contabilizado é líquido de penalidades ou multas por cancelamento). Conforme Nota Explicativa 19 da Demonstração Financeira da Companhia. CVC Argentina: Maior agência de viagens da Argentina, composta pelas marcas Almundo (agência de viagens e serviços complementares), Avantrip (plataforma online de viagens e serviços complementares), Biblos (agência focada em viagens de luxo e personalizadas) e Ola Transatlantica (operadora de produtos e serviços de viagem). CVC Brasil: Composto pelas marcas CVC (agência de viagens e serviços complementares, Top of Mind no Brasil pelo 12º ano consecutivo), Experimento (agência de intercâmbio estudantil e serviços complementares, Submarino Viagens (portal de venda online de passagens aéreas, hospedagens, pacotes turísticos, aluguel de carros e seguro viagem), Esferatur (consolidadora aérea e hotéis, oferece também locação de carros), Trend Viagens (consolidadora de hotéis no Brasil e exterior, pacotes turísticos, locação de carros, entre outros), Visual Turismo (especializada em viagens personalizadas, seja para viagens de lazer, lua de mel, ecoturismo, peregrino-religiosos, cruzeiros ou incentivo), RexturAdvance (consolidadora aérea de voos nacionais e internacionais) e VHC (marca de locação e administração de residências). CVC Corp: Maior agência de turismo da América Latina, com operações no Brasil e Argentina, composta pelas marcas da CVC Brasil e CVC Argentina, descritas acima. Despesa Financeira: Despesas financeiras relacionadas principalmente aos empréstimos bancários e taxas sobre serviços financeiros, incluindo as despesas de juros referente às antecipações de cartão de crédito EBITDA (Earnings Before Interest, Taxes, Depreciation and Amortization): é uma medida não contábil elaborada pela Companhia em consonância com a Instrução da CVM nº 527, de 4 de outubro de 2012 ("Instrução CVM 527"), conciliada com suas demonstrações financeiras e consiste no lucro líquido antes do resultado financeiro líquido, excluindo as depreciações, amortizações e resultado de equivalência patrimonial. EBITDA Ajustado: conforme demostrado neste documento, toma como base o EBITDA, excluído os efeitos não recorrentes do período e acrescido das despesas incorridas com emissões de boleto (reconhecidas contabilmente na rubrica Despesas Financeiras). Também pode ser calculado a partir do Lucro Líquido, acrescendo o Resultado financeiro líquido, o Imposto de renda e contribuição social e as Despesas com depreciação, amortização e resultado da equivalência patrimonial, líquidos dos valores referentes ao fee do boleto – Financeiras e despesas não recorrentes. O EBITDA ajustado não é uma medida contábil utilizada nas práticas contábeis adotadas no Brasil ou pelo IFRS, e não deve ser considerado como uma alternativa ao lucro líquido na qualidade de indicador do desempenho operacional ou como uma alternativa ao fluxo de caixa na condição de indicador de liquidez. Nossa definição de EBITDA ajustado pode não ser comparável ao EBITDA ajustado conforme definido por outras empresas. Não recorrentes: Os efeitos não recorrentes registrados incluem, fundamentalmente (i) Impactos referente ao COVID-19 (impactos ocasionados pelo cenário de pandemia, que inclui comissões de lojas não recuperadas por reembolso, multas, baixas de receitas não realizadas e outros gastos não relacionados a reservas); (ii) impairment de intangíveis; (iii) passivos contingentes; entre outros. Receita líquida: é o resultado das receitas de intermediação menos o custo dos serviços prestados e impostos sobre venda, e usualmente denominadas dessa forma no setor. Nas Demonstrações Financeiras, essa métrica é reportada como Lucro Bruto. Reservas confirmadas Brasil e Argentina: resultado de novas vendas e reagendamentos, líquidos de cancelamentos no período. Reservas consumidas: Reservas que dão base à Receita Líquida, incluindo o online, segundo critérios de reconhecimento de receita de cada marca, a saber: CVC no Check-in; Experimento no Check-in; Submarino Viagens aéreo na venda e terrestre + voos/produtos exclusivos (popularmente conhecido como fretamento) no Check-in; RexturAdvance aéreo na venda e terrestre no Check-in; Esferatur na venda; Trend no Check-in; Visual no Check-in e VHC nos checkouts realizados. Reservas Consumidas Argentina: Reservas Confirmadas para a Biblos + Reservas Consumidas para a Ola Transatlantica Take rate: importante métrica utilizada no setor, resulta da divisão da receita líquida pelas Reservas Consumidas.
  • 18. 1 RESULTS 4Q22 Santo André, March 14, 2023: CVC Brasil Operadora e Agência de Viagens S.A. (B3: CVCB3) informs its shareholders and other market participants of the results for the fourth quarter of 2022 (4Q22) and the year of 2022 (2022). Unless otherwise indicated, the financial and operating information below are presented in nominal million of reais (R$), prepared pursuant to the Brazilian accounting standards, especially Law No. 6.404/76 and the standards issued by the Accounting Standards Committee (“CPC”) and approved by the Securities and Exchange Commission of Brazil (“CVM”), and must be read together with the financial statements and the explanatory notes for the period ended December 31, 2022. 2022: Net Revenue reaches R$ 1.2 billion (up 48% vs 2021), while EBITDA totals R$ 167 million (compared to –R$ 235 million in 2021); R$ 1.4 billion in Confirmed Bookings recorded in January 2023 (up 90% vs January 2022)  Bookings and Consumed Bookings grew 56% and 64% respectively (YoY), due to the resumption of sales at all Units  Operating leverage: Net Revenue grew 48% in 2022, as a result of the strong recovery in business travel, pleasure travel, and event travel. General and Administrative Expenses increased 13% in 2022; in 4Q22 they were like those reported in 4Q21;  Highest quarterly EBITDA since 3Q19: R$ 83.0 million;  Digital Transformation  Complete roll-out of the new platform that consolidates relationships with B2C customers (apps, e- commerce and stores) with CRM  Availability of the Financing Center, a credit marketplace that expands payment methods that are attractive to consumers  Launch of Programa de Fidelidade - Clube CVC (Loyalty program)  A new and unified backoffice for B2B operations.  Subsequent event – Renegotiation of debentures: On March 10, the Company entered into an agreement for the total renegotiation of its debt, in agreement with debenture holders representing more than 75% of the outstanding debentures of the 4th issue of each series and 100% of the outstanding debentures of the 5th issue. The implementation of the reprofiling is subject to the consent of the debenture holders, as well as approval at the respective Debenture Holders General Meeting. More details on pg. 10. R$ million 4Q22 4Q21 ∆ 2022 2021 ∆ Bookings 3,455.4 3,044.2 13.5% 13,942.4 8,967.1 55.5% Consumed Bookings 3,693.6 3,444.6 7.2% 14,428.7 8,816.4 63.7% Net Revenue 321.4 314.0 2.4% 1,221.6 825,9 47.9% Take Rate 8.7% 9.1% -40 bps 8.5% 9.4% -90 bps EBITDA 83.0 (35.4) n.m. 166.5 (235.1) n.m. Adjusted EBITDA 4.2 8.9 -52.4% 72.6 (218.8) n.m. Net Loss (96.8) (145.8) -33.6% (433.4) (486.6) -10.9% Capital Markets (Dec. 31) CVCB3: R$ 4.49 per share Total shares: 277,247,309 Market cap: R$ 1.2 billion Daily avg fin vol. 4Q22: R$ 99 million Results Conference Call March 15, 2023 2:00 p.m. (BRT) / 1:00 p.m. (EST) Ph. +55 11 4290-1621 / +55 11 3181-8565 Link for webcast Investor Relations https://ri.cvc.com.br/ ri@cvc.com.br
  • 19. 2 RESULTS 4Q22 Message from Management The year 2022 was a milestone in the trajectory of CVC Corp in terms of Digital Transformation and the development of “omnichannelity”, with relevant deliveries such as a new storefront system as well as interaction with customers in B2C, Customer Loyalty Program (called “Clube CVC”), Financing Center (or Credit Marketplace), and dynamic product pricing system. These deliveries have allowed us to seek new levels of efficiency and will make it possible for us to enjoy greater operating efficiency and, consequently, operating leverage. Also noteworthy was the evolution of our CRM, which already exceeds 34 million contactable customers, thus creating support for a relationship journey through targeted campaigns that will contribute toward higher conversion and greater customer loyalty, our CRM is already integrated with the new B2C platform and with all sales channels (website, store and app). An amount of more than R$ 400 million has been invested in technology since 2020, of which more than R$ 240 million was in 2022 alone, an absolute record for the company that ends a more accelerated cycle of tool development. Due to everything that was done throughout 2022, CVC won, for the 12th consecutive year, the Top-of-Mind award in the “Tourism Agency” category and made its debut in the new “Tourism Application” category. In line with the digitalization strategy, several weeks ago we launched ConecTaaS, a new platform for integrating APIs, which increases connectivity and facilitates access for CVC agencies to sell products. The platform is plug-and-play, and functions like a product showcase. With the aim of expanding the means of payment and convenience for our customers, we recently started to allow the use of Livelo (rewards program) points, which can be used to cover the total or partial amount of the purchase of travel products. This new offering is now available throughout the CVC network, and all Livelo customers can enjoy this new benefit at all CVC brick-and-mortar locations. We have a long-standing partnership with Livelo (since 2016), when we became suppliers of products related to the tourism sector, through the official website of the company’s rewards program. With regard to results, our bookings and earnings progressed throughout 2022, demonstrating the recovery of the market and the Company’s performance capacity. Confirmed and consumed bookings increased both in Brazil and Argentina, and, consequently, the net revenue between periods grew as well. Our deliveries – whether in terms of results or the enhancement of our operation – are aligned with our values, especially “We Honor our Commitments”. Throughout 2022, we endeavored to support our customers in the use of travel credits resulting from the restrictions imposed by the pandemic. This amount fell 62% compared to the final balance of 2021 (from R$ 761 million to R$ 293 million). We also made progress on the operating efficiency front, which resulted in better control of expenses. In early 4Q22, we began the process of reassessing structures and streamlining suppliers, in addition to a major overhaul of internal processes. This process will extend throughout 2023 and will be supported by an external consulting firm, focusing primarily on revising operational activities. In view of the strong recovery in sales in 2022 and the growth forecasts for the coming years, we have been constantly assessing our capital structure. Last June, the Offer of Shares of R$ 403 million was ratified, and we are currently in the final stages of negotiations for the reprofiling of our debt. We hired an advisor to assist us, and this month we released to the market a proposal for reprofiling our entire debt; the broad acceptance of this proposal indicates that we are on the right path, building a more solid and profitable company, with the support of shareholders and debenture holders. When completed, CVC Corp will have its lowest level of gross debt since 2017. We started out 2023 with the best January in sales since the onset of the pandemic, with all areas of the company focused on bringing the best offers in products, services, and payment terms to our target audience. This is all being done in a way that is supported by a refurbished and robust IT structure, with a better customer experience, capable of supporting the increase in demand. We believe that these bases will allow us to take advantage of opportunities on the market throughout the year, and thus report sales growth and evolution in our profitability.
  • 20. 3 RESULTS 4Q22 CVC Corp Result Bookings and Consumed Bookings R$ million 4Q22 4Q21 ∆ 2022 2021 ∆ Bookings 3,455.4 3,044.2 13.5% 13,942.4 8,967.1 55.5% Brazil 2,502.9 2,229.5 12.3% 10,274.6 7,455.4 37.8% B2C 1,164.6 1,051.0 10.8% 4,557.2 3,781.9 20.5% B2B 1,338.2 1,178.5 13.6% 5,717.4 3,673.6 55.6% Argentina 952.5 814.7 16.9% 3,667.8 1,511.6 142.6% Consumed Bookings 3,693.6 3,444.6 7.2% 14,428.7 8,816.4 63.7% Brazil 2,741.0 2,630.0 4.2% 10,760.9 7,304.8 47.3% B2C 1,322.3 1,393.6 -5.1% 4,995.5 3,563.9 40.2% B2B 1,418.7 1,236.4 14.7% 5,765.3 3,740.9 54.1% Argentina 952.5 814.7 16.9% 3,667.8 1,511.6 142.6% Bookings increased by 13.5% in 4Q22 over 4Q21, with demand for international destinations (42% increase in Brazil and 71% in Argentina compared to 4Q21) benefiting from greater availability of the airline network and frequency of flights. Furthermore, 4Q22 bookings in Brazil were positively influenced by Black Friday, which grew in relation to the 2021, but adversely affected by the World Cup, especially in B2B, and by the change of B2C platform, which despite successful in not causing inconvenience to customers, it momentarily impacted store operations in the period. It is worth mentioning that the new B2C platform allows for greater integration of the physical and digital channels, as well as a customized approach for customers in offers, purchases and service. We also highlight our performance regarding the 2022/2023 cruise season, with an increase of more than 200% compared to 4Q21, given the expansion of offer of what is expected to be the busiest Brazilian cruise season in the last 10 years1 . In January 2023, cruise product sales accounted for 20% of the B2C Business Unit’s bookings; more than 25% of all passengers who boarded cruise ships within Brazil that month were customers of CVC Corp. Consolidated confirmed bookings in January 2023 totaled roughly R$ 1.4 billion. Bookings at CVC Corp for international destinations continued to rise and accounted for 53% of confirmed bookings in the period (39% in 4Q21). Below, we detail the breakdown by destination in Brazil and Argentina: 1 Source: https://abremar.com.br/guia-clia-brasil/
  • 21. 4 RESULTS 4Q22 4Q22 4Q21 Brazil Argentina In B2C, Consumed Bookings were down compared to 4Q21, when there was a strong resumption of local tourism, reflecting the pent-up demand following the reopening for travel as well as advanced vaccination, and also due to the higher number of long weekends. In B2B, Consumed Bookings grew 14.7% vis-à-vis 4Q21, because of the resumption of corporate events and business travel witnessed over the last three quarters. In Argentina, Consumed Bookings continued to grow, mainly to international destinations, with Almundo being the most highly representative of these bookings, driven by the FIFA World Cup. Since the beginning of the reopening of various destinations, the Company has endeavored to assist its customers in the use of travel credits stemming from rescheduling because of the restrictions imposed by the COVID-19 pandemic. These amounts were significantly reduced throughout 2022, for a total a balance of R$ 292.7 million at the end of 2022, a reduction of R$ 468.5 million (or 62%) compared to the closing of 4Q21, thus reaching – at the end of 2022 – more normal levels considering the company’s usual operation. It is also worth recalling that the Law 14390/222 , published on July 04, 2022, extended deadlines for rescheduling and using credits available in hotels and other ground services to December 31, 2023. 3 Full text available at http://www.planalto.gov.br/ccivil_03/_ato2019-2022/2022/lei/L14390.htm 61% 39% 69% 31% 10% 90% 39% 61% National International
  • 22. 5 RESULTS 4Q22 Net Revenue R$ million 4Q22 4Q21 ∆ 2022 2021 ∆ Net Revenue 321.4 314.0 2.4% 1,221.6 825.9 47.9% Brazil 255.7 262.1 -2.5% 960.3 706.7 35.9% B2C 167.1 183.9 -9.1% 637.7 451.4 41.3% B2B 88.6 78.3 13.2% 322.6 255.3 26.4% Argentina 65.7 51.9 26.6% 261.3 119.1 119.3% Take Rate 8.7% 9.1% -40 bps 8.5% 9.4% -90 bps Brazil 9.3% 10.0% -70 bps 8.9% 9.7% -80 bps B2C 12.6% 13.2% -60 bps 12.8% 12.7% 10 bps B2B 6.2% 6.3% -10 bps 5.6% 6.8% -120 bps Argentina 6.9% 6.4% 50 bps 7.1% 7.9% -80 bps Net Revenue in 2022 grew 47.9% over 2021, reflecting the performance in Consumed Bookings, contributing toward the improvement of operating income (loss). In 4Q22, Net Revenue was similar to the same period last year, with the growth in Bookings partially offset by a downturn in the take rate, due to the mix of businesses and products, such as increased sales of cruise products and lower occupancy on exclusive products at certain locations. The Take Rate reached 8.7% in 4Q22, reflecting the strong growth of cruise products, which – despite having a lower nominal take rate compared to other products – does not require working capital. It is worth noting that 4Q21 was sustained by the increase in travel (mainly domestic), due to the greater availability of flights and pent-up demand, momentarily favoring the take rate. As a result, the take rate in 4Q22 was 0.4% lower than the one reported in 4Q21. The 2022/2023 cruise season runs from October 2022 to May 2023 and – according to data from the Brazilian Cruise Lines Association (Abremar) – is expected to be the busiest in recent years, as mentioned above. Argentina’s Take Rate reached 6.9% in 4Q22, 0.5% higher than in 4Q21, driven by Ola. It is also worth mentioning that there was an increase in taxes on international travel, which were added to the value of consumed bookings (albeit with no impact on Net Revenue), thereby diluting the take rate. On February 28, Brazil’s Federal Senate approved (unaltered) the conversion of Provisional Measure 1138/2022 into Law 14537/2023, which established the reduction of the nominal rate from 25% to 6% of Withholding Income Tax (IRRF) levied on remittances abroad related to personal expenses on travel for tourism, business, services, training, or official missions from January 2023 to December 2024; thereafter, increasing by 1% per annum until 2027 (capping at 9%). This reduction aims to stimulate tourism, seeking to make tourism agencies and operators more competitive, which was one of the sectors most affected by the COVID-19 pandemic, with CVC Corp benefiting from this measure. 37% 33% 46% 56% 17% 11% 4Q22 4Q21 Consumed Bookings - Product B2C (%) Air Non - Air Cruise
  • 23. 6 RESULTS 4Q22 Expenses R$ million 4Q22 4Q21 ∆ 2022 2021 ∆ General and administrative expenses (249.3) (254.7) -2.1% (908.4) (801.0) 13.4% Sales expenses (62.1) (64.8) -4.2% (243.3) (159.8) 52.2% Other operating revenue/expenses 73.0 (29.9) n.m. 96.7 (100.2) n.m. Subtotal Operating Expenses (238.4) (349.5) -31.8% (1,055.1) (1,060.9) -0.6% (-) Non-Recurring Items 75.6 (53.4) n.m. 74.6 (46.1) n.m. Subtotal Recurring Operating Expenses (314.0) (296.1) 6.0% (1,129.5) (1,014.8) 11.3% (+) Service Fee - Bank fee slips (3.2) (9.1) -65.3% (19.3) (29.8) -35.3% Adjusted EBITDA 4.2 8.9 -52.4% 72.6 (218.8) n.m. General and Administrative Expenses were practically in line when compared to 4Q21 due to the rationalization and greater control of fixed expenses, despite the negative impacts of union agreements (adjustment of 5.82%, as of November 2022 in Brazil, and around 65% in local currency in Argentina in the last 12 months). In YTD, the strengthening of certain areas, such as Operations and IT, contributed to the 13.4% increase in this item, in addition to the effects, throughout the year, of the 10% wage readjustment in Brazil in November 2021. In 4Q22, a formal program to increase efficiency was initiated, focusing on the streamlining of structures and processes, with a consequent reduction in expenses. Given the investments made in automation over the past few years, adjustments were made to CVC Corp’s management structure, partly carried out in 4Q22 and partly in January 2023. This efficiency program will continue throughout 2023, focusing primarily on operating processes/activities. Other Operating Revenues/Expenses recorded a positive amount of R$ 73.0 million, mostly composed of (i) reversal of provisions for risks stemming from past acquisitions, which did not materialize; (ii) revenues from incentives for airline ticket distributors and partially offset by (iii) expenses on refunds and cancellations. In 4Q21, this item had recorded a negative amount, mainly due to expenses incurred by the discontinuation of the operations of Companhia Aérea ITA. In 2022 this item recorded a positive amount of R$ 96.7 million, mainly due to the effects mentioned in 4Q22, in particular incentives for air ticket distributors, as a result of the recovery of Bookings throughout the year, which grew 55.5% compared to 2021. Non-recurring expenses in 4Q22 totaled a positive amount of R$ 75.6 million, mostly composed of the reversal of provisions (see item “i” of Other Operating Income/Expenses). In the 4Q22, Sales expenses of CVC Corp decreased 4.2% against 4Q21, while in YTD grew 52.2%, reflecting the increase in Consumed Bookings in Argentina (+143%) and Brazil (+47%). R$ million 4Q22 4Q21 ∆ 2022 2021 ∆ Sales expenses (62.1) (64.8) -4.2% (243.3) (159.8) 52.2% Brasil (45.8) (43.2) 6.0% (185.9) (102.7) 81.0% as% of Consumed Bookings 1.7% 1.6% 10 bps 1.7% 1.4% 30 bps Provision for Doubtful Accounts (20.3) (8.2) n.m. (47.7) 2.8 n.m. Marketing (9.4) (17.1) -45.2% (66.7) (54.8) 21.6% Credit Card Fees (16.1) (17.9) -10.5% (71.5) (50.7) 41.1% Argentina (16.3) (21.6) -24.6% (57.4) (57.1) 0.6% as% of Consumed Bookings 1.7% 2.7% -100 bps 1.6% 3.8% -220 bps
  • 24. 7 RESULTS 4Q22 In Brazil, there was a different timing of marketing expenses over the quarters, as a result of business needs and the environment of the tourism sector; the growth of this item in 2022 was similar to the growth of B2C Bookings (20.5% in Bookings and 21.6% in Marketing Expenses), bearing in mind that in 2022 we celebrated the 50th anniversary of CVC and we had marketing actions related to this fact. In 2022, Credit Card Expenses in Brazil had a lower growth than Consumed Bookings (+47.3%), as a result of the usual fluctuations in the receipt mix throughout the year. Additionally, in 4Q22, there was an effect of the increase in consumed bookings of the maritime product, in which payment is processed directly at the shipowner, with CVC Corp only commissioning for this service. Throughout the year, there was less representation of the use of payment orders, mainly due to the implementation of the financing center (Credit Marketplace). Lastly, the accumulated Allowance for Doubtful Accounts for 2022 portrays the growth in operations that occurred in the year, which follows conservative rules in granting credit; one can also see that this item presented a positive value in 2021, stemming from the high volume of reversals of allowances recognized in 2020 due to the pandemic. In the Argentine operation, there was a reduction in selling expenses, compared to 4Q21, due to: (i) reduction in expenses associated with processing payments by credit card, given the restriction imposed by the government in the form of installment payments for international travel in the retail operation (mainly Almundo), thereby resulting in more payments in cash; and (ii) lower marketing expenses, as was seen in Brazil, due to the timing of these expenses over the quarters. In YoY, selling expenses remained stable. EBITDA R$ million 4Q22 4Q21 ∆ 2022 2021 ∆ Adjusted EBITDA 4.2 8.9 -52.4% 72.6 (218.8) n.m. (+) Non-recurring items 75.6 (53.4) n.m. 74.6 (46.1) n.m. (-) Service Fee - Bank fee slips (3.2) (9.1) -65.3% (19.3) (29.8) -35.3% EBITDA 83.0 (35.4) n.m. 166.5 (235.1) n.m. (+) Depreciation and amortization (53.4) (60.7) -12.0% (203.2) (208.6) -2.6% (+) Equity Pick up (0.3) - n.m. (0.9) - n.m. (+) Financial expenses (111.6) (42.1) 165.1% (309.5) (101.7) n.m. Loss before income tax and social contribution (82.4) (138.2) -40.4% (347.1) (545.3) -36.4% (+) Income tax and social contribution (14.4) (7.5) 92.1% (86.4) 58.7 n.m. Net income / Loss (96.8) (145.8) -33.6% (433.4) (486.6) -10.9% In 4Q22, CVC Corp recorded EBITDA of R$ 83.0 million, vis-à-vis a negative result of R$ 35.4 million in 4Q21, mainly influenced by the control of Operating Expenses and by the positive result of Other Operating Income/Expenses, as described above; while EBITDA for the year reached R$ 166.5 million, i.e., R$ 401.6 million higher than the one recorded in 2021.
  • 25. 8 RESULTS 4Q22 Financial Result R$ million 4Q22 4Q21 ∆ 2022 2021 ∆ Financial expenses (117.4) (81.1) 44.7% (375.5) (205.7) 82.5% Financial charges (53.9) (35.3) 52.7% (198.1) (115.5) 71.5% Interest - receivable prepayment (50.6) (20.8) 143.6% (96.3) (20.8) n.m Service Fee - Bank fee slips (3.2) (9.1) -65.3% (19.3) (29.8) -35.2% Other Financial expenses (9.8) (15.9) -38.7% (61.8) (39.7) 55.7% Financial Income 10.3 22.0 -53.2% 80.3 67.3 19.4% Yield from interest earning bank deposits 17.5 17.1 2.4% 63.6 44.5 42.9% Other Financial Income (7.2) 4.9 n.m 16.7 22.7 -26.6% Exchange rate (hedge) (4.5) 17.0 n.m (14.4) 36.8 n.m Financial Result (111.6) (42.1) 165.1% (309.5) (101.7) n.m The Financial income (loss) totaled a net expense of R$ 111.6 million in 4Q22. The growth compared to 4Q21 is mainly due to the effects of the increase in the average CDI which levies on net debt (from 7.63% p.a. in the 4Q21 to 13.65% p.a. in the 4Q22) and charges on prepayments of receivables and R$ 998.6 million is the amount of prepayments made in this quarter due to a greater need for cash in the period due to business seasonality and operation growth. The exchange change recorded a loss pf R$ 4.5 million in the 4Q22 (which includes mark-to-market of hedge derivatives) against a gain of R$ 17.0 million in 4Q21, due to the result of the mark-to-market change of derivatives, exchange rate change on bank balances and international payments. In YTD, the change in the Financial Income (loss) is mainly linked to: (i) the increase in the average CDI rate for the period on net debt, which went from 4.46% p.a. in 2021 to 12.45% p.a. in 2022, (ii) expenses incurred with prepayments of receivables during 2022 and also (iii) the increase of R$ 22.1 million in Other Financial Expenses compared to 2021, mainly due to increase in interest of acquisitions made in the past and tax on financial operations (IOF). For further details on Financial Income (Loss), see Note 22 of the Financial Statement. As a result of the PERSE Law, the income tax and social contribution rates became zero for operations in Brazil. However, the negative amount of R$ 14.4 million in 4Q22 presented in this line refers mainly to operations abroad and deferred taxes whose realization will occur after the effectiveness of the PERSE Law (Mar/27). Furthermore, there was a reversal of the provision for loss of tax credits in the period on tax losses in one of CVC Corp’s subsidiaries, considering the joining to the Debt Prepayment Program PGFN 8798/2022.3 In YTD, there was a reversal of tax credits constituted, which generated a negative accounting impact of R$ 86.4 million, of which R$ 62.1 million were derecognized in 1Q22, as a result of the PERSE Act [a law that sets out tax incentives for the Events Sector, including hospitality, transportation, restaurants/bars, etc.]. In 2021, on the other hand, the Company still constituted tax credits throughout 1S21, and since 3Q21 no longer it recognized deferred tax credits in the operation in Brazil. For further details on IR/CSLL, see Note 15 of the Financial Statement. In 4Q22, CVC recorded a Net Loss of R$ 96.8 million, 33.6% lower than the amount of R$ 145.8 million recorded in 4Q21, as a result of the improvement in the Operating income (loss). In 2022, the loss recorded was R$ 433.4 million, 10.9% lower than the one reported in 2021 – R$ 486.6 million. 3 Full text in the link: http://normas.receita.fazenda.gov.br/sijut2consulta/link.action?idAto=126532
  • 26. 9 RESULTS 4Q22 Investments (Capex) and Digital Transformation R$ million 4Q22 4Q21 ∆ 2022 2021 ∆ 78.6 60.5 30.0% 244.8 133.6 83.2% Investments made by CVC Corp in 4Q22 totaled R$ 78.6 million and were mainly directed towards the completion of projects focused on digital transformation and also aimed at Information Technology and Security, aligned with the Investment Plan approved in 2021. The main projects were: (i) Atlas, the largest project of digital transformation, is CVC’s customer relationship platform and is already active in all stores in Brazil integrating all channels that serve the brand’s customers. Atlas is an essential pillar in CVC’s goal of moving from just a transactional relationship with the customer to being with them on the full journey. (ii) Clube CVC, CVC’s Loyalty Program allows customers to accumulate points and redeem them for later trips. The program is available on the CVC’s website and app, and is expected to reach the brand’s physical stores from the second quarter of 2023. (iii) Credit Marketplace, which works as a financing center, which allows customers to have several options to finance their trips, being able to pay in up to 24 equal installments with CVC’s partner financial institutions. (iv) New version of the CVC Application has a better navigation usability, including new functions such as hotel check-in via the app and a partner marketplace; (v) Efficiency gain projects: the digital transformation also happens for CVC’s internal teams. As a way to bring more efficiency, transparency and integration to our systems, we have implemented improvements that together allow obtaining productivity gains; (vi) Launch of ConecTaaS, a new platform for integrating APIs, which increases connectivity and facilitates CVC agencies’ access to product sales. The platform is plug-and-play, and functions like a product showcase; (vii) Still under implementation, the integration of operating and back-office systems in B2B, bringing more productivity to agencies, improving the offer of services to travel agents, also promoting operational and back-office improvements; In addition to all these fronts, CVC Corp continues to work on improving information management through datalake and CRM, which currently has more than 34 million registered customers, and it is an essential pillar for us to increase knowledge about our customers, platform and with all sales channels (website, store and app). Lastly, at the end of 2022, the largest and most accelerated investment cycle in the Company’s trajectory ended. For 2023, investments are expected to converge to more usual levels, therefore closer to the Capex maintained by the Company.
  • 27. 10 RESULTS 4Q22 Cash Flow Cash flow from operating activities in the quarter generated R$ 453.0 million, and are impacted by prepayments of receivables that the company realized. In 4Q22, the amount of prepaid receivables amounted to R$ 998.6 million, given the greater need for cash in the period due to the inherent seasonality of the business as well as the growth in operations. Cash, at the end of the quarter, totaled R$ 687.5 million, an amount higher than the minimum cash position (R$ 250.0 million) defined in its cash management policy. At December 31, 2022, the amount of R$ 1,012.4 million in prepaid receivables relates to credit card receivables due in 2023. In 2022, CVC Corp’s cash flow was also composed of (i) investments in the amount of R$ 244.8 million, in line with the Company’s Investment Plan approved in 2021; (ii) capital increase, which resulted in a net cash inflow of R$ 378.2 million, a major reinforcement for financial management that was successfully completed in late June 2022; and (iii) the amortization of R$ 100.0 million of the CVCB 15 debenture, made on June 30. Debt At the end of 2022, the balance in debentures totaled R$ 896.7 million, lower than the R$ 990.1 million reported at the end of 2021, due to the amortization of R$ 100 million last June and roughly half of the gross debt reported at the end of 2019 (pre-pandemic). Since 2020, CVC Corp has been making efforts to better equalize its capital structure and manage its liabilities, which grew rapidly in previous years due to the acquisitions of companies in Brazil and Argentina. In the intervening period, despite the difficulties imposed by Covid-19 on the tourism sector, capital increases (follow-on) were carried out, with a consequent gradual decrease in the Company’s indebtedness. In 2022, efforts were made to fully reorganize the remaining debt. Initially, in the 1st semester of the year, negotiations were carried out for a possible new issuance that would replace the existing series; these were succeeded by a follow-on in the middle of the year that enabled the delivery of several strategic projects and support for working capital. Subsequently, throughout the 2nd semester, new alternatives were assessed by CVC Corp, culminating in the hiring of an external advisor, in January 2023, to conclude negotiations between the Company and debenture holders and to present the Debt Reprofiling Proposal communicated via Material Fact and Notice to Debenture Holders on March 10, 2023. Under the terms presented, the Company reached an agreement with debenture holders representing more than 75% of the outstanding debentures of the 4th issue of each series and 100% of the R$ milhões 4Q22 4Q21 2022 2021 Net Income / Loss before taxes and social contribution (82.4) (138.2) (347.1) (545.3) Non-cash Itens 96.4 69.5 478.7 261.0 Decrease in working capital 439.1 299.9 (13.3) 179.8 Net Cash Flow From Operations 453.0 231.2 118.3 (104.5) Net Cash Flow invested in Investments activities - Capex (78.6) (60.5) (244.8) (133.6) Debentures and loans - - (100.0) (547.7) Capital Increase 0.1 (2.0) 378.2 806.6 Payment of interest (78.0) (37.5) (181.0) (88.1) Acquisition of subsidiaries (8.2) (0.8) (51.6) (39.5) Others (2.8) (2.5) (16.4) (20.7) Net Cash Flow from Financing activities (89.0) (42.8) 29.1 110.6 Exchange-rate change and cash equivalents (0.3) 4.4 (10.9) 12.5 Cash flow 285.2 132.3 (108.3) (115.0) Cash balance in the beginning of the period 402.4 663.5 795.8 910.8 Cash balance in the end of the period 687.5 795.8 687.5 795.8
  • 28. 11 RESULTS 4Q22 outstanding debentures of the 5th issue for the reprofiling of these Debentures, in order to lengthen the profile of its debt, and in the reduction of indebtedness, through the amortization of R$ 124 million upon conclusion of the execution of amendments, to the respective Debenture deeds. The main terms and conditions proposed are summarized in the summary table below.4 Current Amendment Proposed 4th Issue – serie 1 4th Issue – serie 2 5th Issue 4th and 5th Issue Interest Fee CDI + 6% p.a. CDI + 6.5% p.a. CDI + 5.75% p.a. CDI+5.5% p.a. Premium - - - 3.6%, equivalent to the difference between the rate above and CDI+7% p.a., adjusted for PU Interest Payment Semester Semester Quarter Semester Grace period n.m. n.m. n.m. Up to may/24 Payments Initial Amortization - - - R$ 124 million CVCB14: 20% CVCB24: 10% CVCB15: 10% Debt Amortization 04/18/2023 04/18/2024 06/01/2023 Nov/24: 10% 04/18/2025 04/07/2023 Nov/25: 45% Nov/26: 45% Due date 04/18/2023 04/18/2025 06/01/2023 Nov/26 Prepayment Yes Yes Yes prepayment prohibited Convertibility and future capitalization - - - See below Others Covenants Net Debt/Ebitda ≤3.5x Net Debt/Ebitda ≤3.5x Net Debt/Ebitda ≤3.5x Dividend payout: 25% Capex: R$ 125 mi/year Net Debt/EBITDA Dec/23: <=3.5x Mar/25: <=3.0x Mar/26: <=2.5x Warraties - - - 13.3% of the outstanding balance in credit card receivables Negative Pledge - - - Assets > R$ 100 milion Balance Dec/2022 R$ 388.0 R$ 211.7 R$ 297.3 Convertibility and future capitalization5 : a. If the Company raises funds through a capital increase by 11/30/2023 in an amount equal to or greater than R$125 million, the Company will undertake to carry out a tender offer of at least R$75 million for the reprofiled Existing Debentures considered UP Par plus a 3% premium. b. If the Company does not raise funds by means of a capital increase by 11/30/2023 in an amount equal to or greater than R$125 million, the Company undertakes to approve a capital increase, limited to R$ 200 million, in order to capitalize the Debentures, where the price per share will be fixed considering the lowest price between: (i) R$3.50 per share; or (ii) an average discount of 4 It is recommended to read the Material Fact of 03/10/2023 in full, including the attached reprofiling term sheet, available on the Company's website and CVM 5 It is recommended to read the Material Fact of 03/10/2023 in full, including the attached reprofiling term sheet, available on the Company's website and CVM
  • 29. 12 RESULTS 4Q22 20% (twenty percent) on the average closing price of the 30 (thirty) calendar days immediately preceding the date of approval of the capital increase by the Issuer. With the completion of this reprofiling, Management believes that debt maturities will be better balanced with its expected cash flow over the coming years, in such a way as not to compromise its capacity for growth and investment in its operations. Additionally, the Company's gross debt is again reduced and reaches the lowest level since dec/2017. Even though the current debt is consistent with the Company’s size and current moment, it will continue to evaluate possibilities for further debt reductions, depending on how market conditions evolve over the next few years. The implementation of the reprofiling is subject to the agreement of these debenture holders in relation to the final reprofiling documents, as well as their approval at the respective general meetings of debenture holders, being the general meetings of the 4th issue to be held on 04/06/20236 . If completed successfully, the Company's debt will have the following amortization schedule: Current schedule for amortization of debentures R$ million Proposed schedule for amortization of debentures R$ million 6 For further information, access the Call Notice from 03/13/2023
  • 30. 13 RESULTS 4Q22 Annexes Annex 1: Balance sheet (R$ million) Asset 12/31/2022 12/31/2021 Liability 12/31/2022 12/31/2021 Current Assets Current Liabilities Cash & Cash Equivalents 687.5 795.8 Debentures 693.7 218.6 Marketable securities 127.4 190.8 Financial Instruments 2.0 1.8 Derivative Instruments 1.1 - Suppliers 753.4 671.4 Accounts Receivable 515.5 1,092.9 Advanced of travel agreements 1,363.7 2,112.4 Advances to Suppliers 445.1 714.2 Salaries & Social Charges 145.8 138.3 Prepaid Expenses 39.6 37.5 Taxes and social contribution current 3.8 5.2 Recoverable Taxes 80.7 108.0 Taxes Payable and Contribution 66.5 65.8 Other Accounts Receivable 65.6 43.8 Accounts payable from acquisition of subsidiary and investees 22.8 31.5 Total Current Assets 1,962.4 2,982.9 Lease liabilities 16.7 12.8 Other 61.8 101.8 Total Current Liabilities 3,130.4 3,359.7 Non-Current Asset Non-Current Liabilities Prepaid Expenses 23.6 25.8 Debentures 203.0 771.4 Taxes to recover 4.1 - Payable Tax Liabilities 21.2 43.2 Deferred Taxes 555.3 654.7 Provision for Legal Claims 94.8 243.7 Judicial Deposit 135.3 99.7 Accounts payable from acquisition of subsidiary and investees 90.1 97.1 Other 11.1 12.7 Liabilities of leasing 43.6 27.7 Investments 4.5 - Advanced of travel agreements 6.2 25.5 Fixed Assets 36.1 38.2 Other 11.9 13.6 Intangible Assets 1,130.4 1,108.1 Total Non-Current Liabilities 470.7 1,222.2 Right of Use Assets 54.6 34.9 Total Non-Current Assets 1,955.1 1,974.2 Shareholders’ Equity Capital Stock 1,414.0 1,371.7 Capital Reserve 812.6 478.7 Goodwill on Capital Transaction (183.8) (183.8) Other Comprehensive Income (loss) 61.7 63.3 Treasury shares (0.1) (0.1) Retained earnings (1,787.9) (1,354.4) Total Shareholders' Equity 316.5 375.3 Total Asset 3,917.6 4,957.2 Total Liabilities and Shareholders' Equity 3,917.6 4,957.2
  • 31. 14 RESULTS 4Q22 Attachment 2: Statement of income Consolidated Brazil Argentina Consolidated Brazil Argentina R$ million 4Q22 4Q21 4Q22 4Q21 4Q22 4Q21 2022 2021 2022 2021 2022 2021 Net Revenue 321.4 314.0 255.7 262.1 65.7 51.9 1,221.6 825.9 960.3 706.7 261.3 119.1 Sales expenses (41.4) (56.3) (25.4) (35.0) (16.0) (21.2) (194.9) (161.6) (138.2) (105.5) (56.6) (56.1) Estimated loss by recoverable amount (20.7) (8.5) (20.3) (8.2) (0.4) (0.4) (48.4) 1.8 (47.7) 2.8 (0.7) (1.0) General and administrative expenses (302.7) (315.4) (226.4) (262.5) (76.3) (52.9) (1,111.6) (1,009.5) (877.4) (829.0) (234.2) (180.6) General and administrative expenses (249.3) (254.7) (188.8) (227.2) (60.5) (27.6) (908.4) (801.0) (735.2) (704.0) (173.2) (97.0) Depreciation and amortization (53.4) (60.7) (37.6) (35.4) (15.8) (25.3) (203.2) (208.6) (142.2) (125.0) (61.0) (83.6) Equity Pick up (0.3) - (0.3) - - - (0.9) - (0.9) - - - Other operating income/expenses 73.0 (29.9) 36.5 (33.8) 36.5 3.8 96.7 (100.2) 43.8 (108.4) 52.8 8.2 Income (loss) before financial result 29.2 (96.1) 19.7 (77.4) 9.6 (18.8) (37.6) (443.6) (60.1) (333.4) 22.5 (110.3) Financial income/expenses (111.6) (42.1) (110.8) (58.7) (0.8) 16.6 (309.5) (101.7) (292.5) (129.2) (17.0) 27.6 Income (loss) before taxes and social contribution (82.4) (138.2) (91.1) (136.1) 8.8 (2.1) (347.1) (545.3) (352.6) (462.6) 5.5 (82.7) Tax and Social Contribution (14.4) (7.5) (14.2) (2.1) (0.2) (5.4) (86.4) 58.7 (85.2) 61.8 (1.1) (3.1) Current (0.1) 0.8 (0.1) 0.8 (0.0) (0.1) (0.9) 0.6 (0.8) 0.8 (0.0) (0.2) Deferred (14.3) (8.3) (14.1) (2.9) (0.2) (5.4) (85.5) 58.1 (84.4) 61.0 (1.1) (2.9) Net Income (Loss) (96.8) (145.8) (105.3) (138.2) 8.6 (7.6) (433.4) (486.6) (437.8) (400.8) 4.4 (85.8) Attributable to controlling shareholders (96.8) (147.2) (105.3) (138.2) 8.6 (9.0) (433.4) (476.3) (437.8) (401.4) 4.4 (74.9) Attributable to non controlling shareholders - 1.5 - - - 1.5 - (10.3) - 0.6 - (10.9)
  • 32. 15 RESULTS 4Q22 Annex 3: Cash flow - Indirect method R$ million 4Q22 4Q21 2022 2021 Loss before taxes and social contribution (82.4) (138.2) (347.1) (545.3) Adjustments to reconcile income (loss) for the period with cash from operating activities 96.4 69.5 478.7 261.0 Depreciation and amortization 53.4 60.7 203.2 208.6 Impairment loss of accounts receivable 20.7 8.6 48.4 (1.8) Interest and inflation adjustments and exchange-rate changes 79.3 28.6 282.3 83.1 Equity Pickup 0.3 - 0.9 - Provisions for lawsuits and administrative proceedings (63.7) (36.4) (76.4) (61.3) Changes in fair value of the call option - (1.4) - (3.2) Write-off of fixed assets, intangible and lease contracts – IFRS 16 7.2 5.8 17.8 16.2 Other provisions (0.8) 3.6 2.5 19.4 (Increase) / decrease in assets and liabilities 439.1 299.9 (13.3) 179.8 Trade accounts receivable 408.4 442.2 440.8 61.1 Advances to suppliers 231.8 41.8 267.7 117.0 Suppliers 104.3 114.4 92.7 170.0 Advanced travel agreements of tour packages (407.5) (295.6) (755.0) (24.4) Variation of taxes to be recovered and collected 12.4 8.6 19.8 48.2 Settlement of derivative instruments (0.2) 1.4 (16.1) 0.5 Salaries and social charges (10.1) (5.9) 9.2 (8.5) Income tax and social contribution paid (5.2) (0.4) (4.7) (2.0) Provisions for lawsuits and administrative proceedings (30.4) 0.2 (32.9) (1.1) Change in other assets 123.9 (33.4) 15.0 (179.3) Change in other liabilites 11.7 26.7 (35.6) (1.7) Net Cash Flow From Operations 453.0 231.2 118.3 (104.5) Fixed Asset - Property, plant and equipment (1.6) (11.7) (16.2) (12.1) Intangible assets (77.0) (49.6) (223.2) (121.5) Acquisitions of subsidiaries 0.0 0.8 (5.4) - Net Cash Flow invested in Investment activities - Capex (78.6) (60.5) (244.8) (133.6) Raising of debentures and loans - - - 436.4 Settlement of debentures and loans - - (100.0) (984.1) Capital Increase 0.1 (2.0) 378.2 806.6 Interest paid (78.0) (37.5) (181.0) (88.1) Raising/Settlement of derivative instruments - - - (9.8) Exercise of options with the sale of treasury shares - - - - Acquisition of subsidiaries (8.2) (0.8) (51.6) (39.5) Payment of lease - IFRS16 (2.8) (2.5) (16.4) (10.9) Cash flow from Financing activities (89.0) (42.8) 29.1 110.6 Exchange-rate change and cash equivalents (0.3) 4.4 (10.9) 12.5 Increase (decrease) in cash and cash equivalents 285.2 132.3 (108.3) (115.0) Cash balance in the beginning of the period 402.4 663.5 795.8 910.8 Cash balance in the end of the period 687.5 795.8 687.5 795.8
  • 33. 16 RESULTS 4Q22 Annex 4: Representativeness of means of payment in CVC Lazer’s Confirmed Bookings Annex 5: Evolution of the store network 4Q22 3Q22 2Q22 1Q22 4Q21 Brazil 1,111 1,129 1,147 1,158 1,176 CVC 1,059 1,076 1,093 1,103 1,119 Own stores 14 16 16 13 12 New Layout 12 12 12 9 4 Franchises 1,045 1,060 1,077 1,090 1,107 New Layout 29 19 13 6 - Experimento 52 53 54 55 57 Own stores 4 4 4 4 4 Franchises 48 49 50 51 53 Argentina 107 107 98 98 103 Almundo 107 107 98 98 103 Own stores 5 5 7 7 7 Franchises 102 102 91 91 96 Total CVC Corp 1,218 1,236 1,245 1,256 1,279 24% 23% 23% 25% 23% 55% 58% 60% 60% 68% 15% 11% 11% 8% 3% 6% 7% 6% 7% 6% 4Q21 1Q22 2Q22 3Q22 4Q22 Upfront Payment Credit Card Bank Slips CVC Risk
  • 34. 17 RESULTS 4Q22 Glossary B2B: Business unit that has a complete solution for travel agents and their respective corporate customers. Made up of brands: Esferatur, Trend Via, Visual Turismo, RexturAdvance, and VHC. For description of the brands see CVC Brazil. B2C: Business unit focused on the end customer. Made up of brands: CVC, Experimento, Submarino. For description of brands see CVC Brazil. Bibam: Biblos and Avantrip brands. Boarding agreements: Since the beginning of the pandemic, the Company has been offering to reschedule bookings and services that were postponed or the grant of credit for use or discount in future purchases of other bookings or tourism services, according to consumer's own convenience (the amount recorded is net of penalties or fines for cancellation). Pursuant to Explanatory Note 19 of the Company’s Financial Statement. CVC Argentina: Largest travel agency in Argentina, made up of brands Almundo (travel and supplementary service agency), Avantrip (travel and supplementary online platform), Biblos (agency focused on luxury and customized travels) and Ola Transatlantica (trip product and service operator). CVC Brazil:. Include brands CVC (travel and supplementary service agency, Top of Mind in Brazil for the 12th consecutive year), Experimento (student exchange and supplementary service agency), Submarino Viagens (online portal for sale of airline tickets, accommodation, tour packages, car rental and travel insurance), Esferatur (airline and hotel consolidator, also offering car rental), Trend Viagens (hotel consolidator in Brazil and abroad, tour packages, car rental, among others), Visual Turismo (specialized in customized travels, whether leisure, honeymoon, ecotourism, pilgrimage and religious, cruises or incentive), RexturAdvance (airline consolidator for national and international flights) and VHC (house management and rental brand). CVC Corp: Largest tourism agency in Latin America, with operations in Brazil and Argentina, made up of the brands CVC Brazil and CVC Argentina, described above. Financial Expense: Financial expenses mainly regarding the bank loans and fees on financial services, including interest expenses regarding credit card advancements. EBITDA (Earnings Before Interest, Taxes, Depreciation and Amortization): a non-accounting measure prepared by the Company in line with CVM Instruction No. 527, of October 4, 2012 (“CVM Instruction 527"), reconciled with its financial statements and consisting of net profit before the net financial result, excluding the depreciations, amortizations and equity pick up results. Adjusted EBITDA: as demonstrated in this document, is based on the EBITDA, excluding the non-recurring effects of the period and including expenses incurred with the issuance of bank slips (recorded in the Financial Expenses line item). It can also be calculated based on the Net Profit, plus the Net Financial Result, Income Tax and social contribution, and Expenses with depreciation, amortization and equity pick up results, net of the amounts referring to the bank slip fee – Financial and non-recurring expenses. The adjusted EBITDA is not an accounting measure used in the accounting practices adopted in Brazil or the IFRS, and shall not be considered as an alternative to the net profit as an indicator of the operating performance or as an alternative to the cash flow as an indicator of liquidity. Our definition of adjusted EBITDA cannot be compared to adjusted EBITDA as defined by other companies. Non-recurring: The non-recurring effects recorded include basically (i) Impacts regarding COVID-19 (impacts due to the pandemic, which include commissions of stores not recovered by reimbursement, fines, write-off of non-realized revenues and other expenses not related to bookings); (ii) impairment of intangible assets; (iii) contingent liabilities; among others. Net Revenue: the result of intermediation revenues minus the cost of services rendered and taxes on sales, and usually referred as such in the sector. These metrics are reported as Gross Profit in the Financial Statements. Bookings: result of new sales and rescheduling, net of cancellations in the period. Consumed Bookings: Bookings that support the Net Revenue, including online, according to revenue recognition criteria of each brand, namely: CVC in Check-in; Experimento in Check-in; Submarino Viagens airline ticket sale and land + exclusive flights/products (known as charter) in Check-in; RexturAdvance airline ticket sale and land in Check-in; Esferatur in sale; Trend in Check-in; Visual in Check-in and VHC in checkouts carried out. Consumed Bookings Argentina: Bookings for Biblos + Consumed Bookings for Ola Transatlantica. Take rate: significant metrics used in the sector, resulting from the division of net revenue by the Consumed Bookings.