2015 Fact Sheet
•
0 gostou•5,924 visualizações

Check out highlights of our operations and financial results. Petrobras’ Fact Sheet is an annual publication that consolidates the information relative to the fiscal year. In it, you can find the Company’s Profile, Competitive Advantages, Consolidated Financial Results, Operating and Social and Environmental Responsibility Data. The document also features our International Operations, as well as Petrobras’ Business Plan and the Performance of our shares at Bovespa and New York (NYSE).

Recomendados
Mais conteúdo relacionado
Mais procurados
Mais procurados (20)
Destaque
Semelhante a 2015 Fact Sheet
Semelhante a 2015 Fact Sheet (20)
Mais de Petrobras
Mais de Petrobras (19)
Último
Último (20)
2015 Fact Sheet
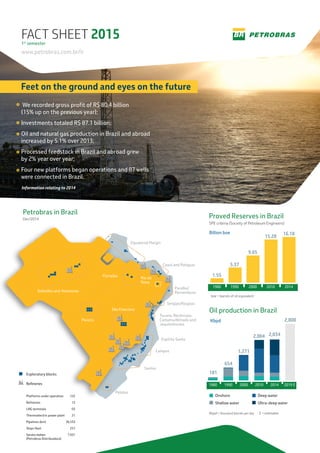
- 1. Proved Reserves in Brazil SPE criteria (Society of Petroleum Engineers) boe = barrels of oil equivalent Oil production in Brazil Kbpd Onshore Shallow water Deep water Ultra-deep water Kbpd = thousand barrels per day E = estimates Platforms under operation Refineries 122 13 LNG terminals 03 Thermoelectric power plant 21 Pipelines (km) 36,533 Ships fleet 257 Servicestation (Petrobras Distribuidora) 7,931 Exploratory blocks Refineries Petrobras in Brazil Dec/2014 Equatorial Margin Ceará and Potiguar Parnaíba Rio do Peixe Solimões and Amazonas Parecis São Francisco Pelotas Santos Campos Espírito Santo Sergipe/Alagoas Paraíba/ Pernambuco Tucano, Recôncavo, Camamu/Almada and Jequitinhonha FACT SHEET 2015 www.petrobras.com.br/ir 1st semester 2,800 1980 1990 2000 2010 2014 2019 E 181 654 1,271 2,004 2,034 Feet on the ground and eyes on the future We recorded gross profit of R$ 80.4 billion (15% up on the previous year); Investments totaled R$ 87.1 billion; Oil and natural gas production in Brazil and abroad increased by 5.1% over 2013; Processed feedstock in Brazil and abroad grew by 2% year over year; Four new platforms began operations and 87 wells were connected in Brazil. Billion boe 1980 1990 2010 20142000 1.55 5.37 15.28 16.18 9.65 Information relating to 2014
- 2. Production Growth and Pre-salt Record We have posted frequent production records in the pre-salt region, underlining the efficiency of our operations and the achievement of solid results. In 2014, we reached the mark of 700,000 barrels produced per day in only eight years after the first discovery of oil in this region. The combination of technologies developed for the exploration of the pre-salt layer won the OTC (Offshore Technology Conference) Award in 2015, the world’s most prestigious award in the offshore oil and gas production sector. This was the third time we received this recognition, reaffirming our ultra-deepwater leadership. Management and Governance The construction of a new management and governance model was the path chosen to confront our challenges, further strengthening our commitment to transparency. With this in mind, we have implemented several initiatives, including the appointment of a new CEO and Executive Board by the Board of Directors and the creation of a Governance, Risk and Compliance Officer, and the election of new members of the Board of Directors. In regard to Operation Lava-Jato, we have been collaborating effectively with the authorities and adopting measures to improve governance, controls and risk management through the creation of internal monitoring committees; the constitution of a special independent committee; the exclusion of the companies cited from future bids; and the adoption of legal measures to ensure restitution of the losses suffered. Consolidated Financial Results US$ Billion Net income Capex and Investments EBITDA Net debt Shareholder’sEquity Net debt / Net Capitalization Net debt / EBITDA 2013 2012 20112014 - 7.36 37.00 24.96 106.20 116.98 48% 4.25 Total 2015-2019 Business and Management Plan Exploration & Production* Downstream** Gas & Energy Other areas US$ 130.3 billion (US$ 108.6 billion) 83% 10% (US$ 12.8 billion) 5% (US$ 6.3 billion) 2% (US$ 2.6 billion) * Includes Petrobras investments abroad ** Includes Distribution Shares quotation * We were the most traded ADRs (American Depositary Receipt) in 2014. 7.547.27 NYSE* (US$ per ADR) Price in 12/31/2014 PBR/APBRTicker 11.03 42.95 27.63 72.34 169.04 30% 2.62 20.10 43.16 37.30 54.90 177.11 24% 1.47 11.09 48.09 29.42 94.57 149.12 39% 3.21