SlideShare uma empresa Scribd logo
1 de 36
Baixar para ler offline
Studying	
  Evolving	
  SoHware	
  Ecosystems
inspired	
  by	
  ecological	
  models
Tom	
  Mens,	
  Maelick	
  Claes
Service	
  de	
  Génie	
  Logiciel
Philippe	
  Grosjean
Service	
  d’écologie	
  numérique	
  des	
  milieux	
  aqua@ques
informa@que.umons.ac.be/genlog/projects/ecos
9	
  July	
  2013	
  -­‐	
  SATToSE,	
  Bern
Collaborators
2
?
9	
  July	
  2013	
  -­‐	
  SATToSE,	
  Bern
Long-­‐term	
  goals
• Determine the main factors that drive the success or
failure of OSS projects within their ecosystem
• Investigate new techniques and mechanisms to predict
and improve survivability of OSS projects
– Inspired by research in biological ecology
• Use these insights to help
– the developer community to improve upon their
practices
– companies and users to compare and adopt OSS
projects
3
9	
  July	
  2013	
  -­‐	
  SATToSE,	
  Bern 4
Standing	
  on	
  the	
  shoulders	
  of	
  giants
Lamarck
Lotka
Volterra
Darwin
Pareto
9	
  July	
  2013	
  -­‐	
  SATToSE,	
  Bern 5
Terminology
Biological	
  ecosystem
Defini@ons
• Ecology:	
  the	
  scien)fic	
  study	
  of	
  the	
  
interac)ons	
  that	
  determine	
  the	
  
distribu)on	
  and	
  abundance	
  of	
  
organisms
• Ecosystem:	
  the	
  physical	
  and	
  
biological	
  components	
  of	
  an	
  
environment	
  considered	
  in	
  rela)on	
  
to	
  each	
  other	
  as	
  a	
  unit
– combines	
  all	
  living	
  organisms	
  
(plants,	
  animals,	
  micro-­‐
organisms)	
  and	
  physical	
  
components	
  (light,	
  water,	
  soil,	
  
rocks,	
  minerals)
Example:	
  coral	
  reefs
• High	
  biodiversity:	
  polyps,	
  sea	
  
anemones,	
  fish,	
  mollusks,	
  
sponges,	
  algae
9	
  July	
  2013	
  -­‐	
  SATToSE,	
  Bern 6
Terminology
SoHware	
  ecosystem
Business-­‐oriented	
  view
• “a	
  set	
  of	
  actors	
  func)oning	
  as	
  a	
  unit	
  
and	
  interac)ng	
  with	
  a	
  shared	
  market	
  
for	
  so<ware	
  and	
  services,	
  together	
  
with	
  the	
  rela)onships	
  among	
  
them.”	
  (Jansen	
  et	
  al.	
  2009)
Examples
• Eclipse
• Android	
  and	
  iOS	
  app	
  store
9	
  July	
  2013	
  -­‐	
  SATToSE,	
  Bern 7
SoHware	
  ecosystem
Development-­‐centric	
  view
• “a	
  collec)on	
  of	
  so<ware	
  
products	
  that	
  have	
  some	
  
given	
  degree	
  of	
  symbio)c	
  
rela)onships.”
(MesserschmiK	
  &	
  Szyperski	
  2003)
• “a	
  collec)on	
  of	
  so<ware	
  
projects	
  that	
  are	
  developed	
  
and	
  evolve	
  together	
  in	
  the	
  
same	
  environment.”
(Lungu	
  2008)
Examples
• Gnome
KDE
• Debian
Ubuntu
• R’s	
  CRAN
• Apache
9	
  July	
  2013	
  -­‐	
  SATToSE,	
  Bern 8
Comparison
Biological	
  evolu@on
AND	
  BY	
  A	
  
DUMMY
9	
  July	
  2013	
  -­‐	
  SATToSE,	
  Bern 10
Ecological	
  theories	
  of
evolu@on	
  of	
  species
• Lamarckism
-­‐	
  animal	
  organs	
  and	
  behaviour	
  can	
  
change	
  according	
  to	
  the	
  way	
  they	
  are	
  
used
-­‐	
  those	
  characteris@cs	
  can	
  transmit	
  
from	
  one	
  genera@on	
  to	
  the	
  next	
  to	
  
reach	
  a	
  greater	
  level	
  of	
  perfec@on
• Example
-­‐	
  giraffe’s	
  necks	
  have	
  become	
  longer	
  
while	
  trying	
  to	
  reach	
  the	
  upper	
  leaves	
  
of	
  a	
  tree
Jean-­‐Bap@ste	
  Lamarck
(1744–1829)
9	
  July	
  2013	
  -­‐	
  SATToSE,	
  Bern 11
Ecological	
  theories	
  of
evolu@on	
  of	
  species
• Darwinism
-­‐	
  all	
  species	
  of	
  life	
  have	
  descended	
  
over	
  @me	
  from	
  common	
  ancestors
-­‐	
  this	
  branching	
  padern	
  of	
  evolu@on	
  
resulted	
  from	
  natural	
  selec@on,	
  similar	
  
to	
  ar@ficial	
  selec@on	
  in	
  selec@ve	
  
breeding
• Example
– 13	
  types	
  of	
  Galapagos	
  finches,	
  
same	
  habits	
  and	
  characteris@cs,	
  
but	
  different	
  beaks
Charles	
  Darwin
(1809–1882)
9	
  July	
  2013	
  -­‐	
  SATToSE,	
  Bern 12
Ecological	
  theories	
  of
evolu@on	
  of	
  species
Hologenome	
  theory
• The	
  unit	
  of	
  natural	
  selec@on	
  
is	
  the	
  holobiont:	
  the	
  
organism	
  together	
  with	
  its	
  
associated	
  microbial	
  
communi@es,	
  that	
  live	
  
together	
  in	
  symbiosis.
• The	
  holobiont	
  can	
  adapt	
  to	
  
changing	
  environmental	
  
condi@ons	
  far	
  more	
  rapidly	
  
than	
  by	
  gene@c	
  muta@on	
  
and	
  selec@on	
  alone.
Compe@@on	
  vs	
  coopera@on
• While	
  Darwin’s	
  theory	
  
emphasises	
  compe))on	
  
(survival	
  of	
  the	
  fidest),	
  
hologenome	
  theory	
  also	
  
includes	
  coopera)on	
  
(through	
  symbiosis)
9	
  July	
  2013	
  -­‐	
  SATToSE,	
  Bern 13
Evolu@on	
  History
Ecology
Darwin	
  (1837)• Evolu@on	
  history	
  of	
  species	
  can	
  be	
  
represented	
  by	
  a	
  phylogene)c	
  tree.
• Describes	
  the	
  evolu@onary	
  
rela@onships	
  among	
  species	
  
assuming	
  that	
  they	
  share	
  a
common	
  ancestor.
9	
  July	
  2013	
  -­‐	
  SATToSE,	
  Bern 14
Evolu@on	
  History
Ecology
Re$culate	
  evolu$on
• Unlike	
  in	
  Darwinian	
  model,	
  
evolu@on	
  history	
  is	
  represented	
  
using	
  a	
  graph	
  structure
• When	
  re@cula@on	
  of	
  species	
  
occurs,	
  two	
  or	
  more	
  
evolu@onary	
  lineages	
  are	
  
combined	
  at	
  some	
  level	
  of	
  
biological	
  organiza@on.
• Causes
– hybrid	
  specia)on	
  (two	
  lineages	
  
recombine	
  to	
  create	
  a	
  new	
  one)	
  
– horizontal	
  gene	
  transfer	
  (genes	
  
are	
  transferred	
  across	
  species)
9	
  July	
  2013	
  -­‐	
  SATToSE,	
  Bern 15
Evolu@on	
  History
SoHware
9	
  July	
  2013	
  -­‐	
  SATToSE,	
  Bern 16
Trophic	
  web	
  (food	
  chain)
in	
  natural	
  ecosystems
9	
  July	
  2013	
  -­‐	
  SATToSE,	
  Bern 17
Trophic	
  web	
  in
soHware	
  ecosystems
Producer-­‐consumer	
  rela@on
Users
Peripheral	
  
developers
Core	
  developers
Onion	
  model
TOP-­‐DOWN
change	
  requests	
  
&	
  bug	
  reports
BOTTOM-­‐UP
changes	
  in	
  core	
  
projects	
  and	
  
architecture	
  
9	
  July	
  2013	
  -­‐	
  SATToSE,	
  Bern 18
Core	
  Architecture	
  -­‐	
  or
Why	
  developers	
  are	
  polyps
Coral	
  reef	
  ecosystem
• Sclerac)nian	
  coral	
  polyps	
  are	
  
responsible	
  for	
  crea@ng	
  the	
  
coral	
  reef	
  structure
• This	
  coral	
  reef	
  is	
  required	
  for	
  
the	
  other	
  species	
  of	
  the	
  
ecosystem	
  to	
  thrive.
SoHware	
  ecosystem
• Core	
  developers	
  are	
  
responsible	
  for	
  crea@ng	
  the	
  
core	
  soHware	
  architecture
• Based	
  on	
  this	
  core	
  
architecture,	
  other	
  
developers	
  and	
  third	
  par@es	
  
can	
  create	
  other	
  projects,	
  
services,	
  and	
  so	
  on.
9	
  July	
  2013	
  -­‐	
  SATToSE,	
  Bern 19
Ecosystem	
  Dynamics
Predator-­‐prey	
  rela@onship
• An	
  instance	
  of	
  the	
  
consumer-­‐resource	
  
rela@onship
• Predators	
  (hun@ng	
  animals)	
  
feed	
  upon	
  their	
  prey	
  
(adacked	
  animals)
Dynamic	
  model
• Two	
  mutually	
  dependent	
  
parametric	
  differen@al	
  
equa@ons
(Lotka-­‐Volterra	
  1925/1926)
9	
  July	
  2013	
  -­‐	
  SATToSE,	
  Bern 20
SoHware	
  Ecosystem
Dynamics
Analogies	
  based	
  on	
  predator-­‐prey	
  rela$onship
• Debuggers	
  are	
  predators,	
  soHware	
  defects	
  are	
  prey
[Calzolari	
  et	
  al.	
  Maintenance	
  and	
  tes)ng	
  effort	
  modeled	
  by	
  linear	
  and	
  
nonlinear	
  dynamic	
  systems,”	
  Informa)on	
  and	
  So<ware	
  Technology,	
  43(8):	
  
477	
  –	
  486,	
  2001]
• Developers	
  are	
  predators,	
  the	
  informa@on	
  they	
  seek	
  is	
  prey
[Lawrance	
  et	
  al.	
  	
  Scents	
  in	
  programs:	
  Does	
  informa)on	
  foraging	
  theory	
  
apply	
  to	
  program	
  maintenance?	
  VL/HCC	
  2007,	
  pp.	
  15–22]
9	
  July	
  2013	
  -­‐	
  SATToSE,	
  Bern 21
SoHware	
  Ecosystem
Dynamics
Analogies	
  based	
  on	
  predator-­‐prey	
  rela$onship
• Dual	
  views	
  in	
  a	
  soHware	
  
ecosystem
– Developers	
  are	
  predators,	
  the	
  
projects	
  they	
  work	
  on	
  are	
  prey
– Projects	
  are	
  predators	
  that	
  feed	
  
upon	
  the	
  cogni@ve	
  resources	
  of	
  
their	
  developers
Bipar@te	
  developer-­‐project	
  graph
project	
  1
project	
  2
project	
  3
9	
  July	
  2013	
  -­‐	
  SATToSE,	
  Bern
• Stability:	
  the	
  capacity	
  to	
  maintain	
  
an	
  equilibrium	
  over	
  longer	
  
periods	
  of	
  @me
• Resistance:	
  the	
  ability	
  to	
  
withstand	
  environmental	
  changes	
  
without	
  too	
  much	
  disturbances	
  of	
  
its	
  biological	
  communi@es
• Resilience:	
  the	
  ability	
  to	
  return	
  to	
  
an	
  equilibrium	
  aHer	
  a	
  disturbance
• Higher	
  biodiversity	
  favours	
  these	
  
characteris@cs
Other	
  desirable	
  ecosystem	
  
characteris@cs
22
Defining and Evaluating a Measure
of Open Source Project Survivability
Uzma Raja, Member, IEEE Computer Society, and Marietta J. Tretter
Abstract—In this paper, we define and validate a new multidimensional measure of Open Source Software (OSS) project survivability,
called Project Viability. Project viability has three dimensions: vigor, resilience, and organization. We define each of these dimensions
and formulate an index called the Viability Index (V I) to combine all three dimensions. Archival data of projects hosted at
SourceForge.net are used for the empirical validation of the measure. An Analysis Sample (n ¼ 136) is used to assign weights to each
dimension of project viability and to determine a suitable cut-off point for V I. Cross-validation of the measure is performed on a hold-
out Validation Sample (n ¼ 96). We demonstrate that project viability is a robust and valid measure of OSS project survivability that can
be used to predict the failure or survival of an OSS project accurately. It is a tangible measure that can be used by organizations to
compare various OSS projects and to make informed decisions regarding investment in the OSS domain.
Index Terms—Evaluation framework, external validity, open source software, project evaluation, software measurement, software
survivability.
Ç
1 INTRODUCTION
OPEN Source Software (OSS) projects are developed and
distributed for free, with full access to the project
source code. Recently there has been a significant increase
in the use of these projects. Some OSS projects have earned
themselves a high reputation and corporate sponsorships.
Large corporations (e.g., IBM, SUN microsystems) are
becoming involved with the OSS movement in various
capacities. Projections indicate that the corporate interest in
OSS projects will grow stronger in the future [1] and these
projects will see integration in enterprise architecture [2].
This increased use of OSS projects creates the need for
better project evaluation measures.
Traditionally, software projects are evaluated by con-
formance to budget, schedule, and user requirements [3], [4],
[5], [6], [7], [8]. These measures, however, are difficult to
map to OSS projects, which are developed through a
network of volunteer participants, with no defined budget,
schedule, or customer. Although there is a surge in the
investment in OSS projects [1], research indicates that a large
number of OSS projects fail [9], [10]. Some have questioned
the operational reliability and quality of OSS projects [11].
Since there are no contractual or legal bindings for providing
OSS updates or maintenance services, businesses investing
human or financial capital on adoption of OSS projects need
the ability to evaluate whether the project will continue to
exist or not [12]. Development teams need to measure
project survivability to control and improve performance.
Individual and corporate users need a measure of project
survivability to compare the available OSS projects before
making decisions regarding project adoption.
In this paper, we define and validate a new multi-
dimensional measure of OSS project survivability, called
Project Viability. OSS projects provide access to their
development archives, thereby providing a unique oppor-
tunity to conduct empirical research [13] and develop
reliable measures [14], [15]. In the following sections, we
define, formulate, and validate project viability. Section 2
provides a brief overview of the existing empirical research
in OSS and the background of project survivability. Section 3
defines the dimensions of project viability and formulates
an index to measure it. Section 4 discusses the empirical
evaluation framework and validates the new measure using
OSS project data. Discussion of the results is presented in
Section 5 and conclusions are given Section 6.
2 BACKGROUND
A large number of OSS projects are available for use.
However, the failure rate of these projects is high [9]. The
evaluation of OSS projects is different than Commercial
Software Systems (CSS) [16]. The adopters of OSS projects
need a mechanism to compare the chances of failure or
survival of the available projects. This would allow better
decisions regarding corporate resource investment.
A range of measures has been used in prior research to
evaluate OSS projects. Godfrey and Tu [17] examined the
evolution of the Linux kernel and its growth pattern in one
IEEE TRANSACTIONS ON SOFTWARE ENGINEERING, VOL. 38, NO. 1, JANUARY/FEBRUARY 2012 163
. U. Raja is with the Department of Information Systems, Statistics and
Management Science, The University of Alabama, Box #870226,
300 Campus Drive, Tuscaloosa, AL 35487. E-mail: uraja@cba.ua.edu.
. M.J. Tretter is with the Department of Information and Operations
Management, Texas A&M University, Mail Stop #310D, Wehner
9	
  July	
  2013	
  -­‐	
  SATToSE,	
  Bern
Measuring	
  diversity
Based on Shannon’s notion of
entropy and 2nd law of
thermodynamics
Species diversity
X = set of n distinct species xi
p(xi) = proportion of all individuals
that belong to species xi
23
Ecosystem	
  Biodiversity
• Biodiversity:	
  The	
  degree	
  of	
  
varia@on	
  of	
  species	
  within	
  a	
  
given	
  ecosystem
• Interpreta@on
-­‐	
  Maximum	
  diversity	
  if	
  all	
  species	
  
have	
  same	
  number	
  of	
  individuals
-­‐	
  Low	
  diversity	
  if	
  a	
  par@cular	
  
species	
  dominates	
  the	
  others
€
H(X) = − p(xi)ln p(xi)
i=1
n
∑
9	
  July	
  2013	
  -­‐	
  SATToSE,	
  Bern 24
Evolu@on	
  of	
  diversity	
  in	
  open	
  source	
  soHware
Econometric	
  indices
• Gini	
  and	
  Theil	
  are	
  measures	
  
of	
  inequality	
  in	
  a	
  distribu@on
Moreover, C# and Java are very closely related and we
therefore asked ourselves whether programs written in C#
exhibit distribution profiles similar to the ones we observed
in Java. Unfortunately, the number of freely-available,
open-source systems developed in C# framework that met
our selection criteria is rather limited. So, we began our
study with systems that were originally written in Java and
had been ported to the .NET platform in order to take ad-
vantage from the knowledge gained in the analysis of their
respective Java counterparts.
For the .NET metrics extraction, we used CLI [18], an
assembly reader library that provides access to both the
metadata and byte code. We added a small wrapper for the
computation of the Gini coefficients and stored the resulting
data in a text file for further processing with JSeat.
We collected metrics data from four .NET systems:
iTextSharp, NHibernate, SharpDevelop, and NAnt. The
analysis of our 10 measures produced Gini coefficients
equivalent to the ones determined for Java systems. How-
ever, there were also exceptions. We observed a shift ex-
ceeding 0.4 (i.e., individual Gini coefficients doubled in
value) for almost all measures in NAnt version 0.8.3-rc1.
The Gini coefficients stayed high until version 0.84-rc1,
where they assumed “normal” values again. An inspection
of the developer logs provided an explanation: in version
0.8.3-rc1, the NAntContrib project was integrated into the
NAnt distribution. This project defines a number of utili-
ties whose metrics exhibit very uneven distribution profiles
caused by a centralization of event handling in a few classes.
In version 0.84-rc1, the developers removed NAntContrib
from NAnt resulting in a change by 0.4, returning the Gini
coefficients for NAnt to their previous values.
We discovered in our analysis that Gini coefficients nor-
mally change little between adjacent releases. However,
changes do happen and may result in significant fluctua-
tions in Gini coefficients that warrant a deeper analysis (see
Figure 4 showing selected Gini profiles for 51 consecutive
releases of the Spring framework). But why do we see such
a remarkable stability of Gini coefficients?
Figure 4. Selected Gini profiles in Spring.
Developers accumulate system competence over time.
Proven techniques to solve a given problem prevail, where
untested or weak practices have little chance of survival.
If a team has historically built software in a certain way,
then it will continue to prefer a certain approach over oth-
ers. Moreover, we can expect that most problems in a given
domain are similar, hence the means taken to tackle them
would be similar, too. Tversky and Kahneman coined the
term “decision frame” [27] to refer to this principle in which
decision-makers proactively organize their solutions within
well-established and strong boundaries defined by cultural
environment and personal preferences. These boundaries
184
Comparative Analysis of Evolving Software Systems Using the Gini Coefficient
Rajesh Vasa, Markus Lumpe, Philip Branch
Faculty of Information & Communication Technologies
Swinburne University of Technology
P.O. Box 218, Hawthorn, VIC 3122, AUSTRALIA
{rvasa,mlumpe,pbranch}@swin.edu.au
Oscar Nierstrasz
Institute of Computer Science
University of Bern
Bern, CH-3012, SWITZERLAND
oscar@iam.unibe.ch
Abstract
Software metrics offer us the promise of distilling useful
information from vast amounts of software in order to track
development progress, to gain insights into the nature of the
software, and to identify potential problems. Unfortunately,
however, many software metrics exhibit highly skewed, non-
Gaussian distributions. As a consequence, usual ways of
interpreting these metrics — for example, in terms of “av-
erage” values — can be highly misleading. Many metrics,
it turns out, are distributed like wealth — with high concen-
trations of values in selected locations. We propose to an-
alyze software metrics using the Gini coefficient, a higher-
order statistic widely used in economics to study the dis-
tribution of wealth. Our approach allows us not only to
observe changes in software systems efficiently, but also to
assess project risks and monitor the development process it-
self. We apply the Gini coefficient to numerous metrics over
a range of software projects, and we show that many met-
rics not only display remarkably high Gini values, but that
these values are remarkably consistent as a project evolves
over time.
tions is to identify a number of characterizing properties,
collect corresponding software metrics, and render the ob-
tained data into meaningful information that can assist both
developers and project managers in their decision making
[13, 27]. Unfortunately, software metrics data are, in gen-
eral, heavily skewed [7,12,30], which makes precise inter-
pretation with standard descriptive statistical analysis diffi-
cult. Summary measures like “average” or “mean” assume
a Gaussian distribution to capture the central tendency in a
given data set. However, when applied to non-Gaussian dis-
tributions, central tendency measures become increasingly
more unreliable the greater the distance is between a given
distribution and a normal distribution.
The shortcomings of central tendency measures are am-
plified when we wish to compare skewed distributions. Any
meaningful comparison requires additional effort to fit the
distributions in question to a specially-designed third model
distribution [1, 26]. This transformation is not only cum-
bersome but also expensive and may not yield the desired
result. Moreover, additional problems may arise due to
changes in both the degree of concentration of individual
values and and the total value of a distribution. Consider, for
Gini	
  =	
  A/(A+B)
9	
  July	
  2013	
  -­‐	
  SATToSE,	
  Bern
Evolu@on	
  of	
  diversity	
  in	
  open	
  source	
  soHware
Econometric	
  indices
Commits	
  sent
E-­‐mails	
  sent
Bug	
  reports	
  modified
Evince
25
-­‐	
  Theil	
  index
Corresponds	
  to	
  Shannon’s	
  no@on	
  of	
  entropy
	
  
Evidence for the Pareto principle
in Open Source Software Activity
Mathieu Goeminne and Tom Mens
Institut d’Informatique, Facult´e des Sciences
Universit´e de Mons – UMONS
Mons, Belgium
{ mathieu.goeminne | tom.mens }@umons.ac.be
Abstract—Numerous empirical studies analyse evolving open
source software (OSS) projects, and try to estimate the activity
and effort in these projects. Most of these studies, however, only
focus on a limited set of artefacts, being source code and defect
data. In our research, we extend the analysis by also taking into
account mailing list information. The main goal of this article
is to find evidence for the Pareto principle in this context, by
studying how the activity of developers and users involved in
OSS projects is distributed: it appears that most of the activity
is carried out by a small group of people. Following the GQM
paradigm, we provide evidence for this principle. We selected
a range of metrics used in economy to measure inequality in
distribution of wealth, and adapted these metrics to assess how
OSS project activity is distributed. Regardless of whether we
analyse version repositories, bug trackers, or mailing lists, and
for all three projects we studied, it turns out that the distribution
of activity is highly imbalanced.
Index Terms—software evolution, activity, software project,
data mining, empirical study, open source software, GQM, Pareto
I. INTRODUCTION
Numerous empirical studies aim to understand and model
how open source software (OSS) evolves over time [1]. In
order to gain a deeper understanding of this evolution, it
is essential to study not only the software artefacts that
evolve (e.g. source code, bug reports, and so on), but also
their interplay with the different project members (mainly
developers and users) that communicate (e.g., via mailing lists)
and collaborate in order to construct and evolve the software.
In this article, we wish to understand how activity is spread
over the different members of an OSS project, and how this
activity distribution evolves over time. Our hypothesis is that
the distribution of activity follows the Pareto principle, in the
sense that there is a small group of key persons that carry
out most of the activity, regardless of the type of considered
activity. To verify this hypothesis, we carry out an empirical
study based on the GQM paradigm [2]. We rely on concepts
borrowed from econometrics (the use of measurement in
economy), and apply them to the field of OSS evolution.
In particular, we apply indices that have been introduced
for measuring distribution (and inequality) of wealth, and
use them to measure the distribution of activity in software
development.
The remainder of this paper is structured as follows. Sec-
tion II explains the methodology we followed and defines
the metrics that we rely upon. Section III presents the ex-
perimental setup of our empirical study that we have carried
out. Section IV presents the results of our analysis of activity
distribution in three OSS projects. Section V discusses the
evidence we found for the Pareto principle. Section VI presents
related work, and Section VII concludes.
II. METHODOLOGY
A. GQM paradigm
To gain a deeper understanding of how OSS projects evolve,
we follow the well-known Goal-Question-Metric (GQM)
paradigm. Our main research Goal is to understand how ac-
tivity is distributed over the different stakeholders (developers
and users) involved in OSS projects. Once we have gained
deeper insight in this issue, we will be able to exploit it to
provide dedicated tool support to the OSS community, e.g.,
by helping newcomers to understand how the community is
structured, by improving the way in which the community
members communicate and collaborate, by trying to reduce
the potential risk of the so-called bus factor1
, and so on.
To reach the aforementioned research goal, we raise the
following research Questions:
1) Is there a core group of OSS project members (develop-
ers and/or users) that are significantly more active than
the other members?
2) How does the distribution of activity within an OSS
community evolve over time?
3) Is there an overlap between the different types of activity
(e.g., committing, mailing, submitting and changing bug
reports) the community members contribute to?
4) How does the distribution of activity vary across differ-
ent OSS projects?
As a third step, we need to select appropriate Metrics that
will enable us to provide a satisfactory answer to each of the
above research questions. For our empirical study, we will
make use of basic metrics to compute the activity of OSS
project members, and aggregate metrics that allow us to com-
pare these basic metric values across members (to understand
how activity is distributed), over time (to understand how they
1The bus factor refers to the total number of key persons (involved in the
project) that would, if they were to be hit by a bus, lead the project into
serious problems
Brasero
9	
  July	
  2013	
  -­‐	
  SATToSE,	
  Bern 26
SoHware	
  Ecosystem	
  Biodiversity
• Uses	
  no@on	
  of	
  biodiversity	
  to	
  
measure	
  developer	
  ac)vity	
  focus	
  
and	
  module	
  ac)vity	
  focus
Cf.	
  bipar@te	
  author-­‐module	
  graph
• Based	
  on	
  no@on	
  of	
  rela)ve	
  entropy
• More	
  details:	
  see	
  results	
  of	
  
hackaton.
Dual Ecological Measures of Focus
in Software Development
Daryl Posnett†, Raissa D’Souza∗, Premkumar Devanbu,† and, Vladimir Filkov†
†∗University of California Davis, USA
†{dpposnett,ptdevanbu,vfilkov}@ucdavis.edu,∗raissa@cse.ucdavis.edu
Abstract—Work practices vary among software developers.
Some are highly focused on a few artifacts; others make wide-
ranging contributions. Similarly, some artifacts are mostly au-
thored, or “owned”, by one or few developers; others have very
wide ownership. Focus and ownership are related but different
phenomena, both with strong effect on software quality. Prior
studies have mostly targeted ownership; the measures of own-
ership used have generally been based on either simple counts,
information-theoretic views of ownership, or social-network views
of contribution patterns. We argue for a more general concep-
tual view that unifies developer focus and artifact ownership.
We analogize the developer-artifact contribution network to a
predator-prey food web, and draw upon ideas from ecology to
produce a novel, and conceptually unified view of measuring
focus and ownership. These measures relate to both cross-entropy
and Kullback-Liebler divergence, and simultaneously provide
two normalized measures of focus from both the developer and
artifact perspectives. We argue that these measures are theoret-
ically well-founded, and yield novel predictive, conceptual, and
actionable value in software projects. We find that more focused
developers introduce fewer defects than defocused developers. In
contrast, files that receive narrowly focused activity are more
likely to contain defects than other files.
I. INTRODUCTION
Developers are the lifeblood of open source software, OSS,
and their contributions are vital for OSS to thrive. Rather
than being assigned tasks by management, OSS developers are
generally free to choose the style, focus, and breadth of their
contributions. Some might be quite focused, working on one
specific subsystem; others may contribute to many different
subsystems. An device driver expert, for example, may con-
tribute very specialized knowledge to an open source project,
focusing on only a few files or packages. His contributions to a
small subset of modules1
may be his only contribution during
his tenure with the project. In contrast, a project leader may
work on a variety of different tasks touching many modules
within a project. While OSS developers are free to choose
their contribution styles, such choices are not inconsequential,
especially to the central issue of software quality.
A dominant theme emerging from previous work in this
area is module ownership [1], [2], [3]. Low ownership of a
module, i.e., too many contributors, can adversely impact code
quality. There is, however, an entirely different perspective,
developer’s attention focus, which is relatively unexplored.
Human attention and cognition are finite resoucres [4]. When
different tasks are simultaneously engaged, they can compete
1We use modules to mean either packages or files, depending on the context.
for mental resources and task performance can suffer [5]. A
developer engaged in many different tasks carries a greater
cognitive burden than a more focused developer. Interestingly,
the developer and module perspectives are, conceptually sym-
metric, dualistic views of focus. From a module’s perspective,
strong ownership indicates a strong focused contribution. We
refer to this as module activity focus, or MAF, a measure of
how focused the activities are on a module. Symmetrically, we
refer to the developer’s attention focus, or DAF, a measure
of how focused the activities are of a particular developer.
A surprising, but natural analogy for MAF and DAF, are
predator-prey food webs from ecology. In a sense, modules
are predators that “feed upon” the cognitive resources of
developers. As the number of developers contributing to a
module increases, the diversity of cognitive resources upon
which the module “feeds” also increases; likewise, a developer
is a “prey” whose limited cognitive resources are spread over
the modules that “prey” upon her.
Ecosystem diversity is of great interest to ecologists.
Williams and Martinez call the roles complexity and diversity
play “[o]ne of the most important and least settled questions
in ecology.” [6] This diversity has two symmetric perspectives,
both from a prey’s perspective, and a predator’s perspective.
Ecologists have developed sophisticated symmetric measures
of predator-prey relationships, drawing upon ideas such as
entropy and Kulback-Leibler divergence, that simultaneously
capture both perspectives. We adapt these measures for soft-
ware engineering projects into the metrics MAF and DAF.
In this work, we employ the methodology presented by El
Emam to validate our measures [7]. In particular, we show
that the DAF and MAF measures succeed in distinguishing
important cases that extant measures don’t capture. We make
the following contributions:
• We adapt terminology and motivation from ecology,
based on bipartite graphs;
• We incorporate and generalize previous results on devel-
oper and artifact diversity;
• We provide easy to compute measures of focus, MAF
and DAF, normalized to facilitate comparison within and
across projects;
• We show these measures more precisely capture out-
comes relevant to software researchers and practitioners.
This novel analysis simultaneously considers focus both
from the artifact perspective and the author perspective.
Researchers can use our MAF and DAF metrics to more
978-1-4673-3074-9/13/$31.00 c 2013 IEEE ICSE 2013, San Francisco, CA, USA452
ICSE	
  
2013
Migra@on	
  in	
  soHware	
  ecosystems
Gnome	
  case	
  study
9	
  July	
  2013	
  -­‐	
  SATToSE,	
  Bern 28
Migra@on	
  in	
  soHware	
  ecosystems
• How	
  do	
  soHware	
  projects	
  evolve?
– Analogy	
  to	
  “gene	
  transfer”	
  in	
  re@culate	
  evolu@on
• Transfer	
  of	
  knowledge
– Sharing	
  or	
  migra@on	
  of	
  contributors	
  across	
  projects
• Transfer	
  of	
  code
– Copy-­‐paste	
  reuse	
  and	
  code	
  cloning
– Branching	
  and	
  merging	
  of	
  code	
  repositories
C
Java
Objective C
Python
Lisp
JS
ASP.Net
C/C++ Header
C++
Perl
yacc
C#
IDL
Haskell
Objective C++
lexAssembly
Visual Basic
PHP
Ruby
Tcl/Tk
1e+05
1e+07
100 1000 10000
Files
LOC
9	
  July	
  2013	
  -­‐	
  SATToSE,	
  Bern
Migra@on	
  in	
  soHware	
  ecosystems
Gnome	
  case	
  study
29
• 16	
  years	
  of	
  ac@vity
• >	
  1400	
  projects
• >	
  5800	
  contributors	
  (>	
  4300	
  coders)
• >	
  1.3M	
  of	
  commits	
  (>	
  0.6M	
  of	
  code	
  commits)
• >	
  12M	
  of	
  file	
  touches	
  (>	
  6M	
  of	
  codefile	
  touches)
9	
  July	
  2013	
  -­‐	
  SATToSE,	
  Bern
Migra@on	
  in	
  soHware	
  ecosystems
Gnome	
  case	
  study
30
Hierarchical	
  clustering	
  of	
  projects
Developers	
  tend	
  to	
  collaborate	
  more	
  if	
  they	
  use	
  the	
  same	
  programming	
  language
9	
  July	
  2013	
  -­‐	
  SATToSE,	
  Bern
Migra@on	
  in	
  soHware	
  ecosystems
Gnome	
  case	
  study
31
Time
Joiners
1997 1999 2001 2003 2005 2007 2009 2011 2013
05101520253035
9	
  July	
  2013	
  -­‐	
  SATToSE,	
  Bern 32
Migra@on	
  in	
  soHware	
  ecosystems
Gnome	
  case	
  study
Evolu@on Gimp GTK+
joiners are incoming coders in the considered project that were not active in any
of the GNOME projects during the preceding period. A similar definition holds for
the local and global leavers. Formally, the metrics are defined as follows. Let p be
a GNOME project, t a 6-month activity period (and t 1 the previous period), c a
coder, Gnome the set of GNOME’s code projects, and isDev(c,t, p) is a predicate
which is true if and only if c made a code commit in p during t:
localLeavers(p,t) =
{c|isDev(c,t 1, p)^¬isDev(c,t, p)^9p2 (p2 2 Gnome^isDev(c,t, p2))}
globalLeavers(p,t) =
{c|isDev(c,t 1, p)^8p2 (p2 2 Gnome ) ¬isDev(c,t, p2))}
localJoiners(p,t) =
{c|isDev(c,t, p)^¬isDev(c,t 1, p)^9p2 (p2 2 Gnome^isDev(c,t 1, p2))}
globalJoiners(p,t) =
{c|isDev(c,t, p)^8p2 (p2 2 Gnome ) ¬isDev(c,t 1, p2))}
Time
Joiners
1997 1999 2001 2003 2005 2007 2009 2011 2013
051015202530
Time
Joiners
1997 1999 2001 2003 2005 2007 2009 2011 2013
051015202530
Time
Joiners
1997 1999 2001 2003 2005 2007 2009 2011 2013
051015202530
evolution gtk+ gimp
Fig. 1.11 Historical evolution (timeline) of the number of local (black solid) and global (red
dashed) joiners (y-axis) for three GNOME projects.
We did not find any general trend, the patterns of intake and loss of coders are
highly project-specific. Figure 1.11 illustrates the evolution of the number of local
and global joiners for some of the more important GNOME projects (the figures for
leavers are very similar). For some projects (e.g., evolution) we do not observe
a big difference between the number of local and global joiners, respectively. These
projects seem to attract new developers both from within and outside of GNOME.
Other projects, like gimp, attract most of its incoming developers from outside
GNOME. A third category of projects attracts most of its incoming developers from
other GNOME projects. This is the case for gtk+, glib and libgnome, which
can be considered as belonging to the core of GNOME. This observation seems to
Timeline	
  (6-­‐month	
  intervals)
of	
  joiners	
  to	
  Gnome	
  projects
-­‐	
  Black	
  =	
  local	
  joiners	
  from	
  other	
  Gnome	
  projects
-­‐	
  Red	
  =	
  global	
  joiners	
  from	
  outside	
  of	
  Gnome
-­‐	
  Blue	
  =	
  stayers
Time
Joiners
1997 1999 2001 2003 2005 2007 2009 2011 2013
05101520253035
Time
Joiners
1997 1999 2001 2003 2005 2007 2009 2011 2013
05101520253035
Time
1997 1999 2001 2003 2005 2007 2009 2011 2013
05101520253035
Time
Leavers
1997 1999 2001 2003 2005 2007 2009 2011 2013
05101520253035
Time
Leavers
1997 1999 2001 2003 2005 2007 2009 2011 2013
05101520253035
9	
  July	
  2013	
  -­‐	
  SATToSE,	
  Bern 33
Migra@on	
  in	
  soHware	
  ecosystems
Gnome	
  case	
  study
Evolu@on Gimp GTK+
-­‐	
  Black	
  =	
  local	
  joiners	
  from	
  other	
  Gnome	
  projects
-­‐	
  Red	
  =	
  global	
  joiners	
  from	
  outside	
  of	
  Gnome
-­‐	
  Blue	
  =	
  stayers
28 Tom Mens, Ma¨elick Claes, Philippe Grosjean and Alexander Serebrenik
project that were not active in this project during the preceding 6-month period,
but that were involved in some activity in other GNOME projects instead. Global
joiners are incoming coders in the considered project that were not active in any
of the GNOME projects during the preceding period. A similar definition holds for
the local and global leavers. Formally, the metrics are defined as follows. Let p be
a GNOME project, t a 6-month activity period (and t 1 the previous period), c a
coder, Gnome the set of GNOME’s code projects, and isDev(c,t, p) is a predicate
which is true if and only if c made a code commit in p during t:
localLeavers(p,t) =
{c|isDev(c,t 1, p)^¬isDev(c,t, p)^9p2 (p2 2 Gnome^isDev(c,t, p2))}
globalLeavers(p,t) =
{c|isDev(c,t 1, p)^8p2 (p2 2 Gnome ) ¬isDev(c,t, p2))}
localJoiners(p,t) =
{c|isDev(c,t, p)^¬isDev(c,t 1, p)^9p2 (p2 2 Gnome^isDev(c,t 1, p2))}
globalJoiners(p,t) =
{c|isDev(c,t, p)^8p2 (p2 2 Gnome ) ¬isDev(c,t 1, p2))}
Time
Joiners
1997 1999 2001 2003 2005 2007 2009 2011 2013
051015202530
Time
Joiners
1997 1999 2001 2003 2005 2007 2009 2011 2013
051015202530
Time
Joiners
1997 1999 2001 2003 2005 2007 2009 2011 2013
051015202530
evolution gtk+ gimp
Fig. 1.11 Historical evolution (timeline) of the number of local (black solid) and global (red
dashed) joiners (y-axis) for three GNOME projects.
We did not find any general trend, the patterns of intake and loss of coders are
highly project-specific. Figure 1.11 illustrates the evolution of the number of local
and global joiners for some of the more important GNOME projects (the figures for
leavers are very similar). For some projects (e.g., evolution) we do not observe
a big difference between the number of local and global joiners, respectively. These
projects seem to attract new developers both from within and outside of GNOME.
Timeline	
  (6-­‐month	
  intervals)
of	
  leavers	
  from	
  Gnome	
  projects
Time
1997 1999 2001 2003 2005 2007 2009 2011 2013
05101520253035
Time
Leavers
1997 1999 2001 2003 2005 2007 2009 2011 2013
05101520253035
Time
Leavers
1997 1999 2001 2003 2005 2007 2009 2011 2013
05101520253035
9	
  July	
  2013	
  -­‐	
  SATToSE,	
  Bern 34
Migra@on	
  in	
  soHware	
  ecosystems
Gnome	
  case	
  study
Evolu@on Gimp GTK+
CF(p)	
  =	
  Collabora@on	
  factor	
  for	
  Gnome	
  project	
  p
=	
  percentage	
  of	
  coders	
  in	
  p	
  having	
  contributed	
  to	
  other	
  Gnome	
  projects
CF(Gimp)	
  =	
  65,3%
(low	
  collabora@on)
CF(GTK+)	
  =	
  94,8%
(very	
  high	
  collabora@on)
CF(Evolu@on)	
  =	
  85,1%
(high	
  collabora@on)
9	
  July	
  2013	
  -­‐	
  SATToSE,	
  Bern
Migra@on	
  in	
  soHware	
  ecosystems
Gnome	
  case	
  study
35
9	
  July	
  2013	
  -­‐	
  SATToSE,	
  Bern
Some	
  references
36
To appear in 2013 in Springer’s Empirical Software Engineering journal – manuscript
(will be inserted by the editor)
On the variation and specialisation of workload – A
case study of the Gnome ecosystem community
Bogdan Vasilescu · Alexander Serebrenik ·
Mathieu Goeminne · Tom Mens
DOI: 10.1007/s10664-013-9244-1
Chapter 10
Studying Evolving Software Ecosystems
based on Ecological Models
Tom Mens, Ma¨elick Claes, Philippe Grosjean and Alexander Serebrenik
Research on software evolution is very active, but evolutionary principles, models
and theories that properly explain why and how software systems evolve over time
are still lacking. Similarly, more empirical research is needed to understand how
different software projects co-exist and co-evolve, and how contributors collaborate
within their encompassing software ecosystem.
In this chapter, we explore the differences and analogies between natural ecosys-
tems and biological evolution on the one hand, and software ecosystems and soft-
ware evolution on the other hand. The aim is to learn from research in ecology to
advance the understanding of evolving software ecosystems. Ultimately, we wish
to use such knowledge to derive diagnostic tools aiming to analyse and optimise
the fitness of software projects in their environment, and to help software project
communities in managing their projects better.
Tom Mens and Ma¨elick Claes and Philippe Grosjean
COMPLEXYS Research Institute, University of Mons, Belgium
e-mail: tom.mens,maelick.claes,philippe.grosjean@umons.ac.be
Alexander Serebrenik
Eindhoven University of Technology, The Netherlands
e-mail: a.serebrenik@tue.nl
This work has been partially supported by F.R.S-F.N.R.S. research grant BSS-2012/V 6/5/015
author’s stay at the Universit´e de Mons, supported by the F.R.S-F.N.R.S. under the grant BSS-
2012/V 6/5/015. and ARC research project AUWB-12/17-UMONS-3,“Ecological Studies of Open
Source Software Ecosystems” financed by the Minist`ere de la Communaut´e franc¸aise - Direction
g´en´erale de l’Enseignement non obligatoire et de la Recherche scientifique, Belgium.
245
UMONS
Faculté des Sciences
Département d’Informatique
Understanding the Evolution of
Socio-technical Aspects in Open Source
Ecosystems: An Empirical Analysis of
GNOME
Mathieu Goeminne
A dissertation submitted in fulfillment of the requirements of
the degree of Docteur en Sciences
Advisor Jury
Dr. TOM MENS Dr. XAVIER BLANC
Université de Mons, Belgium Université de Bordeaux 1, France
Dr. VÉRONIQUE BRUYÈRE
Université de Mons, Belgium
Dr. JESUS M. GONZALEZ-BARAHONA
Universidad Rey Juan Carlos, Spain
Dr. TOM MENS
Université de Mons, Belgium
Dr. ALEXANDER SEREBRENIK
Technische Universiteit Eindhoven, The Netherlands
Dr. JEF WIJSEN
Université de Mons, Belgium
June 2013
A historical dataset for GNOME contributors
Mathieu Goeminne, Ma¨elick Claes and Tom Mens
Software Engineering Lab, COMPLEXYS research institute, UMONS, Belgium
Abstract—We present a dataset of the open source
software ecosystem GNOME from a social point of view.
We have collected historical data about the contributors
to all GNOME projects stored on git.gnome.org, taking
into account the problem of identity matching, and as-
sociating different activity types to the contributors. This
type of information is very useful to complement the
traditional, source-code related information one can ob-
tain by mining and analyzing the actual source code.
The dataset can be obtained at https://bitbucket.org/
mgoeminne/sgl-flossmetric-dbmerge.
I. INTRODUCTION
In this paper, we present the process we have used
to create a dataset containing the historical information
related to contributors to the GNOME ecosystem. Our
database and the tools and scripts used to created it can
be found on a dedicated Bitbucket repository2
.
In contrast to many other datasets, we do not focus on
source code, since a significant amount of files commit-
ted to GNOME’s project repositories do not even contain
code (e.g., image files, web pages, documentation, lo-
calization and many more). Such type of information is
often ignored in MSR research while it is very relevant
to understand which types of activities contributors are
@	
  MSR	
  2013
[to	
  appear	
  in	
  2014]

Mais conteúdo relacionado

Mais procurados

Remsen celebration of discovery
Remsen celebration of discoveryRemsen celebration of discovery
Remsen celebration of discoveryDavid Remsen
 
Ess topic 2.7 measuring changes in a system
Ess topic 2.7   measuring changes in a systemEss topic 2.7   measuring changes in a system
Ess topic 2.7 measuring changes in a systemBrad Kremer
 
2 2 food webs ii ms.ls2
2 2 food webs  ii ms.ls22 2 food webs  ii ms.ls2
2 2 food webs ii ms.ls2James Wampler
 
Ess topic 2.1 ecosystem structures
Ess topic 2.1   ecosystem structuresEss topic 2.1   ecosystem structures
Ess topic 2.1 ecosystem structuresBrad Kremer
 
Per Olsson - Critical thresholds and transformations
Per Olsson - Critical thresholds and transformationsPer Olsson - Critical thresholds and transformations
Per Olsson - Critical thresholds and transformationsSTEPS Centre
 
Five most significant findings from water resources
Five most significant findings from water resourcesFive most significant findings from water resources
Five most significant findings from water resourcesMrinmoy Majumder
 
Living in the Anthropocene: Science, Sustainability, and Society
Living in the Anthropocene: Science, Sustainability, and SocietyLiving in the Anthropocene: Science, Sustainability, and Society
Living in the Anthropocene: Science, Sustainability, and Societytewksjj
 
Ess topic 2.5 functions
Ess topic 2.5   functionsEss topic 2.5   functions
Ess topic 2.5 functionsBrad Kremer
 
Resilience and adaptive capacity in social-ecological systems: the good, the ...
Resilience and adaptive capacity in social-ecological systems: the good, the ...Resilience and adaptive capacity in social-ecological systems: the good, the ...
Resilience and adaptive capacity in social-ecological systems: the good, the ...Christo Fabricius
 
HLEG thematic workshop on measuring economic, social and environmental resili...
HLEG thematic workshop on measuring economic, social and environmental resili...HLEG thematic workshop on measuring economic, social and environmental resili...
HLEG thematic workshop on measuring economic, social and environmental resili...StatsCommunications
 
Ess topic 2.2 measuring abiotic components of the ecosystem
Ess topic 2.2   measuring abiotic components of the ecosystemEss topic 2.2   measuring abiotic components of the ecosystem
Ess topic 2.2 measuring abiotic components of the ecosystemBrad Kremer
 
[Ostrom, 2009] a general framework for analyzing sustainability of social-e...
[Ostrom, 2009]   a general framework for analyzing sustainability of social-e...[Ostrom, 2009]   a general framework for analyzing sustainability of social-e...
[Ostrom, 2009] a general framework for analyzing sustainability of social-e...FiorellaIsabelCampos1
 
2 2 food webs ii ms.ls2 [autosaved]
2 2 food webs  ii ms.ls2 [autosaved]2 2 food webs  ii ms.ls2 [autosaved]
2 2 food webs ii ms.ls2 [autosaved]James Wampler
 
Review the effectiveness of constructed wetlands for the treatment of either ...
Review the effectiveness of constructed wetlands for the treatment of either ...Review the effectiveness of constructed wetlands for the treatment of either ...
Review the effectiveness of constructed wetlands for the treatment of either ...www.StudentsAssignmentHelp.com
 
Ecdl2007ecologicallyinfluenced Ss
Ecdl2007ecologicallyinfluenced SsEcdl2007ecologicallyinfluenced Ss
Ecdl2007ecologicallyinfluenced SsR. John Robertson
 
Sparks High School Biology Semester 1
Sparks High School Biology Semester 1Sparks High School Biology Semester 1
Sparks High School Biology Semester 1KatieDiLibero
 
2.4 biomes zonation and succession notes
2.4 biomes zonation and succession notes2.4 biomes zonation and succession notes
2.4 biomes zonation and succession notesBrad Kremer
 

Mais procurados (20)

Remsen celebration of discovery
Remsen celebration of discoveryRemsen celebration of discovery
Remsen celebration of discovery
 
Ess topic 2.7 measuring changes in a system
Ess topic 2.7   measuring changes in a systemEss topic 2.7   measuring changes in a system
Ess topic 2.7 measuring changes in a system
 
SuperSites
SuperSitesSuperSites
SuperSites
 
2 2 food webs ii ms.ls2
2 2 food webs  ii ms.ls22 2 food webs  ii ms.ls2
2 2 food webs ii ms.ls2
 
Ess topic 2.1 ecosystem structures
Ess topic 2.1   ecosystem structuresEss topic 2.1   ecosystem structures
Ess topic 2.1 ecosystem structures
 
Per Olsson - Critical thresholds and transformations
Per Olsson - Critical thresholds and transformationsPer Olsson - Critical thresholds and transformations
Per Olsson - Critical thresholds and transformations
 
Five most significant findings from water resources
Five most significant findings from water resourcesFive most significant findings from water resources
Five most significant findings from water resources
 
Living in the Anthropocene: Science, Sustainability, and Society
Living in the Anthropocene: Science, Sustainability, and SocietyLiving in the Anthropocene: Science, Sustainability, and Society
Living in the Anthropocene: Science, Sustainability, and Society
 
CERI Poster-3
CERI Poster-3CERI Poster-3
CERI Poster-3
 
Ess topic 2.5 functions
Ess topic 2.5   functionsEss topic 2.5   functions
Ess topic 2.5 functions
 
Resilience and adaptive capacity in social-ecological systems: the good, the ...
Resilience and adaptive capacity in social-ecological systems: the good, the ...Resilience and adaptive capacity in social-ecological systems: the good, the ...
Resilience and adaptive capacity in social-ecological systems: the good, the ...
 
HLEG thematic workshop on measuring economic, social and environmental resili...
HLEG thematic workshop on measuring economic, social and environmental resili...HLEG thematic workshop on measuring economic, social and environmental resili...
HLEG thematic workshop on measuring economic, social and environmental resili...
 
Rjl08
Rjl08Rjl08
Rjl08
 
Ess topic 2.2 measuring abiotic components of the ecosystem
Ess topic 2.2   measuring abiotic components of the ecosystemEss topic 2.2   measuring abiotic components of the ecosystem
Ess topic 2.2 measuring abiotic components of the ecosystem
 
[Ostrom, 2009] a general framework for analyzing sustainability of social-e...
[Ostrom, 2009]   a general framework for analyzing sustainability of social-e...[Ostrom, 2009]   a general framework for analyzing sustainability of social-e...
[Ostrom, 2009] a general framework for analyzing sustainability of social-e...
 
2 2 food webs ii ms.ls2 [autosaved]
2 2 food webs  ii ms.ls2 [autosaved]2 2 food webs  ii ms.ls2 [autosaved]
2 2 food webs ii ms.ls2 [autosaved]
 
Review the effectiveness of constructed wetlands for the treatment of either ...
Review the effectiveness of constructed wetlands for the treatment of either ...Review the effectiveness of constructed wetlands for the treatment of either ...
Review the effectiveness of constructed wetlands for the treatment of either ...
 
Ecdl2007ecologicallyinfluenced Ss
Ecdl2007ecologicallyinfluenced SsEcdl2007ecologicallyinfluenced Ss
Ecdl2007ecologicallyinfluenced Ss
 
Sparks High School Biology Semester 1
Sparks High School Biology Semester 1Sparks High School Biology Semester 1
Sparks High School Biology Semester 1
 
2.4 biomes zonation and succession notes
2.4 biomes zonation and succession notes2.4 biomes zonation and succession notes
2.4 biomes zonation and succession notes
 

Destaque

Challenges in Software Ecosystems Research
Challenges in Software Ecosystems ResearchChallenges in Software Ecosystems Research
Challenges in Software Ecosystems ResearchAlexander Serebrenik
 
Designing Software Ecosystems - How to Develop Sustainable Collaborations? - ...
Designing Software Ecosystems - How to Develop Sustainable Collaborations? - ...Designing Software Ecosystems - How to Develop Sustainable Collaborations? - ...
Designing Software Ecosystems - How to Develop Sustainable Collaborations? - ...Mahsa H. Sadi
 
Understanding Software Ecosystems
Understanding Software EcosystemsUnderstanding Software Ecosystems
Understanding Software EcosystemsBala Iyer
 
ICSE2014
ICSE2014ICSE2014
ICSE2014swy351
 
RE 2015 ecosystems tutorial
RE 2015 ecosystems tutorialRE 2015 ecosystems tutorial
RE 2015 ecosystems tutorialXavier Franch
 

Destaque (6)

Challenges in Software Ecosystems Research
Challenges in Software Ecosystems ResearchChallenges in Software Ecosystems Research
Challenges in Software Ecosystems Research
 
B3 ps seco-intro
B3 ps seco-introB3 ps seco-intro
B3 ps seco-intro
 
Designing Software Ecosystems - How to Develop Sustainable Collaborations? - ...
Designing Software Ecosystems - How to Develop Sustainable Collaborations? - ...Designing Software Ecosystems - How to Develop Sustainable Collaborations? - ...
Designing Software Ecosystems - How to Develop Sustainable Collaborations? - ...
 
Understanding Software Ecosystems
Understanding Software EcosystemsUnderstanding Software Ecosystems
Understanding Software Ecosystems
 
ICSE2014
ICSE2014ICSE2014
ICSE2014
 
RE 2015 ecosystems tutorial
RE 2015 ecosystems tutorialRE 2015 ecosystems tutorial
RE 2015 ecosystems tutorial
 

Semelhante a Studying Evolving Software Ecosystems Inspired by Ecological Models

ECOS: Ecological Studies of Open Source Software Ecosystems (@ CSMR-WCRE 2014...
ECOS: Ecological Studies of Open Source Software Ecosystems (@ CSMR-WCRE 2014...ECOS: Ecological Studies of Open Source Software Ecosystems (@ CSMR-WCRE 2014...
ECOS: Ecological Studies of Open Source Software Ecosystems (@ CSMR-WCRE 2014...Tom Mens
 
The repository ecology: an approach to understanding repository and service i...
The repository ecology: an approach to understanding repository and service i...The repository ecology: an approach to understanding repository and service i...
The repository ecology: an approach to understanding repository and service i...R. John Robertson
 
Emergent global patterns_of_ecosystem_structure_and_function_form_a_mechanist...
Emergent global patterns_of_ecosystem_structure_and_function_form_a_mechanist...Emergent global patterns_of_ecosystem_structure_and_function_form_a_mechanist...
Emergent global patterns_of_ecosystem_structure_and_function_form_a_mechanist...Dr Lendy Spires
 
Morton presentation6
Morton presentation6Morton presentation6
Morton presentation6bensparrowau
 
Finding self-organized criticality in collaborative work via repository mining
Finding self-organized criticality in collaborative work via repository miningFinding self-organized criticality in collaborative work via repository mining
Finding self-organized criticality in collaborative work via repository mining pacvslideshare
 
Emilia Suomalainen - Dynamic modelling of material flows and sustainable reso...
Emilia Suomalainen - Dynamic modelling of material flows and sustainable reso...Emilia Suomalainen - Dynamic modelling of material flows and sustainable reso...
Emilia Suomalainen - Dynamic modelling of material flows and sustainable reso...Emilia Suomalainen
 
Tim Brown ACEAS Phenocams
Tim Brown ACEAS PhenocamsTim Brown ACEAS Phenocams
Tim Brown ACEAS Phenocamsaceas13tern
 
Panel 2: Understanding Risk in Natural and Manmade Systems
Panel 2: Understanding Risk in Natural and Manmade SystemsPanel 2: Understanding Risk in Natural and Manmade Systems
Panel 2: Understanding Risk in Natural and Manmade SystemsResilienceByDesign
 
Esri and the Scientific Community
Esri and the Scientific CommunityEsri and the Scientific Community
Esri and the Scientific CommunityDawn Wright
 
BioVeL at IBERGRID e-Infrastructures and biodiversity workshop, 19th Septembe...
BioVeL at IBERGRID e-Infrastructures and biodiversity workshop, 19th Septembe...BioVeL at IBERGRID e-Infrastructures and biodiversity workshop, 19th Septembe...
BioVeL at IBERGRID e-Infrastructures and biodiversity workshop, 19th Septembe...Alex Hardisty
 
Scott Edmunds: GigaScience - a journal or a database? Lessons learned from th...
Scott Edmunds: GigaScience - a journal or a database? Lessons learned from th...Scott Edmunds: GigaScience - a journal or a database? Lessons learned from th...
Scott Edmunds: GigaScience - a journal or a database? Lessons learned from th...GigaScience, BGI Hong Kong
 
Evolution of e-Research
Evolution of e-ResearchEvolution of e-Research
Evolution of e-ResearchDavid De Roure
 
Trust and Accountability: experiences from the FAIRDOM Commons Initiative.
Trust and Accountability: experiences from the FAIRDOM Commons Initiative.Trust and Accountability: experiences from the FAIRDOM Commons Initiative.
Trust and Accountability: experiences from the FAIRDOM Commons Initiative.Carole Goble
 
Software Ecosystem Evolution. It's complex!
Software Ecosystem Evolution. It's complex!Software Ecosystem Evolution. It's complex!
Software Ecosystem Evolution. It's complex!Tom Mens
 
10th e concertation-brussels-06march2013-v2
10th e concertation-brussels-06march2013-v210th e concertation-brussels-06march2013-v2
10th e concertation-brussels-06march2013-v2Alex Hardisty
 
David Lindenmayer_Successful delivery of critical ecosystem research infrastr...
David Lindenmayer_Successful delivery of critical ecosystem research infrastr...David Lindenmayer_Successful delivery of critical ecosystem research infrastr...
David Lindenmayer_Successful delivery of critical ecosystem research infrastr...TERN Australia
 

Semelhante a Studying Evolving Software Ecosystems Inspired by Ecological Models (20)

ECOS: Ecological Studies of Open Source Software Ecosystems (@ CSMR-WCRE 2014...
ECOS: Ecological Studies of Open Source Software Ecosystems (@ CSMR-WCRE 2014...ECOS: Ecological Studies of Open Source Software Ecosystems (@ CSMR-WCRE 2014...
ECOS: Ecological Studies of Open Source Software Ecosystems (@ CSMR-WCRE 2014...
 
The repository ecology: an approach to understanding repository and service i...
The repository ecology: an approach to understanding repository and service i...The repository ecology: an approach to understanding repository and service i...
The repository ecology: an approach to understanding repository and service i...
 
Emergent global patterns_of_ecosystem_structure_and_function_form_a_mechanist...
Emergent global patterns_of_ecosystem_structure_and_function_form_a_mechanist...Emergent global patterns_of_ecosystem_structure_and_function_form_a_mechanist...
Emergent global patterns_of_ecosystem_structure_and_function_form_a_mechanist...
 
LTER
LTERLTER
LTER
 
Morton presentation6
Morton presentation6Morton presentation6
Morton presentation6
 
Finding self-organized criticality in collaborative work via repository mining
Finding self-organized criticality in collaborative work via repository miningFinding self-organized criticality in collaborative work via repository mining
Finding self-organized criticality in collaborative work via repository mining
 
Elisabeth Shrimpton
Elisabeth ShrimptonElisabeth Shrimpton
Elisabeth Shrimpton
 
Emilia Suomalainen - Dynamic modelling of material flows and sustainable reso...
Emilia Suomalainen - Dynamic modelling of material flows and sustainable reso...Emilia Suomalainen - Dynamic modelling of material flows and sustainable reso...
Emilia Suomalainen - Dynamic modelling of material flows and sustainable reso...
 
Tim Brown ACEAS Phenocams
Tim Brown ACEAS PhenocamsTim Brown ACEAS Phenocams
Tim Brown ACEAS Phenocams
 
Panel 2: Understanding Risk in Natural and Manmade Systems
Panel 2: Understanding Risk in Natural and Manmade SystemsPanel 2: Understanding Risk in Natural and Manmade Systems
Panel 2: Understanding Risk in Natural and Manmade Systems
 
Esri and the Scientific Community
Esri and the Scientific CommunityEsri and the Scientific Community
Esri and the Scientific Community
 
DeLong - Natural Materials and Systems - Spring Review 2013
DeLong - Natural Materials and Systems - Spring Review 2013DeLong - Natural Materials and Systems - Spring Review 2013
DeLong - Natural Materials and Systems - Spring Review 2013
 
BioVeL at IBERGRID e-Infrastructures and biodiversity workshop, 19th Septembe...
BioVeL at IBERGRID e-Infrastructures and biodiversity workshop, 19th Septembe...BioVeL at IBERGRID e-Infrastructures and biodiversity workshop, 19th Septembe...
BioVeL at IBERGRID e-Infrastructures and biodiversity workshop, 19th Septembe...
 
Scott Edmunds: GigaScience - a journal or a database? Lessons learned from th...
Scott Edmunds: GigaScience - a journal or a database? Lessons learned from th...Scott Edmunds: GigaScience - a journal or a database? Lessons learned from th...
Scott Edmunds: GigaScience - a journal or a database? Lessons learned from th...
 
Evolution of e-Research
Evolution of e-ResearchEvolution of e-Research
Evolution of e-Research
 
Trust and Accountability: experiences from the FAIRDOM Commons Initiative.
Trust and Accountability: experiences from the FAIRDOM Commons Initiative.Trust and Accountability: experiences from the FAIRDOM Commons Initiative.
Trust and Accountability: experiences from the FAIRDOM Commons Initiative.
 
Software Ecosystem Evolution. It's complex!
Software Ecosystem Evolution. It's complex!Software Ecosystem Evolution. It's complex!
Software Ecosystem Evolution. It's complex!
 
20100427 Earthster Core Ontology
20100427 Earthster Core Ontology20100427 Earthster Core Ontology
20100427 Earthster Core Ontology
 
10th e concertation-brussels-06march2013-v2
10th e concertation-brussels-06march2013-v210th e concertation-brussels-06march2013-v2
10th e concertation-brussels-06march2013-v2
 
David Lindenmayer_Successful delivery of critical ecosystem research infrastr...
David Lindenmayer_Successful delivery of critical ecosystem research infrastr...David Lindenmayer_Successful delivery of critical ecosystem research infrastr...
David Lindenmayer_Successful delivery of critical ecosystem research infrastr...
 

Mais de Tom Mens

How to be(come) a successful PhD student
How to be(come) a successful PhD studentHow to be(come) a successful PhD student
How to be(come) a successful PhD studentTom Mens
 
Recognising bot activity in collaborative software development
Recognising bot activity in collaborative software developmentRecognising bot activity in collaborative software development
Recognising bot activity in collaborative software developmentTom Mens
 
A Dataset of Bot and Human Activities in GitHub
A Dataset of Bot and Human Activities in GitHubA Dataset of Bot and Human Activities in GitHub
A Dataset of Bot and Human Activities in GitHubTom Mens
 
The (r)evolution of CI/CD on GitHub
 The (r)evolution of CI/CD on GitHub The (r)evolution of CI/CD on GitHub
The (r)evolution of CI/CD on GitHubTom Mens
 
Nurturing the Software Ecosystems of the Future
Nurturing the Software Ecosystems of the FutureNurturing the Software Ecosystems of the Future
Nurturing the Software Ecosystems of the FutureTom Mens
 
Comment programmer un robot en 30 minutes?
Comment programmer un robot en 30 minutes?Comment programmer un robot en 30 minutes?
Comment programmer un robot en 30 minutes?Tom Mens
 
On the rise and fall of CI services in GitHub
On the rise and fall of CI services in GitHubOn the rise and fall of CI services in GitHub
On the rise and fall of CI services in GitHubTom Mens
 
On backporting practices in package dependency networks
On backporting practices in package dependency networksOn backporting practices in package dependency networks
On backporting practices in package dependency networksTom Mens
 
Comparing semantic versioning practices in Cargo, npm, Packagist and Rubygems
Comparing semantic versioning practices in Cargo, npm, Packagist and RubygemsComparing semantic versioning practices in Cargo, npm, Packagist and Rubygems
Comparing semantic versioning practices in Cargo, npm, Packagist and RubygemsTom Mens
 
Lost in Zero Space
Lost in Zero SpaceLost in Zero Space
Lost in Zero SpaceTom Mens
 
Evaluating a bot detection model on git commit messages
Evaluating a bot detection model on git commit messagesEvaluating a bot detection model on git commit messages
Evaluating a bot detection model on git commit messagesTom Mens
 
Is my software ecosystem healthy? It depends!
Is my software ecosystem healthy? It depends!Is my software ecosystem healthy? It depends!
Is my software ecosystem healthy? It depends!Tom Mens
 
Bot or not? Detecting bots in GitHub pull request activity based on comment s...
Bot or not? Detecting bots in GitHub pull request activity based on comment s...Bot or not? Detecting bots in GitHub pull request activity based on comment s...
Bot or not? Detecting bots in GitHub pull request activity based on comment s...Tom Mens
 
On the fragility of open source software packaging ecosystems
On the fragility of open source software packaging ecosystemsOn the fragility of open source software packaging ecosystems
On the fragility of open source software packaging ecosystemsTom Mens
 
How magic is zero? An Empirical Analysis of Initial Development Releases in S...
How magic is zero? An Empirical Analysis of Initial Development Releases in S...How magic is zero? An Empirical Analysis of Initial Development Releases in S...
How magic is zero? An Empirical Analysis of Initial Development Releases in S...Tom Mens
 
Comparing dependency issues across software package distributions (FOSDEM 2020)
Comparing dependency issues across software package distributions (FOSDEM 2020)Comparing dependency issues across software package distributions (FOSDEM 2020)
Comparing dependency issues across software package distributions (FOSDEM 2020)Tom Mens
 
Measuring Technical Lag in Software Deployments (CHAOSScon 2020)
Measuring Technical Lag in Software Deployments (CHAOSScon 2020)Measuring Technical Lag in Software Deployments (CHAOSScon 2020)
Measuring Technical Lag in Software Deployments (CHAOSScon 2020)Tom Mens
 
SecoHealth 2019 Research Achievements
SecoHealth 2019 Research AchievementsSecoHealth 2019 Research Achievements
SecoHealth 2019 Research AchievementsTom Mens
 
SECO-Assist 2019 research seminar
SECO-Assist 2019 research seminarSECO-Assist 2019 research seminar
SECO-Assist 2019 research seminarTom Mens
 
Empirically Analysing the Socio-Technical Health of Software Package Managers
Empirically Analysing the Socio-Technical Health of Software Package ManagersEmpirically Analysing the Socio-Technical Health of Software Package Managers
Empirically Analysing the Socio-Technical Health of Software Package ManagersTom Mens
 

Mais de Tom Mens (20)

How to be(come) a successful PhD student
How to be(come) a successful PhD studentHow to be(come) a successful PhD student
How to be(come) a successful PhD student
 
Recognising bot activity in collaborative software development
Recognising bot activity in collaborative software developmentRecognising bot activity in collaborative software development
Recognising bot activity in collaborative software development
 
A Dataset of Bot and Human Activities in GitHub
A Dataset of Bot and Human Activities in GitHubA Dataset of Bot and Human Activities in GitHub
A Dataset of Bot and Human Activities in GitHub
 
The (r)evolution of CI/CD on GitHub
 The (r)evolution of CI/CD on GitHub The (r)evolution of CI/CD on GitHub
The (r)evolution of CI/CD on GitHub
 
Nurturing the Software Ecosystems of the Future
Nurturing the Software Ecosystems of the FutureNurturing the Software Ecosystems of the Future
Nurturing the Software Ecosystems of the Future
 
Comment programmer un robot en 30 minutes?
Comment programmer un robot en 30 minutes?Comment programmer un robot en 30 minutes?
Comment programmer un robot en 30 minutes?
 
On the rise and fall of CI services in GitHub
On the rise and fall of CI services in GitHubOn the rise and fall of CI services in GitHub
On the rise and fall of CI services in GitHub
 
On backporting practices in package dependency networks
On backporting practices in package dependency networksOn backporting practices in package dependency networks
On backporting practices in package dependency networks
 
Comparing semantic versioning practices in Cargo, npm, Packagist and Rubygems
Comparing semantic versioning practices in Cargo, npm, Packagist and RubygemsComparing semantic versioning practices in Cargo, npm, Packagist and Rubygems
Comparing semantic versioning practices in Cargo, npm, Packagist and Rubygems
 
Lost in Zero Space
Lost in Zero SpaceLost in Zero Space
Lost in Zero Space
 
Evaluating a bot detection model on git commit messages
Evaluating a bot detection model on git commit messagesEvaluating a bot detection model on git commit messages
Evaluating a bot detection model on git commit messages
 
Is my software ecosystem healthy? It depends!
Is my software ecosystem healthy? It depends!Is my software ecosystem healthy? It depends!
Is my software ecosystem healthy? It depends!
 
Bot or not? Detecting bots in GitHub pull request activity based on comment s...
Bot or not? Detecting bots in GitHub pull request activity based on comment s...Bot or not? Detecting bots in GitHub pull request activity based on comment s...
Bot or not? Detecting bots in GitHub pull request activity based on comment s...
 
On the fragility of open source software packaging ecosystems
On the fragility of open source software packaging ecosystemsOn the fragility of open source software packaging ecosystems
On the fragility of open source software packaging ecosystems
 
How magic is zero? An Empirical Analysis of Initial Development Releases in S...
How magic is zero? An Empirical Analysis of Initial Development Releases in S...How magic is zero? An Empirical Analysis of Initial Development Releases in S...
How magic is zero? An Empirical Analysis of Initial Development Releases in S...
 
Comparing dependency issues across software package distributions (FOSDEM 2020)
Comparing dependency issues across software package distributions (FOSDEM 2020)Comparing dependency issues across software package distributions (FOSDEM 2020)
Comparing dependency issues across software package distributions (FOSDEM 2020)
 
Measuring Technical Lag in Software Deployments (CHAOSScon 2020)
Measuring Technical Lag in Software Deployments (CHAOSScon 2020)Measuring Technical Lag in Software Deployments (CHAOSScon 2020)
Measuring Technical Lag in Software Deployments (CHAOSScon 2020)
 
SecoHealth 2019 Research Achievements
SecoHealth 2019 Research AchievementsSecoHealth 2019 Research Achievements
SecoHealth 2019 Research Achievements
 
SECO-Assist 2019 research seminar
SECO-Assist 2019 research seminarSECO-Assist 2019 research seminar
SECO-Assist 2019 research seminar
 
Empirically Analysing the Socio-Technical Health of Software Package Managers
Empirically Analysing the Socio-Technical Health of Software Package ManagersEmpirically Analysing the Socio-Technical Health of Software Package Managers
Empirically Analysing the Socio-Technical Health of Software Package Managers
 

Último

Introduction to Nonprofit Accounting: The Basics
Introduction to Nonprofit Accounting: The BasicsIntroduction to Nonprofit Accounting: The Basics
Introduction to Nonprofit Accounting: The BasicsTechSoup
 
Q4-W6-Restating Informational Text Grade 3
Q4-W6-Restating Informational Text Grade 3Q4-W6-Restating Informational Text Grade 3
Q4-W6-Restating Informational Text Grade 3JemimahLaneBuaron
 
Sanyam Choudhary Chemistry practical.pdf
Sanyam Choudhary Chemistry practical.pdfSanyam Choudhary Chemistry practical.pdf
Sanyam Choudhary Chemistry practical.pdfsanyamsingh5019
 
Call Girls in Dwarka Mor Delhi Contact Us 9654467111
Call Girls in Dwarka Mor Delhi Contact Us 9654467111Call Girls in Dwarka Mor Delhi Contact Us 9654467111
Call Girls in Dwarka Mor Delhi Contact Us 9654467111Sapana Sha
 
Web & Social Media Analytics Previous Year Question Paper.pdf
Web & Social Media Analytics Previous Year Question Paper.pdfWeb & Social Media Analytics Previous Year Question Paper.pdf
Web & Social Media Analytics Previous Year Question Paper.pdfJayanti Pande
 
BAG TECHNIQUE Bag technique-a tool making use of public health bag through wh...
BAG TECHNIQUE Bag technique-a tool making use of public health bag through wh...BAG TECHNIQUE Bag technique-a tool making use of public health bag through wh...
BAG TECHNIQUE Bag technique-a tool making use of public health bag through wh...Sapna Thakur
 
Kisan Call Centre - To harness potential of ICT in Agriculture by answer farm...
Kisan Call Centre - To harness potential of ICT in Agriculture by answer farm...Kisan Call Centre - To harness potential of ICT in Agriculture by answer farm...
Kisan Call Centre - To harness potential of ICT in Agriculture by answer farm...Krashi Coaching
 
Mastering the Unannounced Regulatory Inspection
Mastering the Unannounced Regulatory InspectionMastering the Unannounced Regulatory Inspection
Mastering the Unannounced Regulatory InspectionSafetyChain Software
 
CARE OF CHILD IN INCUBATOR..........pptx
CARE OF CHILD IN INCUBATOR..........pptxCARE OF CHILD IN INCUBATOR..........pptx
CARE OF CHILD IN INCUBATOR..........pptxGaneshChakor2
 
A Critique of the Proposed National Education Policy Reform
A Critique of the Proposed National Education Policy ReformA Critique of the Proposed National Education Policy Reform
A Critique of the Proposed National Education Policy ReformChameera Dedduwage
 
Interactive Powerpoint_How to Master effective communication
Interactive Powerpoint_How to Master effective communicationInteractive Powerpoint_How to Master effective communication
Interactive Powerpoint_How to Master effective communicationnomboosow
 
9548086042 for call girls in Indira Nagar with room service
9548086042  for call girls in Indira Nagar  with room service9548086042  for call girls in Indira Nagar  with room service
9548086042 for call girls in Indira Nagar with room servicediscovermytutordmt
 
Z Score,T Score, Percential Rank and Box Plot Graph
Z Score,T Score, Percential Rank and Box Plot GraphZ Score,T Score, Percential Rank and Box Plot Graph
Z Score,T Score, Percential Rank and Box Plot GraphThiyagu K
 
The Most Excellent Way | 1 Corinthians 13
The Most Excellent Way | 1 Corinthians 13The Most Excellent Way | 1 Corinthians 13
The Most Excellent Way | 1 Corinthians 13Steve Thomason
 
1029 - Danh muc Sach Giao Khoa 10 . pdf
1029 -  Danh muc Sach Giao Khoa 10 . pdf1029 -  Danh muc Sach Giao Khoa 10 . pdf
1029 - Danh muc Sach Giao Khoa 10 . pdfQucHHunhnh
 
Student login on Anyboli platform.helpin
Student login on Anyboli platform.helpinStudent login on Anyboli platform.helpin
Student login on Anyboli platform.helpinRaunakKeshri1
 
Russian Call Girls in Andheri Airport Mumbai WhatsApp 9167673311 💞 Full Nigh...
Russian Call Girls in Andheri Airport Mumbai WhatsApp  9167673311 💞 Full Nigh...Russian Call Girls in Andheri Airport Mumbai WhatsApp  9167673311 💞 Full Nigh...
Russian Call Girls in Andheri Airport Mumbai WhatsApp 9167673311 💞 Full Nigh...Pooja Nehwal
 
Beyond the EU: DORA and NIS 2 Directive's Global Impact
Beyond the EU: DORA and NIS 2 Directive's Global ImpactBeyond the EU: DORA and NIS 2 Directive's Global Impact
Beyond the EU: DORA and NIS 2 Directive's Global ImpactPECB
 
Sports & Fitness Value Added Course FY..
Sports & Fitness Value Added Course FY..Sports & Fitness Value Added Course FY..
Sports & Fitness Value Added Course FY..Disha Kariya
 

Último (20)

Código Creativo y Arte de Software | Unidad 1
Código Creativo y Arte de Software | Unidad 1Código Creativo y Arte de Software | Unidad 1
Código Creativo y Arte de Software | Unidad 1
 
Introduction to Nonprofit Accounting: The Basics
Introduction to Nonprofit Accounting: The BasicsIntroduction to Nonprofit Accounting: The Basics
Introduction to Nonprofit Accounting: The Basics
 
Q4-W6-Restating Informational Text Grade 3
Q4-W6-Restating Informational Text Grade 3Q4-W6-Restating Informational Text Grade 3
Q4-W6-Restating Informational Text Grade 3
 
Sanyam Choudhary Chemistry practical.pdf
Sanyam Choudhary Chemistry practical.pdfSanyam Choudhary Chemistry practical.pdf
Sanyam Choudhary Chemistry practical.pdf
 
Call Girls in Dwarka Mor Delhi Contact Us 9654467111
Call Girls in Dwarka Mor Delhi Contact Us 9654467111Call Girls in Dwarka Mor Delhi Contact Us 9654467111
Call Girls in Dwarka Mor Delhi Contact Us 9654467111
 
Web & Social Media Analytics Previous Year Question Paper.pdf
Web & Social Media Analytics Previous Year Question Paper.pdfWeb & Social Media Analytics Previous Year Question Paper.pdf
Web & Social Media Analytics Previous Year Question Paper.pdf
 
BAG TECHNIQUE Bag technique-a tool making use of public health bag through wh...
BAG TECHNIQUE Bag technique-a tool making use of public health bag through wh...BAG TECHNIQUE Bag technique-a tool making use of public health bag through wh...
BAG TECHNIQUE Bag technique-a tool making use of public health bag through wh...
 
Kisan Call Centre - To harness potential of ICT in Agriculture by answer farm...
Kisan Call Centre - To harness potential of ICT in Agriculture by answer farm...Kisan Call Centre - To harness potential of ICT in Agriculture by answer farm...
Kisan Call Centre - To harness potential of ICT in Agriculture by answer farm...
 
Mastering the Unannounced Regulatory Inspection
Mastering the Unannounced Regulatory InspectionMastering the Unannounced Regulatory Inspection
Mastering the Unannounced Regulatory Inspection
 
CARE OF CHILD IN INCUBATOR..........pptx
CARE OF CHILD IN INCUBATOR..........pptxCARE OF CHILD IN INCUBATOR..........pptx
CARE OF CHILD IN INCUBATOR..........pptx
 
A Critique of the Proposed National Education Policy Reform
A Critique of the Proposed National Education Policy ReformA Critique of the Proposed National Education Policy Reform
A Critique of the Proposed National Education Policy Reform
 
Interactive Powerpoint_How to Master effective communication
Interactive Powerpoint_How to Master effective communicationInteractive Powerpoint_How to Master effective communication
Interactive Powerpoint_How to Master effective communication
 
9548086042 for call girls in Indira Nagar with room service
9548086042  for call girls in Indira Nagar  with room service9548086042  for call girls in Indira Nagar  with room service
9548086042 for call girls in Indira Nagar with room service
 
Z Score,T Score, Percential Rank and Box Plot Graph
Z Score,T Score, Percential Rank and Box Plot GraphZ Score,T Score, Percential Rank and Box Plot Graph
Z Score,T Score, Percential Rank and Box Plot Graph
 
The Most Excellent Way | 1 Corinthians 13
The Most Excellent Way | 1 Corinthians 13The Most Excellent Way | 1 Corinthians 13
The Most Excellent Way | 1 Corinthians 13
 
1029 - Danh muc Sach Giao Khoa 10 . pdf
1029 -  Danh muc Sach Giao Khoa 10 . pdf1029 -  Danh muc Sach Giao Khoa 10 . pdf
1029 - Danh muc Sach Giao Khoa 10 . pdf
 
Student login on Anyboli platform.helpin
Student login on Anyboli platform.helpinStudent login on Anyboli platform.helpin
Student login on Anyboli platform.helpin
 
Russian Call Girls in Andheri Airport Mumbai WhatsApp 9167673311 💞 Full Nigh...
Russian Call Girls in Andheri Airport Mumbai WhatsApp  9167673311 💞 Full Nigh...Russian Call Girls in Andheri Airport Mumbai WhatsApp  9167673311 💞 Full Nigh...
Russian Call Girls in Andheri Airport Mumbai WhatsApp 9167673311 💞 Full Nigh...
 
Beyond the EU: DORA and NIS 2 Directive's Global Impact
Beyond the EU: DORA and NIS 2 Directive's Global ImpactBeyond the EU: DORA and NIS 2 Directive's Global Impact
Beyond the EU: DORA and NIS 2 Directive's Global Impact
 
Sports & Fitness Value Added Course FY..
Sports & Fitness Value Added Course FY..Sports & Fitness Value Added Course FY..
Sports & Fitness Value Added Course FY..
 

Studying Evolving Software Ecosystems Inspired by Ecological Models

  • 1. Studying  Evolving  SoHware  Ecosystems inspired  by  ecological  models Tom  Mens,  Maelick  Claes Service  de  Génie  Logiciel Philippe  Grosjean Service  d’écologie  numérique  des  milieux  aqua@ques informa@que.umons.ac.be/genlog/projects/ecos
  • 2. 9  July  2013  -­‐  SATToSE,  Bern Collaborators 2 ?
  • 3. 9  July  2013  -­‐  SATToSE,  Bern Long-­‐term  goals • Determine the main factors that drive the success or failure of OSS projects within their ecosystem • Investigate new techniques and mechanisms to predict and improve survivability of OSS projects – Inspired by research in biological ecology • Use these insights to help – the developer community to improve upon their practices – companies and users to compare and adopt OSS projects 3
  • 4. 9  July  2013  -­‐  SATToSE,  Bern 4 Standing  on  the  shoulders  of  giants Lamarck Lotka Volterra Darwin Pareto
  • 5. 9  July  2013  -­‐  SATToSE,  Bern 5 Terminology Biological  ecosystem Defini@ons • Ecology:  the  scien)fic  study  of  the   interac)ons  that  determine  the   distribu)on  and  abundance  of   organisms • Ecosystem:  the  physical  and   biological  components  of  an   environment  considered  in  rela)on   to  each  other  as  a  unit – combines  all  living  organisms   (plants,  animals,  micro-­‐ organisms)  and  physical   components  (light,  water,  soil,   rocks,  minerals) Example:  coral  reefs • High  biodiversity:  polyps,  sea   anemones,  fish,  mollusks,   sponges,  algae
  • 6. 9  July  2013  -­‐  SATToSE,  Bern 6 Terminology SoHware  ecosystem Business-­‐oriented  view • “a  set  of  actors  func)oning  as  a  unit   and  interac)ng  with  a  shared  market   for  so<ware  and  services,  together   with  the  rela)onships  among   them.”  (Jansen  et  al.  2009) Examples • Eclipse • Android  and  iOS  app  store
  • 7. 9  July  2013  -­‐  SATToSE,  Bern 7 SoHware  ecosystem Development-­‐centric  view • “a  collec)on  of  so<ware   products  that  have  some   given  degree  of  symbio)c   rela)onships.” (MesserschmiK  &  Szyperski  2003) • “a  collec)on  of  so<ware   projects  that  are  developed   and  evolve  together  in  the   same  environment.” (Lungu  2008) Examples • Gnome KDE • Debian Ubuntu • R’s  CRAN • Apache
  • 8. 9  July  2013  -­‐  SATToSE,  Bern 8 Comparison
  • 10. 9  July  2013  -­‐  SATToSE,  Bern 10 Ecological  theories  of evolu@on  of  species • Lamarckism -­‐  animal  organs  and  behaviour  can   change  according  to  the  way  they  are   used -­‐  those  characteris@cs  can  transmit   from  one  genera@on  to  the  next  to   reach  a  greater  level  of  perfec@on • Example -­‐  giraffe’s  necks  have  become  longer   while  trying  to  reach  the  upper  leaves   of  a  tree Jean-­‐Bap@ste  Lamarck (1744–1829)
  • 11. 9  July  2013  -­‐  SATToSE,  Bern 11 Ecological  theories  of evolu@on  of  species • Darwinism -­‐  all  species  of  life  have  descended   over  @me  from  common  ancestors -­‐  this  branching  padern  of  evolu@on   resulted  from  natural  selec@on,  similar   to  ar@ficial  selec@on  in  selec@ve   breeding • Example – 13  types  of  Galapagos  finches,   same  habits  and  characteris@cs,   but  different  beaks Charles  Darwin (1809–1882)
  • 12. 9  July  2013  -­‐  SATToSE,  Bern 12 Ecological  theories  of evolu@on  of  species Hologenome  theory • The  unit  of  natural  selec@on   is  the  holobiont:  the   organism  together  with  its   associated  microbial   communi@es,  that  live   together  in  symbiosis. • The  holobiont  can  adapt  to   changing  environmental   condi@ons  far  more  rapidly   than  by  gene@c  muta@on   and  selec@on  alone. Compe@@on  vs  coopera@on • While  Darwin’s  theory   emphasises  compe))on   (survival  of  the  fidest),   hologenome  theory  also   includes  coopera)on   (through  symbiosis)
  • 13. 9  July  2013  -­‐  SATToSE,  Bern 13 Evolu@on  History Ecology Darwin  (1837)• Evolu@on  history  of  species  can  be   represented  by  a  phylogene)c  tree. • Describes  the  evolu@onary   rela@onships  among  species   assuming  that  they  share  a common  ancestor.
  • 14. 9  July  2013  -­‐  SATToSE,  Bern 14 Evolu@on  History Ecology Re$culate  evolu$on • Unlike  in  Darwinian  model,   evolu@on  history  is  represented   using  a  graph  structure • When  re@cula@on  of  species   occurs,  two  or  more   evolu@onary  lineages  are   combined  at  some  level  of   biological  organiza@on. • Causes – hybrid  specia)on  (two  lineages   recombine  to  create  a  new  one)   – horizontal  gene  transfer  (genes   are  transferred  across  species)
  • 15. 9  July  2013  -­‐  SATToSE,  Bern 15 Evolu@on  History SoHware
  • 16. 9  July  2013  -­‐  SATToSE,  Bern 16 Trophic  web  (food  chain) in  natural  ecosystems
  • 17. 9  July  2013  -­‐  SATToSE,  Bern 17 Trophic  web  in soHware  ecosystems Producer-­‐consumer  rela@on Users Peripheral   developers Core  developers Onion  model TOP-­‐DOWN change  requests   &  bug  reports BOTTOM-­‐UP changes  in  core   projects  and   architecture  
  • 18. 9  July  2013  -­‐  SATToSE,  Bern 18 Core  Architecture  -­‐  or Why  developers  are  polyps Coral  reef  ecosystem • Sclerac)nian  coral  polyps  are   responsible  for  crea@ng  the   coral  reef  structure • This  coral  reef  is  required  for   the  other  species  of  the   ecosystem  to  thrive. SoHware  ecosystem • Core  developers  are   responsible  for  crea@ng  the   core  soHware  architecture • Based  on  this  core   architecture,  other   developers  and  third  par@es   can  create  other  projects,   services,  and  so  on.
  • 19. 9  July  2013  -­‐  SATToSE,  Bern 19 Ecosystem  Dynamics Predator-­‐prey  rela@onship • An  instance  of  the   consumer-­‐resource   rela@onship • Predators  (hun@ng  animals)   feed  upon  their  prey   (adacked  animals) Dynamic  model • Two  mutually  dependent   parametric  differen@al   equa@ons (Lotka-­‐Volterra  1925/1926)
  • 20. 9  July  2013  -­‐  SATToSE,  Bern 20 SoHware  Ecosystem Dynamics Analogies  based  on  predator-­‐prey  rela$onship • Debuggers  are  predators,  soHware  defects  are  prey [Calzolari  et  al.  Maintenance  and  tes)ng  effort  modeled  by  linear  and   nonlinear  dynamic  systems,”  Informa)on  and  So<ware  Technology,  43(8):   477  –  486,  2001] • Developers  are  predators,  the  informa@on  they  seek  is  prey [Lawrance  et  al.    Scents  in  programs:  Does  informa)on  foraging  theory   apply  to  program  maintenance?  VL/HCC  2007,  pp.  15–22]
  • 21. 9  July  2013  -­‐  SATToSE,  Bern 21 SoHware  Ecosystem Dynamics Analogies  based  on  predator-­‐prey  rela$onship • Dual  views  in  a  soHware   ecosystem – Developers  are  predators,  the   projects  they  work  on  are  prey – Projects  are  predators  that  feed   upon  the  cogni@ve  resources  of   their  developers Bipar@te  developer-­‐project  graph project  1 project  2 project  3
  • 22. 9  July  2013  -­‐  SATToSE,  Bern • Stability:  the  capacity  to  maintain   an  equilibrium  over  longer   periods  of  @me • Resistance:  the  ability  to   withstand  environmental  changes   without  too  much  disturbances  of   its  biological  communi@es • Resilience:  the  ability  to  return  to   an  equilibrium  aHer  a  disturbance • Higher  biodiversity  favours  these   characteris@cs Other  desirable  ecosystem   characteris@cs 22 Defining and Evaluating a Measure of Open Source Project Survivability Uzma Raja, Member, IEEE Computer Society, and Marietta J. Tretter Abstract—In this paper, we define and validate a new multidimensional measure of Open Source Software (OSS) project survivability, called Project Viability. Project viability has three dimensions: vigor, resilience, and organization. We define each of these dimensions and formulate an index called the Viability Index (V I) to combine all three dimensions. Archival data of projects hosted at SourceForge.net are used for the empirical validation of the measure. An Analysis Sample (n ¼ 136) is used to assign weights to each dimension of project viability and to determine a suitable cut-off point for V I. Cross-validation of the measure is performed on a hold- out Validation Sample (n ¼ 96). We demonstrate that project viability is a robust and valid measure of OSS project survivability that can be used to predict the failure or survival of an OSS project accurately. It is a tangible measure that can be used by organizations to compare various OSS projects and to make informed decisions regarding investment in the OSS domain. Index Terms—Evaluation framework, external validity, open source software, project evaluation, software measurement, software survivability. Ç 1 INTRODUCTION OPEN Source Software (OSS) projects are developed and distributed for free, with full access to the project source code. Recently there has been a significant increase in the use of these projects. Some OSS projects have earned themselves a high reputation and corporate sponsorships. Large corporations (e.g., IBM, SUN microsystems) are becoming involved with the OSS movement in various capacities. Projections indicate that the corporate interest in OSS projects will grow stronger in the future [1] and these projects will see integration in enterprise architecture [2]. This increased use of OSS projects creates the need for better project evaluation measures. Traditionally, software projects are evaluated by con- formance to budget, schedule, and user requirements [3], [4], [5], [6], [7], [8]. These measures, however, are difficult to map to OSS projects, which are developed through a network of volunteer participants, with no defined budget, schedule, or customer. Although there is a surge in the investment in OSS projects [1], research indicates that a large number of OSS projects fail [9], [10]. Some have questioned the operational reliability and quality of OSS projects [11]. Since there are no contractual or legal bindings for providing OSS updates or maintenance services, businesses investing human or financial capital on adoption of OSS projects need the ability to evaluate whether the project will continue to exist or not [12]. Development teams need to measure project survivability to control and improve performance. Individual and corporate users need a measure of project survivability to compare the available OSS projects before making decisions regarding project adoption. In this paper, we define and validate a new multi- dimensional measure of OSS project survivability, called Project Viability. OSS projects provide access to their development archives, thereby providing a unique oppor- tunity to conduct empirical research [13] and develop reliable measures [14], [15]. In the following sections, we define, formulate, and validate project viability. Section 2 provides a brief overview of the existing empirical research in OSS and the background of project survivability. Section 3 defines the dimensions of project viability and formulates an index to measure it. Section 4 discusses the empirical evaluation framework and validates the new measure using OSS project data. Discussion of the results is presented in Section 5 and conclusions are given Section 6. 2 BACKGROUND A large number of OSS projects are available for use. However, the failure rate of these projects is high [9]. The evaluation of OSS projects is different than Commercial Software Systems (CSS) [16]. The adopters of OSS projects need a mechanism to compare the chances of failure or survival of the available projects. This would allow better decisions regarding corporate resource investment. A range of measures has been used in prior research to evaluate OSS projects. Godfrey and Tu [17] examined the evolution of the Linux kernel and its growth pattern in one IEEE TRANSACTIONS ON SOFTWARE ENGINEERING, VOL. 38, NO. 1, JANUARY/FEBRUARY 2012 163 . U. Raja is with the Department of Information Systems, Statistics and Management Science, The University of Alabama, Box #870226, 300 Campus Drive, Tuscaloosa, AL 35487. E-mail: uraja@cba.ua.edu. . M.J. Tretter is with the Department of Information and Operations Management, Texas A&M University, Mail Stop #310D, Wehner
  • 23. 9  July  2013  -­‐  SATToSE,  Bern Measuring  diversity Based on Shannon’s notion of entropy and 2nd law of thermodynamics Species diversity X = set of n distinct species xi p(xi) = proportion of all individuals that belong to species xi 23 Ecosystem  Biodiversity • Biodiversity:  The  degree  of   varia@on  of  species  within  a   given  ecosystem • Interpreta@on -­‐  Maximum  diversity  if  all  species   have  same  number  of  individuals -­‐  Low  diversity  if  a  par@cular   species  dominates  the  others € H(X) = − p(xi)ln p(xi) i=1 n ∑
  • 24. 9  July  2013  -­‐  SATToSE,  Bern 24 Evolu@on  of  diversity  in  open  source  soHware Econometric  indices • Gini  and  Theil  are  measures   of  inequality  in  a  distribu@on Moreover, C# and Java are very closely related and we therefore asked ourselves whether programs written in C# exhibit distribution profiles similar to the ones we observed in Java. Unfortunately, the number of freely-available, open-source systems developed in C# framework that met our selection criteria is rather limited. So, we began our study with systems that were originally written in Java and had been ported to the .NET platform in order to take ad- vantage from the knowledge gained in the analysis of their respective Java counterparts. For the .NET metrics extraction, we used CLI [18], an assembly reader library that provides access to both the metadata and byte code. We added a small wrapper for the computation of the Gini coefficients and stored the resulting data in a text file for further processing with JSeat. We collected metrics data from four .NET systems: iTextSharp, NHibernate, SharpDevelop, and NAnt. The analysis of our 10 measures produced Gini coefficients equivalent to the ones determined for Java systems. How- ever, there were also exceptions. We observed a shift ex- ceeding 0.4 (i.e., individual Gini coefficients doubled in value) for almost all measures in NAnt version 0.8.3-rc1. The Gini coefficients stayed high until version 0.84-rc1, where they assumed “normal” values again. An inspection of the developer logs provided an explanation: in version 0.8.3-rc1, the NAntContrib project was integrated into the NAnt distribution. This project defines a number of utili- ties whose metrics exhibit very uneven distribution profiles caused by a centralization of event handling in a few classes. In version 0.84-rc1, the developers removed NAntContrib from NAnt resulting in a change by 0.4, returning the Gini coefficients for NAnt to their previous values. We discovered in our analysis that Gini coefficients nor- mally change little between adjacent releases. However, changes do happen and may result in significant fluctua- tions in Gini coefficients that warrant a deeper analysis (see Figure 4 showing selected Gini profiles for 51 consecutive releases of the Spring framework). But why do we see such a remarkable stability of Gini coefficients? Figure 4. Selected Gini profiles in Spring. Developers accumulate system competence over time. Proven techniques to solve a given problem prevail, where untested or weak practices have little chance of survival. If a team has historically built software in a certain way, then it will continue to prefer a certain approach over oth- ers. Moreover, we can expect that most problems in a given domain are similar, hence the means taken to tackle them would be similar, too. Tversky and Kahneman coined the term “decision frame” [27] to refer to this principle in which decision-makers proactively organize their solutions within well-established and strong boundaries defined by cultural environment and personal preferences. These boundaries 184 Comparative Analysis of Evolving Software Systems Using the Gini Coefficient Rajesh Vasa, Markus Lumpe, Philip Branch Faculty of Information & Communication Technologies Swinburne University of Technology P.O. Box 218, Hawthorn, VIC 3122, AUSTRALIA {rvasa,mlumpe,pbranch}@swin.edu.au Oscar Nierstrasz Institute of Computer Science University of Bern Bern, CH-3012, SWITZERLAND oscar@iam.unibe.ch Abstract Software metrics offer us the promise of distilling useful information from vast amounts of software in order to track development progress, to gain insights into the nature of the software, and to identify potential problems. Unfortunately, however, many software metrics exhibit highly skewed, non- Gaussian distributions. As a consequence, usual ways of interpreting these metrics — for example, in terms of “av- erage” values — can be highly misleading. Many metrics, it turns out, are distributed like wealth — with high concen- trations of values in selected locations. We propose to an- alyze software metrics using the Gini coefficient, a higher- order statistic widely used in economics to study the dis- tribution of wealth. Our approach allows us not only to observe changes in software systems efficiently, but also to assess project risks and monitor the development process it- self. We apply the Gini coefficient to numerous metrics over a range of software projects, and we show that many met- rics not only display remarkably high Gini values, but that these values are remarkably consistent as a project evolves over time. tions is to identify a number of characterizing properties, collect corresponding software metrics, and render the ob- tained data into meaningful information that can assist both developers and project managers in their decision making [13, 27]. Unfortunately, software metrics data are, in gen- eral, heavily skewed [7,12,30], which makes precise inter- pretation with standard descriptive statistical analysis diffi- cult. Summary measures like “average” or “mean” assume a Gaussian distribution to capture the central tendency in a given data set. However, when applied to non-Gaussian dis- tributions, central tendency measures become increasingly more unreliable the greater the distance is between a given distribution and a normal distribution. The shortcomings of central tendency measures are am- plified when we wish to compare skewed distributions. Any meaningful comparison requires additional effort to fit the distributions in question to a specially-designed third model distribution [1, 26]. This transformation is not only cum- bersome but also expensive and may not yield the desired result. Moreover, additional problems may arise due to changes in both the degree of concentration of individual values and and the total value of a distribution. Consider, for Gini  =  A/(A+B)
  • 25. 9  July  2013  -­‐  SATToSE,  Bern Evolu@on  of  diversity  in  open  source  soHware Econometric  indices Commits  sent E-­‐mails  sent Bug  reports  modified Evince 25 -­‐  Theil  index Corresponds  to  Shannon’s  no@on  of  entropy   Evidence for the Pareto principle in Open Source Software Activity Mathieu Goeminne and Tom Mens Institut d’Informatique, Facult´e des Sciences Universit´e de Mons – UMONS Mons, Belgium { mathieu.goeminne | tom.mens }@umons.ac.be Abstract—Numerous empirical studies analyse evolving open source software (OSS) projects, and try to estimate the activity and effort in these projects. Most of these studies, however, only focus on a limited set of artefacts, being source code and defect data. In our research, we extend the analysis by also taking into account mailing list information. The main goal of this article is to find evidence for the Pareto principle in this context, by studying how the activity of developers and users involved in OSS projects is distributed: it appears that most of the activity is carried out by a small group of people. Following the GQM paradigm, we provide evidence for this principle. We selected a range of metrics used in economy to measure inequality in distribution of wealth, and adapted these metrics to assess how OSS project activity is distributed. Regardless of whether we analyse version repositories, bug trackers, or mailing lists, and for all three projects we studied, it turns out that the distribution of activity is highly imbalanced. Index Terms—software evolution, activity, software project, data mining, empirical study, open source software, GQM, Pareto I. INTRODUCTION Numerous empirical studies aim to understand and model how open source software (OSS) evolves over time [1]. In order to gain a deeper understanding of this evolution, it is essential to study not only the software artefacts that evolve (e.g. source code, bug reports, and so on), but also their interplay with the different project members (mainly developers and users) that communicate (e.g., via mailing lists) and collaborate in order to construct and evolve the software. In this article, we wish to understand how activity is spread over the different members of an OSS project, and how this activity distribution evolves over time. Our hypothesis is that the distribution of activity follows the Pareto principle, in the sense that there is a small group of key persons that carry out most of the activity, regardless of the type of considered activity. To verify this hypothesis, we carry out an empirical study based on the GQM paradigm [2]. We rely on concepts borrowed from econometrics (the use of measurement in economy), and apply them to the field of OSS evolution. In particular, we apply indices that have been introduced for measuring distribution (and inequality) of wealth, and use them to measure the distribution of activity in software development. The remainder of this paper is structured as follows. Sec- tion II explains the methodology we followed and defines the metrics that we rely upon. Section III presents the ex- perimental setup of our empirical study that we have carried out. Section IV presents the results of our analysis of activity distribution in three OSS projects. Section V discusses the evidence we found for the Pareto principle. Section VI presents related work, and Section VII concludes. II. METHODOLOGY A. GQM paradigm To gain a deeper understanding of how OSS projects evolve, we follow the well-known Goal-Question-Metric (GQM) paradigm. Our main research Goal is to understand how ac- tivity is distributed over the different stakeholders (developers and users) involved in OSS projects. Once we have gained deeper insight in this issue, we will be able to exploit it to provide dedicated tool support to the OSS community, e.g., by helping newcomers to understand how the community is structured, by improving the way in which the community members communicate and collaborate, by trying to reduce the potential risk of the so-called bus factor1 , and so on. To reach the aforementioned research goal, we raise the following research Questions: 1) Is there a core group of OSS project members (develop- ers and/or users) that are significantly more active than the other members? 2) How does the distribution of activity within an OSS community evolve over time? 3) Is there an overlap between the different types of activity (e.g., committing, mailing, submitting and changing bug reports) the community members contribute to? 4) How does the distribution of activity vary across differ- ent OSS projects? As a third step, we need to select appropriate Metrics that will enable us to provide a satisfactory answer to each of the above research questions. For our empirical study, we will make use of basic metrics to compute the activity of OSS project members, and aggregate metrics that allow us to com- pare these basic metric values across members (to understand how activity is distributed), over time (to understand how they 1The bus factor refers to the total number of key persons (involved in the project) that would, if they were to be hit by a bus, lead the project into serious problems Brasero
  • 26. 9  July  2013  -­‐  SATToSE,  Bern 26 SoHware  Ecosystem  Biodiversity • Uses  no@on  of  biodiversity  to   measure  developer  ac)vity  focus   and  module  ac)vity  focus Cf.  bipar@te  author-­‐module  graph • Based  on  no@on  of  rela)ve  entropy • More  details:  see  results  of   hackaton. Dual Ecological Measures of Focus in Software Development Daryl Posnett†, Raissa D’Souza∗, Premkumar Devanbu,† and, Vladimir Filkov† †∗University of California Davis, USA †{dpposnett,ptdevanbu,vfilkov}@ucdavis.edu,∗raissa@cse.ucdavis.edu Abstract—Work practices vary among software developers. Some are highly focused on a few artifacts; others make wide- ranging contributions. Similarly, some artifacts are mostly au- thored, or “owned”, by one or few developers; others have very wide ownership. Focus and ownership are related but different phenomena, both with strong effect on software quality. Prior studies have mostly targeted ownership; the measures of own- ership used have generally been based on either simple counts, information-theoretic views of ownership, or social-network views of contribution patterns. We argue for a more general concep- tual view that unifies developer focus and artifact ownership. We analogize the developer-artifact contribution network to a predator-prey food web, and draw upon ideas from ecology to produce a novel, and conceptually unified view of measuring focus and ownership. These measures relate to both cross-entropy and Kullback-Liebler divergence, and simultaneously provide two normalized measures of focus from both the developer and artifact perspectives. We argue that these measures are theoret- ically well-founded, and yield novel predictive, conceptual, and actionable value in software projects. We find that more focused developers introduce fewer defects than defocused developers. In contrast, files that receive narrowly focused activity are more likely to contain defects than other files. I. INTRODUCTION Developers are the lifeblood of open source software, OSS, and their contributions are vital for OSS to thrive. Rather than being assigned tasks by management, OSS developers are generally free to choose the style, focus, and breadth of their contributions. Some might be quite focused, working on one specific subsystem; others may contribute to many different subsystems. An device driver expert, for example, may con- tribute very specialized knowledge to an open source project, focusing on only a few files or packages. His contributions to a small subset of modules1 may be his only contribution during his tenure with the project. In contrast, a project leader may work on a variety of different tasks touching many modules within a project. While OSS developers are free to choose their contribution styles, such choices are not inconsequential, especially to the central issue of software quality. A dominant theme emerging from previous work in this area is module ownership [1], [2], [3]. Low ownership of a module, i.e., too many contributors, can adversely impact code quality. There is, however, an entirely different perspective, developer’s attention focus, which is relatively unexplored. Human attention and cognition are finite resoucres [4]. When different tasks are simultaneously engaged, they can compete 1We use modules to mean either packages or files, depending on the context. for mental resources and task performance can suffer [5]. A developer engaged in many different tasks carries a greater cognitive burden than a more focused developer. Interestingly, the developer and module perspectives are, conceptually sym- metric, dualistic views of focus. From a module’s perspective, strong ownership indicates a strong focused contribution. We refer to this as module activity focus, or MAF, a measure of how focused the activities are on a module. Symmetrically, we refer to the developer’s attention focus, or DAF, a measure of how focused the activities are of a particular developer. A surprising, but natural analogy for MAF and DAF, are predator-prey food webs from ecology. In a sense, modules are predators that “feed upon” the cognitive resources of developers. As the number of developers contributing to a module increases, the diversity of cognitive resources upon which the module “feeds” also increases; likewise, a developer is a “prey” whose limited cognitive resources are spread over the modules that “prey” upon her. Ecosystem diversity is of great interest to ecologists. Williams and Martinez call the roles complexity and diversity play “[o]ne of the most important and least settled questions in ecology.” [6] This diversity has two symmetric perspectives, both from a prey’s perspective, and a predator’s perspective. Ecologists have developed sophisticated symmetric measures of predator-prey relationships, drawing upon ideas such as entropy and Kulback-Leibler divergence, that simultaneously capture both perspectives. We adapt these measures for soft- ware engineering projects into the metrics MAF and DAF. In this work, we employ the methodology presented by El Emam to validate our measures [7]. In particular, we show that the DAF and MAF measures succeed in distinguishing important cases that extant measures don’t capture. We make the following contributions: • We adapt terminology and motivation from ecology, based on bipartite graphs; • We incorporate and generalize previous results on devel- oper and artifact diversity; • We provide easy to compute measures of focus, MAF and DAF, normalized to facilitate comparison within and across projects; • We show these measures more precisely capture out- comes relevant to software researchers and practitioners. This novel analysis simultaneously considers focus both from the artifact perspective and the author perspective. Researchers can use our MAF and DAF metrics to more 978-1-4673-3074-9/13/$31.00 c 2013 IEEE ICSE 2013, San Francisco, CA, USA452 ICSE   2013
  • 27. Migra@on  in  soHware  ecosystems Gnome  case  study
  • 28. 9  July  2013  -­‐  SATToSE,  Bern 28 Migra@on  in  soHware  ecosystems • How  do  soHware  projects  evolve? – Analogy  to  “gene  transfer”  in  re@culate  evolu@on • Transfer  of  knowledge – Sharing  or  migra@on  of  contributors  across  projects • Transfer  of  code – Copy-­‐paste  reuse  and  code  cloning – Branching  and  merging  of  code  repositories
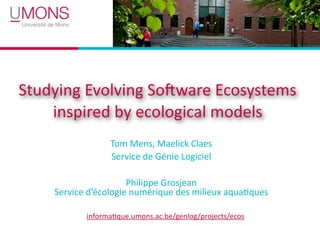
  • 29. C Java Objective C Python Lisp JS ASP.Net C/C++ Header C++ Perl yacc C# IDL Haskell Objective C++ lexAssembly Visual Basic PHP Ruby Tcl/Tk 1e+05 1e+07 100 1000 10000 Files LOC 9  July  2013  -­‐  SATToSE,  Bern Migra@on  in  soHware  ecosystems Gnome  case  study 29 • 16  years  of  ac@vity • >  1400  projects • >  5800  contributors  (>  4300  coders) • >  1.3M  of  commits  (>  0.6M  of  code  commits) • >  12M  of  file  touches  (>  6M  of  codefile  touches)
  • 30. 9  July  2013  -­‐  SATToSE,  Bern Migra@on  in  soHware  ecosystems Gnome  case  study 30 Hierarchical  clustering  of  projects Developers  tend  to  collaborate  more  if  they  use  the  same  programming  language
  • 31. 9  July  2013  -­‐  SATToSE,  Bern Migra@on  in  soHware  ecosystems Gnome  case  study 31
  • 32. Time Joiners 1997 1999 2001 2003 2005 2007 2009 2011 2013 05101520253035 9  July  2013  -­‐  SATToSE,  Bern 32 Migra@on  in  soHware  ecosystems Gnome  case  study Evolu@on Gimp GTK+ joiners are incoming coders in the considered project that were not active in any of the GNOME projects during the preceding period. A similar definition holds for the local and global leavers. Formally, the metrics are defined as follows. Let p be a GNOME project, t a 6-month activity period (and t 1 the previous period), c a coder, Gnome the set of GNOME’s code projects, and isDev(c,t, p) is a predicate which is true if and only if c made a code commit in p during t: localLeavers(p,t) = {c|isDev(c,t 1, p)^¬isDev(c,t, p)^9p2 (p2 2 Gnome^isDev(c,t, p2))} globalLeavers(p,t) = {c|isDev(c,t 1, p)^8p2 (p2 2 Gnome ) ¬isDev(c,t, p2))} localJoiners(p,t) = {c|isDev(c,t, p)^¬isDev(c,t 1, p)^9p2 (p2 2 Gnome^isDev(c,t 1, p2))} globalJoiners(p,t) = {c|isDev(c,t, p)^8p2 (p2 2 Gnome ) ¬isDev(c,t 1, p2))} Time Joiners 1997 1999 2001 2003 2005 2007 2009 2011 2013 051015202530 Time Joiners 1997 1999 2001 2003 2005 2007 2009 2011 2013 051015202530 Time Joiners 1997 1999 2001 2003 2005 2007 2009 2011 2013 051015202530 evolution gtk+ gimp Fig. 1.11 Historical evolution (timeline) of the number of local (black solid) and global (red dashed) joiners (y-axis) for three GNOME projects. We did not find any general trend, the patterns of intake and loss of coders are highly project-specific. Figure 1.11 illustrates the evolution of the number of local and global joiners for some of the more important GNOME projects (the figures for leavers are very similar). For some projects (e.g., evolution) we do not observe a big difference between the number of local and global joiners, respectively. These projects seem to attract new developers both from within and outside of GNOME. Other projects, like gimp, attract most of its incoming developers from outside GNOME. A third category of projects attracts most of its incoming developers from other GNOME projects. This is the case for gtk+, glib and libgnome, which can be considered as belonging to the core of GNOME. This observation seems to Timeline  (6-­‐month  intervals) of  joiners  to  Gnome  projects -­‐  Black  =  local  joiners  from  other  Gnome  projects -­‐  Red  =  global  joiners  from  outside  of  Gnome -­‐  Blue  =  stayers Time Joiners 1997 1999 2001 2003 2005 2007 2009 2011 2013 05101520253035 Time Joiners 1997 1999 2001 2003 2005 2007 2009 2011 2013 05101520253035
  • 33. Time 1997 1999 2001 2003 2005 2007 2009 2011 2013 05101520253035 Time Leavers 1997 1999 2001 2003 2005 2007 2009 2011 2013 05101520253035 Time Leavers 1997 1999 2001 2003 2005 2007 2009 2011 2013 05101520253035 9  July  2013  -­‐  SATToSE,  Bern 33 Migra@on  in  soHware  ecosystems Gnome  case  study Evolu@on Gimp GTK+ -­‐  Black  =  local  joiners  from  other  Gnome  projects -­‐  Red  =  global  joiners  from  outside  of  Gnome -­‐  Blue  =  stayers 28 Tom Mens, Ma¨elick Claes, Philippe Grosjean and Alexander Serebrenik project that were not active in this project during the preceding 6-month period, but that were involved in some activity in other GNOME projects instead. Global joiners are incoming coders in the considered project that were not active in any of the GNOME projects during the preceding period. A similar definition holds for the local and global leavers. Formally, the metrics are defined as follows. Let p be a GNOME project, t a 6-month activity period (and t 1 the previous period), c a coder, Gnome the set of GNOME’s code projects, and isDev(c,t, p) is a predicate which is true if and only if c made a code commit in p during t: localLeavers(p,t) = {c|isDev(c,t 1, p)^¬isDev(c,t, p)^9p2 (p2 2 Gnome^isDev(c,t, p2))} globalLeavers(p,t) = {c|isDev(c,t 1, p)^8p2 (p2 2 Gnome ) ¬isDev(c,t, p2))} localJoiners(p,t) = {c|isDev(c,t, p)^¬isDev(c,t 1, p)^9p2 (p2 2 Gnome^isDev(c,t 1, p2))} globalJoiners(p,t) = {c|isDev(c,t, p)^8p2 (p2 2 Gnome ) ¬isDev(c,t 1, p2))} Time Joiners 1997 1999 2001 2003 2005 2007 2009 2011 2013 051015202530 Time Joiners 1997 1999 2001 2003 2005 2007 2009 2011 2013 051015202530 Time Joiners 1997 1999 2001 2003 2005 2007 2009 2011 2013 051015202530 evolution gtk+ gimp Fig. 1.11 Historical evolution (timeline) of the number of local (black solid) and global (red dashed) joiners (y-axis) for three GNOME projects. We did not find any general trend, the patterns of intake and loss of coders are highly project-specific. Figure 1.11 illustrates the evolution of the number of local and global joiners for some of the more important GNOME projects (the figures for leavers are very similar). For some projects (e.g., evolution) we do not observe a big difference between the number of local and global joiners, respectively. These projects seem to attract new developers both from within and outside of GNOME. Timeline  (6-­‐month  intervals) of  leavers  from  Gnome  projects
  • 34. Time 1997 1999 2001 2003 2005 2007 2009 2011 2013 05101520253035 Time Leavers 1997 1999 2001 2003 2005 2007 2009 2011 2013 05101520253035 Time Leavers 1997 1999 2001 2003 2005 2007 2009 2011 2013 05101520253035 9  July  2013  -­‐  SATToSE,  Bern 34 Migra@on  in  soHware  ecosystems Gnome  case  study Evolu@on Gimp GTK+ CF(p)  =  Collabora@on  factor  for  Gnome  project  p =  percentage  of  coders  in  p  having  contributed  to  other  Gnome  projects CF(Gimp)  =  65,3% (low  collabora@on) CF(GTK+)  =  94,8% (very  high  collabora@on) CF(Evolu@on)  =  85,1% (high  collabora@on)
  • 35. 9  July  2013  -­‐  SATToSE,  Bern Migra@on  in  soHware  ecosystems Gnome  case  study 35
  • 36. 9  July  2013  -­‐  SATToSE,  Bern Some  references 36 To appear in 2013 in Springer’s Empirical Software Engineering journal – manuscript (will be inserted by the editor) On the variation and specialisation of workload – A case study of the Gnome ecosystem community Bogdan Vasilescu · Alexander Serebrenik · Mathieu Goeminne · Tom Mens DOI: 10.1007/s10664-013-9244-1 Chapter 10 Studying Evolving Software Ecosystems based on Ecological Models Tom Mens, Ma¨elick Claes, Philippe Grosjean and Alexander Serebrenik Research on software evolution is very active, but evolutionary principles, models and theories that properly explain why and how software systems evolve over time are still lacking. Similarly, more empirical research is needed to understand how different software projects co-exist and co-evolve, and how contributors collaborate within their encompassing software ecosystem. In this chapter, we explore the differences and analogies between natural ecosys- tems and biological evolution on the one hand, and software ecosystems and soft- ware evolution on the other hand. The aim is to learn from research in ecology to advance the understanding of evolving software ecosystems. Ultimately, we wish to use such knowledge to derive diagnostic tools aiming to analyse and optimise the fitness of software projects in their environment, and to help software project communities in managing their projects better. Tom Mens and Ma¨elick Claes and Philippe Grosjean COMPLEXYS Research Institute, University of Mons, Belgium e-mail: tom.mens,maelick.claes,philippe.grosjean@umons.ac.be Alexander Serebrenik Eindhoven University of Technology, The Netherlands e-mail: a.serebrenik@tue.nl This work has been partially supported by F.R.S-F.N.R.S. research grant BSS-2012/V 6/5/015 author’s stay at the Universit´e de Mons, supported by the F.R.S-F.N.R.S. under the grant BSS- 2012/V 6/5/015. and ARC research project AUWB-12/17-UMONS-3,“Ecological Studies of Open Source Software Ecosystems” financed by the Minist`ere de la Communaut´e franc¸aise - Direction g´en´erale de l’Enseignement non obligatoire et de la Recherche scientifique, Belgium. 245 UMONS Faculté des Sciences Département d’Informatique Understanding the Evolution of Socio-technical Aspects in Open Source Ecosystems: An Empirical Analysis of GNOME Mathieu Goeminne A dissertation submitted in fulfillment of the requirements of the degree of Docteur en Sciences Advisor Jury Dr. TOM MENS Dr. XAVIER BLANC Université de Mons, Belgium Université de Bordeaux 1, France Dr. VÉRONIQUE BRUYÈRE Université de Mons, Belgium Dr. JESUS M. GONZALEZ-BARAHONA Universidad Rey Juan Carlos, Spain Dr. TOM MENS Université de Mons, Belgium Dr. ALEXANDER SEREBRENIK Technische Universiteit Eindhoven, The Netherlands Dr. JEF WIJSEN Université de Mons, Belgium June 2013 A historical dataset for GNOME contributors Mathieu Goeminne, Ma¨elick Claes and Tom Mens Software Engineering Lab, COMPLEXYS research institute, UMONS, Belgium Abstract—We present a dataset of the open source software ecosystem GNOME from a social point of view. We have collected historical data about the contributors to all GNOME projects stored on git.gnome.org, taking into account the problem of identity matching, and as- sociating different activity types to the contributors. This type of information is very useful to complement the traditional, source-code related information one can ob- tain by mining and analyzing the actual source code. The dataset can be obtained at https://bitbucket.org/ mgoeminne/sgl-flossmetric-dbmerge. I. INTRODUCTION In this paper, we present the process we have used to create a dataset containing the historical information related to contributors to the GNOME ecosystem. Our database and the tools and scripts used to created it can be found on a dedicated Bitbucket repository2 . In contrast to many other datasets, we do not focus on source code, since a significant amount of files commit- ted to GNOME’s project repositories do not even contain code (e.g., image files, web pages, documentation, lo- calization and many more). Such type of information is often ignored in MSR research while it is very relevant to understand which types of activities contributors are @  MSR  2013 [to  appear  in  2014]