Baixado 36 vezes


![Atlas Brasileiro de Energia Solar
INTRODUÇÃO INTRODUCTION
O aumento da demanda e consumo de energia decorrente do
progresso tecnológico e do avanço no desenvolvimento humano
T he increase in demand and consumption of energy resulting from
the technological progress and the improvement of human
(caracterizado por parâmetros sócio-econômicos) são apontados como development (characterized by social-economic parameters) are
os fatores mais importantes na aceleração das alterações climáticas e being blamed as the most important factors in accelerating climatic
ambientais observadas e descritas pela comunidade científica. O and environmental changes observed and described by the scientific
crescimento do consumo de energia mais que triplicou após a community. The energy consumption raised more than three fold
Revolução Industrial e estudos recentes mostram uma tendência de after the Industrial Revolution and recent studies show a growth
crescimento da demanda energética em conseqüência da recuperação trend in energy demand as a consequence of the economical
econômica nos países em desenvolvimento. A tendência de recovery in developing countries. The present growth rate shows that
crescimento atual aponta que, provavelmente, na segunda década the energy consumption in developed countries will be surpassed by
deste século, o consumo de energia nos países desenvolvidos seja the consumption in the developing countries in the second decade
ultrapassado pelo consumo nos países em desenvolvimento em virtude of this century, due to the improvement of the socioeconomic
da melhoria dos parâmetros sócio-econômicos nesses países [1]. parameters within these countries [1].
O T
aumento da demanda energética em conjunto com a
possibilidade de redução da oferta de combustíveis convencionais e a
crescente preocupação com a preservação do meio ambiente estão
he increase in energy demand in conjunction with the possibility
of a reduction in the supply of conventional fuels and the increasing
concern with preserving the environment are driving the scientific
9
impulsionando a comunidade científica a pesquisar e desenvolver community to research and develop alternate energy sources that
fontes alternativas de energia menos poluentes, renováveis e que are less polluting, renewable and have a lesser impact on the
produzam pouco impacto ambiental. environment.
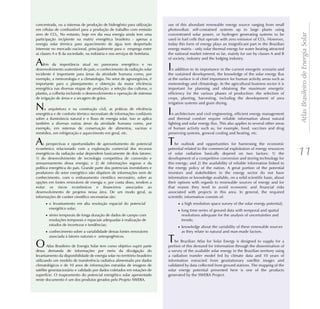
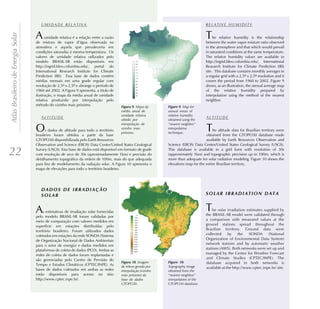
A Figura 1a apresenta a
estrutura da matriz de oferta
F igure 1a shows the matrix
structure of the primary
de energia primária brasileira e Brazilian energy supply and
a Figura 1b a empregada na Figure 1b the energy matrix
produção de eletricidade. A used in the production of
queima de combustíveis fósseis electricity. The fossil fuels is
responde por grande parte da responsible for great part of
demanda de energia no setor the energy demanded by the
de transporte e atende a cerca transportation sector and
de 40% da energia utilizada no provides about 40% of the
setor agropecuário brasileiro energy used by the Brazilian
causando a contribuição mais farming sector. Incentive
importante em emissão de programs to adopt the bio-
gases do efeito estufa (CO2, . (a) Matriz energética brasileira . (a) Brazilian energy matrix mass fuels (ethanol and
CO, etc.) no Brasil. Programas e (b) Matriz de energia elétrica [2]. and (b) Electric power matrix [2]. biodiesel) are being imple-
de incentivo para adoção de mented in the country [2] and
queima de biomassa (etanol e biodiesel) estão em implementação no it is expected that in a not too distant future, biomass will make a
país [2] e espera-se que num futuro próximo, a biomassa tenha uma significant contribution towards these sectors thereby reducing the
contribuição significativa nesses setores reduzindo a contribuição Brazilian contribution for the global emission of gases that cause the
brasileira para a emissão global de gases de efeito estufa. greenhouse effect.](https://image.slidesharecdn.com/brazilsolaratlasr1-130313102328-phpapp02/85/Brazil-solar-atlas_r1-11-320.jpg)
![A tualmente, a energia hidráulica é a principal fonte de energia para P resently, hydroelectric power is the main source of power
Atlas Brasileiro de Energia Solar
geração de eletricidade no Brasil. Apesar de ser considerada uma fonte generation in Brazil. In spite of being considered a renewable and
renovável e limpa, as usinas hidroelétricas produzem um impacto clean source of energy, the hydroelectric power plants cause an
ambiental ainda não adequadamente avaliado, devido ao alagamento impact on the environment not yet fully assessed, due to the flooding
de grandes áreas cultiváveis [3]. Estudos mostram que gases do efeito of vast agricultural or pristine forested areas [3]. Studies show that
estufa, principalmente o Metano (CH4), são emitidos para atmosfera em greenhouse gases, mainly methane (CH4), are released into the
conseqüência de processos de degradação anaeróbica da matéria atmosphere as a consequence of the anaerobic decomposition of
orgânica que ocorrem em áreas alagadas [4]. Além disso, as principais organic matter that takes place in flooded areas [4]. In addition, the
bacias hidrográficas brasileiras com capacidade de geração hidroelétrica main hydrographic basins suitable for high-density hydroelectric
de alta densidade energética já estão praticamente esgotadas nos power generation have practically all been used up primarily the
principais centros consumidores do País. ones near to the main Brazilian consumption centers.
A energia nuclear é citada como uma fonte “limpa” de energia
elétrica por não provocar a emissão de gases de efeito estufa para a
T he nuclear energy is often mentioned as a "clean" power source
because it does not release greenhouse gases into the atmosphere.
atmosfera. Sob o ponto de vista do desenvolvimento, é uma alternativa From the development point of view, it is an alternative to diversify
para cobrir o déficit de energia previsto, diversificar as fontes de energia the national energy supply, to make the Brazilian nuclear energy
nacionais e viabilizar o programa nuclear brasileiro. O país conta com program viable, and to reduce the expected energy deficit. Brazil
a sexta maior reserva de urânio do mundo e apenas 25% do território already figures as having the sixth largest uranium reserve in the
nacional foram mapeados. Por conta disso, o governo retomou o world, despite that only 25% of the national territory has been
projeto de construção da usina nuclear de Angra III, com capacidade surveyed thus far. Because of that the government resumed the
de 1.300 MW, completando assim o ciclo que iniciou com Angra 1 em project of building the Angra III nuclear power plant with a capacity
1985. Contudo, a energia nuclear não tem sido bem aceita pela of 1,300 MW, thereby completing the cycle started with Angra I in
sociedade civil em razão do questionamento sobre os riscos associados 1985. However, nuclear energy has not been well accepted by the
e ao problema do armazenamento dos rejeitos radioativos gerados. public (or citizens) due to the risks issues linked to the power plant
operation and the radioactive waste management and storage.
10 D entre as fontes renováveis de energia elétrica, a energia eólica é a
que vem recebendo maior volume de investimentos por conta do A mong various renewable forms of electric power, wind energy is
Programa de Incentivo às Fontes Alternativas de Energia Elétrica the one receiving the largest portion of investments from the
(PROINFA – http://www.mme.gov.br/), coordenado pelo Ministério de Incentive Program for Alternate Electric Power Sources (PROINFA –
Minas e Energia. A capacitação tecnológica da indústria nacional e o http://www.mme.gov.br/), coordinated by the Mines and Energy
custo decrescente da eletricidade de origem eólica, quando associados Ministry. The technological qualification of the national industry and
ao enorme potencial eólico nacional (143,5 GW segundo o Atlas do the decreasing cost of wind generated electric power, when
Potencial Eólico Brasileiro [5]), indicam que essa forma de geração associated with the huge national wind potential (143.5 GW
poderá ocupar, em médio prazo, um importante papel no país, according to the Atlas of Brazilian Wind Power Potential [5]), indicate
principalmente atuando como fonte descentralizada e complementar that this form of power generation may play, at least in the medium
de energia acoplada a rede elétrica. No entanto, segundo essa mesma term, a very important role in Brazil, mainly acting as a decentralized
fonte de informação, boa parte do território brasileiro, incluindo and complementary power source coupled to the electric network.
praticamente toda a região amazônica e central do Brasil, não apresenta However, according to this very same source of information, a good
condição de vento adequada para geração de eletricidade. portion of the Brazilian territory, including almost the entire Amazon
region and the central part of Brazil, do not hold the adequate wind
P or outro lado, o Brasil, por ser um país localizado na sua maior parte conditions for electric power generation.
na região inter-tropical, possui grande potencial para aproveitamento
de energia solar durante todo ano [6, 7]. A utilização da energia solar traz
benefícios a longo prazo para o país, viabilizando o desenvolvimento de
B ut since Brazil is mostly located in the inter-tropical region, it has
a great potential to capture solar energy during the entire year [6, 7].
regiões remotas onde o custo da eletrificação pela rede convencional é Solar power utilization brings long term benefits to the nation making
demasiadamente alto com relação ao retorno financeiro do possible the development of remote regions where the cost of
investimento, regulando a oferta de energia em períodos de estiagem, electric power by the conventional methods would be too high for
diminuindo a dependência do mercado de petróleo e reduzindo as an attractive financial return on the investment. In addition, solar
emissões de gases poluentes à atmosfera como estabelece a energy would contribute to regulate the energy during drought
Conferência de Kyoto [8]. Existe um grande leque de possibilidades a periods and thereby diminishing the dependency on the crude oil
médio e longo prazo para aproveitamento dessa abundante forma de market with a consequent decrease in polluting gas emissions into
energia renovável, que vai desde pequenos sistemas fotovoltaicos the atmosphere as established by the Kyoto Conference [8]. There is
autônomos até as grandes centrais que empregam energia solar a great variety of possibilities on the medium and long term for the](https://image.slidesharecdn.com/brazilsolaratlasr1-130313102328-phpapp02/85/Brazil-solar-atlas_r1-12-320.jpg)
![Atlas Brasileiro de Energia Solar
MODELO DE TRANSFERÊNCIA RADIATIVE TRANSFER MODEL
RADIATIVA
B asicamente, existem dois métodos para o levantamento dos
recursos de energia solar em uma região extensa: a utilização de uma
B asically there are two methods to survey the solar energy resources
in a given area of interest: the utilization of a radiometer network
rede de radiômetros distribuídos pela região em conjunto com técnicas distributed over the region along with data interpolation techniques,
de interpolação dos dados de radiação coletados; e o uso de modelos and the use of computer models to estimate the incidence of solar
computacionais para determinação de estimativas da radiação solar radiation through empirical relations or by solving the physical
incidente por meio de relações empíricas ou da solução da equação de equations that describe the radiative transfer in the atmosphere.
transferência radiativa na atmosfera.
E mbora os dados de radiação
I n spite of the fact that the
radiation data obtained through
obtidos através de radiômetros radiometers, usually, present
apresentem, na grande maioria confidence levels over and above
das vezes, níveis de confia- those obtained through radiation
bilidade superiores àqueles que models, such as the one used in
podem ser obtidos através de
modelos radiativos, como o
empregado nesse trabalho, o
this work, it cannot be generalized
for the interpolation results
between radiometers. Perez et al.
13
mesmo não pode ser generalizado [9] demonstrated that when the
para os resultados de inter- distances between radiometers in
polações entre os radiômetros. a ground net-work are greater than
Perez et al. [9] demonstrou que, 45 km, the interpolated data of the
quando as distâncias entre os daily total radiation exhibit
radiômetros de uma rede de confidence levels below the
observação forem superiores a 45 estimates obtained with computer
km, os dados interpolados de models that use satellite images. A
totais diários de irradiação similar result was obtained in a
apresentam níveis de confiabili- study using data acquired by 16
dade inferiores às estimativas automatic weather stations
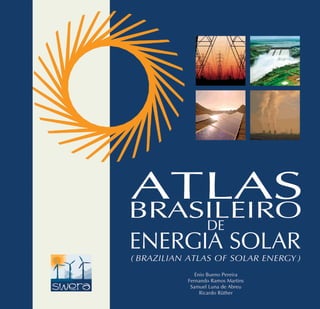
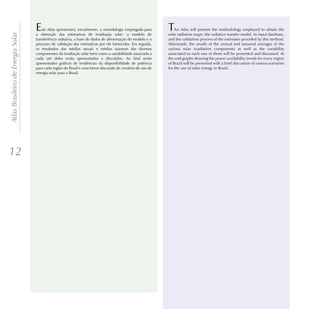
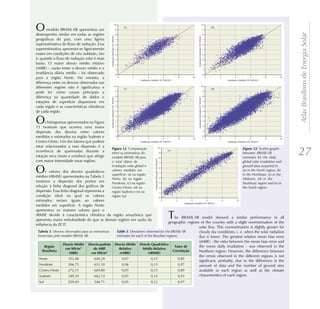
obtidas com modelos que utilizam . Comparação dos desvios . Comparison between operated by CPTEC/INPE in the
imagens de satélite. Resultado rRMSE das estimativas de radiação rRMSE deviations observed for South-eastern region of Brazil [10]
similar foi obtido em um estudo global obtidas por global solar radiation estimates (Figure 2).
empregando-se dados obtidos em extra/interpolação de dados obtained by extra/interpolation of
16 plataformas de coleta de dados coletados em 16 PCDs da região ground data acquired at 16 AWS in
sudeste e estimativas do modelo operation at Southeast region of
operadas pelo CPTEC/INPE na
BRASIL-SR baseadas em imagens de Brazil and obtained by using
região Sudeste do Brasil [10] satélite. A linha magenta representa BRASIL-SR model and satellite
(Figura 2). a curva de tendência dos desvios images. The magent line is the
das estimativas por tendency curve of
extra/interpolação em função da extra/interpolation deviations as a
distância à PCD mais próxima. As function of distance from the
linhas horizontais representam o nearest AWS. The horizontal lines
intervalo dos desvios de estimativas represent the range of deviation
fornecidas pelo modelo BRASIL-SR. values obtained by using BRASIL-SR.](https://image.slidesharecdn.com/brazilsolaratlasr1-130313102328-phpapp02/85/Brazil-solar-atlas_r1-15-320.jpg)
![Atlas Brasileiro de Energia Solar
A o atravessar a atmosfera, a radiação solar é atenuada por processos
físicos de espalhamento e absorção com os constituintes atmosféricos e
W hen passing through the atmosphere the solar radiation has its
intensity reduced through scattering and absorption processes by the
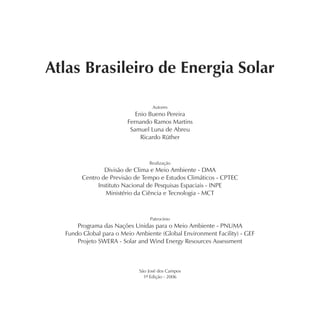
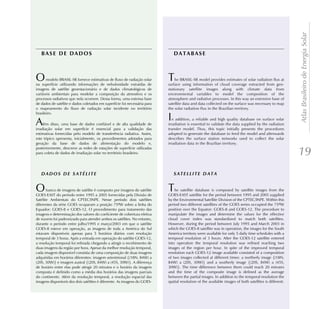
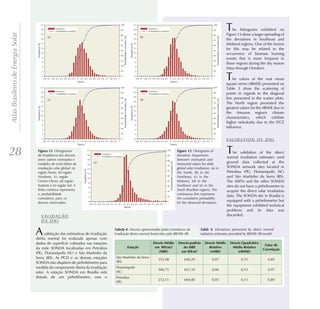
a superfície do planeta. Na Figura 3 estão representados, de forma atmospheric components. Figure 3 represents, in a very simplified way,
bastante simplificada, os principais processos de interação da radiação the main interacting processes of solar radiation and thermal radiation
solar e da radiação térmica no sistema Atmosfera-Terra. of the Earth-Atmosphere system.
A s nuvens, os gases,
partículas atmosféricas e a
T he clouds, the gases,
atmospheric particles, and
superfície refletem cerca the surface reflect about
de 30% da radiação inci- 30% of the radiation inci-
dente no topo da atmos- dence at the top of the
fera. Os 70% restantes são atmosphere. The other
absorvidos produzindo 70% are absorbed in hea-
aquecimento do sistema e ting up the system and
causando evaporação de causing water evaporation
água (calor latente) ou (latent heat) or convection
convecção (calor sensível). (sensible heat). The energy
A energia absorvida pelo absorbed by the Earth-
sistema Terra-Atmosfera é Atmosphere system is re-
reemitida na faixa do emitted back to space in
infravermelho do espectro the infrared spectrum band
14 de radiação eletromag-
nética – 4 a 100µm –
sendo que 6% é
of electromagnetic radia-
tion - 4 to 100µm - where
6% comes from the surface
proveniente da superfície . Diagrama simbólico dos processos . Diagram of radiative processes of and 64% from clouds and
e 64% tem origem em de interação da radiação solar com a solar radiation in the Earth's atmosphere. other atmospheric com-
nuvens e constituintes atmosfera terrestre. Os valores numéricos The numeric values represent the energy ponents.
atmosféricos. representam a fração de energia em cada fraction in each radiation process in the
P ara estimar o fluxo de
processo radiativo na atmosfera. Modificado
a partir de Gambi [11].
atmosphere. Modified from Gambi [11].
T o estimate the solar ra-
diation flux at the surface,
radiação solar na superfície, os modelos utilizam parametrizações que the models use parameterizations that simulate these physical processes
simulam esses processos físicos na atmosfera. As parametrizações in the atmosphere. The parameterizations are based on data collected
baseiam-se em dados coletados em superfície ou por satélites que on a surface or through satellites that allow inferring the optical
permitem inferir as propriedades óticas da atmosfera e, portanto, a properties of the atmosphere and thereby the contribution of each
contribuição de cada processo radiativo na transmitância atmosférica radiation process in the total atmospheric transmission of solar radiation.
total da radiação solar.
T ais modelos podem ser classificados em estatísticos e físicos. Os
S uch models may be classified as stochastic and physical. The
stochastic models use empirical formulations between radiation
modelos estatísticos utilizam formulações empíricas entre medidas de incidence measurements at the surface and local atmospheric
radiação incidente na superfície e condições atmosféricas locais e, conditions and generally are valid only for the region being studied. The
geralmente, apresentam validade restrita à região estudada. Já os physical models on the other hand are valid for any region as they solve
modelos físicos são válidos para qualquer região uma vez que the radiative transfer equation that mathematically describes the
solucionam a equação de transferência radiativa que descreve physical processes in the atmosphere. The main difficulty in applying
matematicamente os processos físicos que ocorrem na atmosfera. A the physical models resides in obtaining the necessary data to
principal dificuldade da aplicação de modelos físicos reside na parameterize the interactions between solar radiation and the
obtenção dos dados necessários para a parametrização das interações atmospheric components. Among these data, cloud coverage and the
entre a radiação solar e os cons-tituintes atmosféricos. Entre esses dados profile of atmospheric components such as aerosols, water vapor, ozone
pode-se citar a cobertura de nuvens e o perfil dos constituintes and other gases can be mentioned.](https://image.slidesharecdn.com/brazilsolaratlasr1-130313102328-phpapp02/85/Brazil-solar-atlas_r1-16-320.jpg)
![atmosféricos como aerossóis, vapor
d’água, ozônio e outros gases S everal techniques were developed
Atlas Brasileiro de Energia Solar
atmosféricos. to obtain the exact solution of the
radiative transfer equation. Among
V árias técnicas foram desenvolvidas
para obtenção da solução exata da
them, the methods which use spherical
harmonics, discrete ordinates, the
equação de transferência radiativa. Monte Carlo technique and finite
Dentre elas pode-se citar os métodos differences [12] can be pointed out.
que utilizam harmônicos esféricos, These techniques require a long
ordenadas discretas, técnica de Monte computational time and impose a
Carlo e diferenças finitas [12]. Estas heavy demand of computing memory,
técnicas necessitam um tempo which precludes their operational use.
computacional elevado, inviabilizando As an alternative, approximate methods
seu uso operacional. Como alternativa, were developed that demand less
foram desenvolvidos métodos computing requirements and allow
aproximados que demandam um obtaining reliable solar radiation
tempo computacional muito menor e estimates for operational and routine
possibilitam a obtenção de estimativas purposes.
confiáveis de irradiação solar para
utilização operacional e rotineira.
15
O modelo BRASIL-SR é um modelo
físico para obtenção de estimativas da T he BRASIL-SR model is a physical
radiação solar incidente na superfície model to obtain solar radiation
que combina a utilização da incidence estimates on the surface that
aproximação de “Dois-Fluxos” na combines the "Two-Stream" approach
solução da equação de transferência to solve the radiative transfer equation
radiativa com o uso de informações along with climate data and satellite
climatológicas e parâmetros images [13]. The BRASIL-SR model is
determinados a partir de imagens de based on the IGMK model originally
satélite [13]. O modelo BRASIL-SR foi developed at the GKSS
desenvolvido com base no modelo Forschungszentrum and described by
IGMK de autoria de pesquisadores do Stuhlman et al. [14]. Figure 4 shows the
GKSS Forschungszentrum e descrito flowchart of procedures carried out to
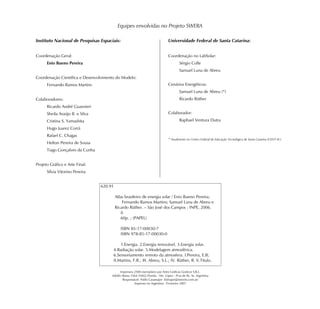
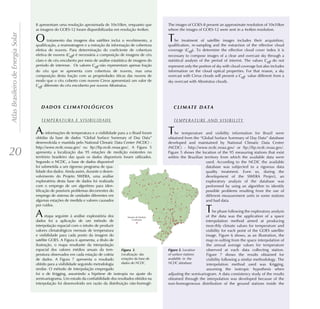
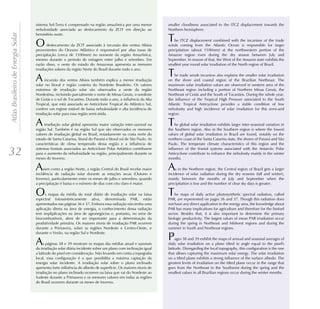
por Stuhlman et al. [14]. A Figura 4 obtain solar radiation estimates using
mostra o fluxograma dos procedi- the BRASIL-SR model. This procedure
. Fluxograma do . Flowchart of the is divided into three phases:
mentos executados para obtenção das modelo de transferência BRASIL-SR radiative transfer
estimativas de irradiação solar radiativa BRASIL-SR. model.
utilizando o modelo BRASIL-SR. A
obtenção da estimativa do fluxo de · assimilation of climate and satellite data;
radiação solar incidente na superfície é dividida em três etapas: · solution of the radiative transfer equation using the "Two-
· tratamento dos dados climatológicos e das imagens de satélite; Stream" approach [15];
· solução da equação de transferência radiativa utilizando a · calculation of each solar radiation components (global, direct
aproximação de “Dois-Fluxos” [15]; and diffused).](https://image.slidesharecdn.com/brazilsolaratlasr1-130313102328-phpapp02/85/Brazil-solar-atlas_r1-17-320.jpg)
![· cálculo de cada uma das componentes do fluxo de radiação
solar (global, direta e difusa). T he assimilation phase has the purpose of preparing the required
A
Atlas Brasileiro de Energia Solar
input data to feed the model. The required database comprises 6
primeira etapa tem como objetivo preparar os dados de entrada variables: air temperature, surface albedo, relative humidity,
necessários para alimentar o modelo. A base de dados necessária para atmospheric visibility, effective cloud coverage and surface elevation.
tal é constituída de 6 variáveis: temperatura do ar, albedo de superfície, The description of the characteristics and properties of the database
umidade relativa, visibilidade atmosférica, cobertura efetiva de nuvens used to feed the model will be described in detail in the next topic.
e elevação da superfície. A descrição das características e propriedades
da base de dados utilizada para alimentar o modelo será descrita em
detalhes no próximo tópico.
I n both of the following phases the model assumes three basic
premises:
N as duas etapas seguintes, o modelo assume três hipóteses básicas:
· the cloud coverage is the main modulating factor of
atmospheric transmittance so that the BRASIL-SR model uses
· a cobertura de nuvens é o principal fator de modulação da climatologic values from the atmospheric variables to estimate
transmitância atmosférica de modo que o modelo BRASIL-SR the optical properties of the atmosphere;
utiliza valores climatológicos das variáveis atmosféricas para
· the solar radiation flux at the top of the atmosphere is linearly
estimar as demais propriedades óticas da atmosfera;
distributed between the two extreme atmospheric conditions:
· o fluxo de radiação solar no topo da atmosfera está clear and overcast skies [11];
linearmente distribuído entre as duas condições atmosféricas
· the model assumes a linear relationship between the global
extremas: céu claro e céu completamente encoberto [11];
solar radiation flux at the surface and the radiation flux
· o modelo assume, também, a existência de uma relação linear reflected at the top of the atmosphere.
entre o fluxo de radiação solar global na superfície e o fluxo
de radiação refletida no topo da atmosfera. In that way, the flux of global solar radiation at the surface, g, may be
D essa forma, o fluxo de radiação solar global incidente na superfície,
, pode ser obtido a partir de:
obtained from:
16 g
Fg = F0 {(tclear - tcloud)(1 - Ceff) + tcloud}
Fg = F0 {(tclear - tcloud)(1 - Ceff) + tcloud}
where 0 is the radiation flux at the top of the atmosphere, tclear and
onde 0 é a radiação incidente no topo da atmosfera, tclear e tcloud tcloud are respectively the atmospheric transmittance for clear and
são as transmitâncias atmosféricas em condições de céu claro e overcast sky conditions and Ceff is the effective cloud cover index
completamente nublado, respectivamente, e Ceff é a cobertura efetiva given by the satellite images:
de nuvens dada pelas imagens de satélite:
L - Lclear
L - Lclear Ceff =
Lcloud - Lclear
Ceff =
Lcloud - Lclear
T he instantaneous readout obtained for a satellite image pixel is
A leitura instantânea obtida para um pixel da imagem do satélite está
representada por L e os índices “clear” e “cloud” referem-se à leitura em
represented by L and indices “clear” and “cloud” refer, respectively, to
readings in clear and overcast skies.
condições de céu claro e de céu encoberto por nuvens, respectivamente.
I n that way, the incidence of global solar radiation at the surface may
D essa forma, a determinação do fluxo de radiação solar global
incidente na superfície pode ser estimada a partir de duas componentes
be estimated from two independent components: the first component
corresponds to clear sky condition, tclear, and the second to a
independentes: a primeira componente corresponde à condição de completely overcast, tcloud . The random nature of solar radiation for
céu claro, tclear, e a segunda refere-se à condição de céu totalmente any sky condition is evaluated through the effective cloud cover index,
encoberto, tcloud . A natureza estocástica do fluxo de radiação solar em Ceff . The tclear component is a function of the surface albedo, the solar
qualquer condição de nebulosidade é avaliada através do coeficiente zenithal angle and the optical thickness of the atmosphere. The tcloud
de cobertura efetiva de nuvens, Ceff . A componente tclear é função do component is a function of the solar zenithal angle, the optical thickness
albedo de superfície, do ângulo zenital solar e da espessura ótica dos and optical cloud properties. The two components may be estimated
constituintes atmosféricos. A componente tcloud é função do ângulo from the parameterization of the well-known physical processes by
using climate data. To determine the transmittances tclear and tcloud,
zenital solar, da espessura ótica e de propriedades óticas das nuvens. As](https://image.slidesharecdn.com/brazilsolaratlasr1-130313102328-phpapp02/85/Brazil-solar-atlas_r1-18-320.jpg)
![duas componentes podem ser estimadas a partir de parametrização dos the model uses 135 spectral intervals in the shortwave spectra (0 – 4µm)
processos físicos bem conhecidos que ocorrem na atmosfera utilizando and adopts 30 atmospheric layers to solve the radiative transfer equation.
Atlas Brasileiro de Energia Solar
dados climatológicos. Para determinação das transmitâncias tclear e
tcloud, o modelo utiliza 135 intervalos espectrais na faixa de radiação T his scheme of linearization of the atmosphere transmittance through
the effective cloud cover index Ceff presents the great advantage of
de ondas curtas (0 – 4µm) e adota 30 camadas atmosféricas na solução
da equação de transferência radiativa. eliminating the effects of natural degradation of the satellite radiometer
response which, in some way, could carry on erroneous conclusions
E sse processo de linearização da radiação solar através da medida da
cobertura efetiva de nuvens Ceff apresenta a grande vantagem de
from analysis and comparisons of results from one year to the next or
from one satellite to another.
eliminar os efeitos da degradação natural que sempre ocorre nos
radiômetros dos satélites que, de outra forma, poderiam levar a T he diffuse solar radiation is determined by subtracting the direct
component from the global solar radiation at the horizontal surface. The
informações errôneas na análise e comparação de resultados de um ano
para outro ou de um satélite para outro. horizontal direct irradiation (DNI) is estimated assuming that the
absorption by clouds is not significant and that the contribution of
A irradiação solar difusa é determinada a partir da subtração da
componente direta horizontal do total de irradiação solar incidente na
scattering of the solar radiation by clouds may be added to the
atmospheric transmittance in clear sky conditions. Thus, the direct
component of solar irradiation is estimated using the expression below:
superfície. A irradiação direta horizontal (DNI) é estimada assumindo
que a absorção da radiação solar pelas nuvens não é significativa e que
a contribuição do espalhamento da radiação solar causado pelas nuvens
DNI = F0 . tatm-dir . tcloud-dir
pode ser adicionada à transmitância atmosférica em condições de céu
claro. Dessa forma, a componente direta da irradiação solar é estimada
com o uso da expressão abaixo: where tcloud-dir represents the cloud transmittance and tatm-dir is the
clear sky transmittance for the direct solar irradiation component.
Transmittance tcloud-dir is estimated from the effective cloud cover
DNI = F0 . tatm-dir . tcloud-dir
index using the following approximation [14]:
onde tcloud-dir representa a transmitância das nuvens e tatm-dir é a
(1 - tc) 17
tcloud-dir =
transmitância de céu claro para a componente direta da irradiação (b - tc)
solar. A transmitância tcloud-dir é estimada a partir do coeficiente de
cobertura efetiva de nuvens utilizando a seguinte aproximação [14]:
(1 - tc)
tcloud-dir = ..................
where
{ tc = (CCI + 0,05) if CCI < 0,95
tc = 1,0 if CCI
(b - tc)
T he transmittance tatm-dir refers to radiative processes involving
aerosols and atmospheric gases in a clear sky condition. This
onde
{ tc = (CCI + 0,05) if CCI < 0,95
tc = 1,0 if CCI
transmittance is estimated through the solution of the radiative transfer
equation using the "Two-Stream" approach.
A transmitância tatm-dir refere-se aos processos radiativos
T he thickness of each atmospheric layer and the atmospheric profiles
of temperature and atmospheric gas concentrations (CO2, O3, etc.) are
envolvendo aerossóis e gases atmosféricos em condição de céu claro. established for the standard atmosphere selected as a function of the air
Essa transmitância é estimada por meio da resolução da equação de temperature at the surface (input data). The scheme to model the water
transferência radiativa utilizando a aproximação de “Dois-Fluxos”. vapor adopts the parameterization of precipitable water described by
Leckner [16]. The model employs the continental profile of atmospheric
A espessura de cada camada atmosférica e os perfis atmosféricos de
temperatura e da concentração dos gases atmosféricos (CO2, O3, etc.)
aerosols, described by McClatchey [17] for altitudes from 0 to 50 km,
corrected for the first 5 km through climatologic visibility values.
são estabelecidos para a atmosfera-padrão selecionada em função da
temperatura do ar na superfície (dado de entrada). Para a modelagem
do vapor d’água, o modelo adota a parametrização de água precipitável
W ith regards to cloud modeling, the BRASIL-SR model assumes
that: (a) the cloud microphysics is represented by the droplets size
descrita por Leckner [16]. O modelo utiliza o perfil continental de distribution of the cloud type; (b) the clouds totally attenuate the direct
aerossóis atmosféricos, descrito por McClatchey [17] para altitudes de 0 radiation coming from the sun and (c) the clouds are vertically and](https://image.slidesharecdn.com/brazilsolaratlasr1-130313102328-phpapp02/85/Brazil-solar-atlas_r1-19-320.jpg)
![a 50 km, corrigido nos primeiros 5 km de altitude com base em valores horizontally homogenous. For the solar irradiation mapping, it was
climatológicos de visibilidade. assumed that the entire cloud coverage is formed by a single type of
Atlas Brasileiro de Energia Solar
cloud - Altostratus - with their base at 500 mb and uniformly distributed
C om relação à modelagem das nuvens, o modelo BRASIL-SR assume
que: (a) a microfísica de nuvens é representada pela distribuição de
in 2 atmospheric layers. Previous studies showed that Altostratus clouds
are the most common cloud type in continental areas in the latitude
tamanhos de gotículas do tipo de nuvem presente; (b) as nuvens range where Brazil is located [18]. The model uses the Stephens [19]
atenuam totalmente a radiação direta proveniente do Sol e (c) as nuvens parameterization to determine the total extinction coefficient and the
são vertical e horizontalmente homogêneas. Para o mapeamento total liquid water content of the cloud. The optical cloud thickness in
apresentado neste Atlas, foi adotado que toda a cobertura de nuvens é each layer of the atmosphere where they are present is determined by
formada por um único tipo de nuvens – Altostratus – com a base das assuming that the total amount of water in the cloud is isotropically
nuvens em 500 mb e uniformemente distribuída em 2 camadas distributed.
atmosféricas. Estudos anteriores mostraram que as nuvens Altostratus
são o tipo de nuvem espessa mais freqüente nas áreas continentais
situadas no intervalo de latitudes em que o Brasil se localiza [18]. O
modelo utiliza a parametrização de Stephens [19] para determinar o
coeficiente de extinção total e o conteúdo total de água líquida na
nuvem. A espessura ótica das nuvens em cada uma das camadas
atmosféricas em que estão presentes é determinada assumindo que o
conteúdo total de água presente na nuvem está isotropicamente
distribuído.
18](https://image.slidesharecdn.com/brazilsolaratlasr1-130313102328-phpapp02/85/Brazil-solar-atlas_r1-20-320.jpg)
![nea das estações Bra-zilian
de superfície no territory. It
Atlas Brasileiro de Energia Solar
território brasilei- showed good
ro e mostrou boa agreement with
concordância the measured
com os valores values even for
medidos mesmo regions with a
na região com lower density of
menor densidade stations.
de estações.
. Mapa da . Map for . Mapa da . Map for
média anual de annual mean of média anual de annual mean of visibility
temperatura obtido por temperature obtained by visibilidade obtido por obtained by Krigging
interpolação Krigging. Krigging interpolation. interpolação Krigging. interpolation.
ALBEDO DE SUPERFÍCIE
SURFACE ALBEDO
O albedo de superfície é função da
T
21
refletância da camada de cobertura do solo e de he surface albedo is a function of the
seu uso. Essa refletância varia no transcorrer do reflectance of the soil cover layer and its land
ano dependendo do estágio de crescimento da use. This reflectance varies during the year
vegetação, estação do ano e variações inter- depending on the vegetation growth stage, the
anuais do clima. season and inter-annual climate variations.
A base de dados de albedo utilizada neste T he albedo database used in the development
of this Atlas was obtained through the model
trabalho foi obtida através do modelo
desenvolvido por Sellers et al. [20] que calcula o developed by Sellers et al. [20] which calculates
albedo de superfície em vários intervalos the surface albedo for various spectral intervals.
espectrais. Esse modelo é alimentado por This model is fed by measurements obtained by
medidas do “Índice de Vegetação por Diferença satellite of the "Normalized Difference
Normalizada” (IVDN) obtidas por satélite e Vegetation Index” (NDVI) and other biophysical
outros parâmetros biofísicos relacionados ao parameters related to the type of vegetation [21].
tipo de vegetação [21]. Assim, os dados obtidos The data obtained for the surface albedo
para o albedo de superfície representam valores represent average monthly values during the day
médios mensais durante o ciclo diurno. Essa cycle. This database is available in
base de dados está disponível em . Mapa da . Map for ftp://daac.gsfc.nasa.gov/ and it is supplied in
ftp://daac.gsfc.nasa.gov/ e é fornecida na forma média anual de annual mean of form of a regular grid with a 1º x 1º resolution.
albedo de superfície surface albedo Figure 8 shows, as an illustration, the map of the
de uma grade regular com resolução 1° x 1°.
obtido por obtained using the annual average of albedo produced at the same
A Figura 8 apresenta, a título de ilustração, o interpolação de “nearest neighbor”
mapa da média anual de albedo produzido na spatial resolution of the GOES-12 satellite
vizinho mais interpolation
mesma resolução espacial das imagens do images using the “nearest neighbor”
próximo. technique.
satélite GOES-12 utilizando o método do interpolation method.
vizinho mais próximo para a interpolação.](https://image.slidesharecdn.com/brazilsolaratlasr1-130313102328-phpapp02/85/Brazil-solar-atlas_r1-23-320.jpg)
![. Estações da rede SONDA utilizadas na etapa de validação do . The SONDA sites used to validate solar estimates provided by
modelo de transferência radiativa BRASIL-SR. the BRASIL-SR radiative transfer model.
Atlas Brasileiro de Energia Solar
Petrolina (PE) 09°04'S / 40°19W 2005 Localizada na região Nordeste
Implantada pelo Projeto SWERA e incorporada ao Projeto SONDA em 2005
Caicó (RN) 01°55'S / 37°05'W 2004/2005
Localizada na região Nordeste
Ouro Preto d'Oeste (RO) 10°52'S / 61°58'W 2005 Localizada na região Norte
Cuiabá (MT) 15°33'S / 56°04'W 2004/2005 Localizada na região Centro-Oeste
Brasília (DF) 15°36'S / 47°42'W 2005 Localizada na região Nordeste
Campo Grande (MS) 20°26'S / 54°32'W 2004/2005 Localizada na região Centro-Oeste
Incluída na rede BSRN desde 2000 e incorporada ao Projeto SONDA em 2005
Florianópolis (SC) 27°36'S / 48°30'W 2000/2005
Localizada na região Sul
São Martinho da Serra (RS) 29°26'S / 53°49'W 2004/2005 Localizada na região Sul
REDE SONDA SONDA NETWORK
A Tabela 1 apresenta uma descrição das estações da rede SONDA
utilizadas na etapa de validação das estimativas fornecidas pelo modelo
T able 1 shows a description of the SONDA network stations used in
the validation step of the solar irradiation estimates provided by the
BRASIL-SR. O critério para a seleção das estações SONDA foi a BRASIL-SR model. The criteria used for selecting the SONDA stations
extensão da série de dados disponíveis. A rede SONDA teve início com was the time extension of the data series available. The SONDA
a implantação da estação localizada em São Martinho da Serra (RS) no network started with the imple-mentation of the measurement site
segundo semestre de 2004. located at São Martinho da Serra
Muitas estações foram
implantadas ou incorporadas à
(RS) during the second half of
2004. Many sites were set up or
23
rede desde então. incorporated into the network
after that.
A instrumentação e sensores
instalados nas estações SONDA T he instrumentation and
são equipamentos de primeira sensors installed at the SONDA
linha de reconhecida confia- stations are first class equipment
bilidade no meio científico. Os of certified reliability. The global
dados de irradiação solar global e and direct solar irradiation data
direta são coletados com are collected with Kipp&Zonen
sensores Kipp&Zonen CM21 e CM21 and Eppley NIP sensors,
Eppley NIP, respectivamente. Os respectively. The data collected at
dados coletados nas estações da the SONDA network stations are
rede SONDA são submetidos à subjected to a rigid quality control
um rígido controle de qualidade to allow that uses criteria
que utiliza critérios estabelecidos established by World Meteo-
pela World Meteorological rological Organization (WMO) for
Organization (WMO) para as stations of the Baseline Solar
estações da rede Baseline Solar Radiation Network (BSRN)
Radiation Network (BSRN) [22]. A network [22]. Figure 11 exhibits
. (a) Módulo de . (a) Container of the
Figura 11 apresenta fotos das photos of stations located in
medidas da estação SONDA em SONDA site in Brasilia with the
instalações das estações em Brasília com os sensores de radiation sensors installed above the Brasilia (DF) and São Martinho
Brasília (DF) e São Martinho da radiação instalados sobre o teto; ceiling; (b) Platform with the da Serra (RS).
Serra (RS). (b) Plataforma com os sensores radiation measurement sensors
de radiação na estação SONDA installed a the SONDA site in São
em São Martinho da Serra; e (c) Martinho da Serra; and (c) Automatic
Plataforma de coleta de dados weather station (AWS) in Paraná.](https://image.slidesharecdn.com/brazilsolaratlasr1-130313102328-phpapp02/85/Brazil-solar-atlas_r1-25-320.jpg)
![REDE DE PLATAFORMAS DE COLETA DE DADOS NETWORK OF AUTOMATIC WEATHER STATIONS
(PCD) (AWS)
Atlas Brasileiro de Energia Solar
A base de dados da rede SONDA, embora de alta qualidade e
confiabilidade, ainda é bastante reduzida temporal e espacialmente. A
A lthough the high quality and reliability of the SONDA database,
it is very limited in time and space. The data series starts on the
série de dados tem início no segundo semestre de 2004, com exceção second semester of 2004 with exception of the Florianópolis station
da estação de Florianópolis que já operava sob a coordenação do which already operated under the coordination of the Solar Energy
Laboratório de Energia Solar da Universidade Federal de Santa Catarina Laboratory of the Federal University of Santa Catarina before its
antes de sua incorporação à rede SONDA. Além disso, a estação de incorporation into the SONDA network. In addition, the
referência prevista para a região Sudeste, em Cachoeira Paulista, ainda measurement site planned for the Southeastern region, in Cachoeira
não se encontra em operação. Paulista, is still not operational.
A rede de PCD operada pelo CPTEC/INPE, com estações distribuídas
por todo o território brasileiro, foi utilizada no processo de validação
D ata provided by AWS network, with sites spread throughout the
Brazilian territory, were employed in the validation process in order
com o intuito de expandir sua abrangência temporal e espacial da base to cover a larger area and time period of the surface database
de dados de superfície e permitir uma avaliação mais completa da allowing for a more complete evaluation of the model's reliability.
confiabilidade do modelo. A Tabela 2 apresenta a distribuição das Table 2 shows the station distribution in each Brazilian regions and
estações em cada uma das regiões geográficas do território brasileiro e the temporal extension of the data series available. In spite of not
a extensão temporal da série de dados disponíveis. Apesar de não owning first grade sensors, former studies demonstrated that LI-COR
contar com sensores de primeira linha, estudos anteriores mostraram instruments and first grade sensors (Kipp&Zonen and Eppley) present
que instrumentos LI-COR e sensores de primeira linha (Kipp&Zonen e similar performance whenever the station's operation and
Eppley) apresentam performance similar quando procedimentos de maintenance are adequately performed [23]. Figure 11(c) shows an
operação e manutenção das estações são realizados adequadamente AWS operating in Paraná.
[23]. A Figura 11(c) mostra uma PCD operando no Paraná.
24 . Número de PCD
utilizadas para validação do
modelo BRASIL-SR.
. The AWS sites used
to validate solar data
provided by the BRASIL-SR.
Norte 11 2002 a 2005
Nordeste 13 2003 a 2005
Centro-Oeste 25 2002 a 2005
Sudeste 38 2002 a 2005
Sul 11 2004 a 2005](https://image.slidesharecdn.com/brazilsolaratlasr1-130313102328-phpapp02/85/Brazil-solar-atlas_r1-26-320.jpg)
![Atlas Brasileiro de Energia Solar
NÍVEIS DE CONFIABILIDADE DAS RELIABILITY LEVELS OF SOLAR
ESTIMATIVAS DE IRRADIAÇÃO IRRADIATION ESTIMATES
SOLAR
O levantamento dos níveis de confiabilidade do modelo BRASIL-SR
foi realizado pela avaliação dos desvios apresentados pelos valores
T he assessment of reliability levels of the BRASIL-SR model were
performed through the evaluation of the deviations shown by the
estimados para o fluxo de radiação solar em relação aos valores estimated values for solar radiation flux vis-à-vis the values measured at
medidos na superfície (verdade terrestre). Esse levantamento foi the surface (ground truth). This evaluation was done in two phases. The
realizado em duas etapas. Na primeira etapa foi realizada uma first phase consisted in an inter-comparison between the core radiation
intercomparação entre os modelos de transferência radiativa adotados transfer models adopted by the SWERA Project to map the solar energy
pelo Projeto SWERA para o mapeamento do potencial solar nos vários in the various countries participating in the project. The HELIOSAT
países participantes do projeto com a adição do modelo HELIOSAT model took part in this phase like benchmark due to its employment to
como “benchmark”, por ser um modelo conhecido e amplamente map solar energy resources in countries from European Union. In the
empregado na Comunidade Européia. Na segunda etapa as estimativas second phase, the solar flux estimates provided by the BRASIL-SR
fornecidas pelo modelo BRASIL-SR foram comparadas com valores model were compared with measured values acquired at several
medidos em superfície em diversas estações solarimétricas distribuídas solarimetric stations spread along the Brazilian territory.
por todo território nacional.
25
A intercomparação incluiu o modelo BRASIL-SR e os seguintes
modelos de transferência radiativa:
T he inter-comparison step included the BRASIL-SR model and the
following radiation transfer models:
· HELIOSAT - utilizado no mapeamento dos recursos solares na · HELIOSAT - used for mapping solar resources in Europe [24] ;
Europa [24] ; · SUNNY/ALBANY - developed by the State University of New
· SUNNY/ALBANY - desenvolvido pela State University of New York [25, 26, 27];
York [25, 26, 27]; · DLR - developed by the Deutsches Zentrum für Luft- und
· DLR - desenvolvido no Deutsches Zentrum für Luft- und Raumfahrt [28].
A
Raumfahrt [28].
metodologia para realização da intercomparação empregou dados
T he methodology to perform the inter-comparison employed data
from daily totals collected at Florianópolis (SC), Balbina (AM), and Caicó
de total diário coletados nas estações de Florianópolis (SC), Balbina (RN). These stations were selected because of the data quality and the
(AM) e Caicó (RN). Estas estações foram escolhidas em razão da distinct climate conditions where they are located. The surface data
qualidade dos dados fornecidos e climatologia do local onde estão used for the inter-comparison were collected from November 2002 to
situadas. Os dados de superfície utilizados na intercomparação foram March 2003. During this period the ground data from Project SONDA
coletados no período de novembro/2002 a março/2003. Nesse período were not yet available.
os dados do Projeto SONDA ainda não estavam disponíveis.
A estação localizada em Caicó foi instalada no segundo semestre de
T he station located in Caicó was installed during the second semester
of 2002 in order to provide ground data for this task of the SWERA
2002 especificamente para atender a essa etapa do Projeto SWERA. A Project. The Caicó location was selected due to the preponderance of](https://image.slidesharecdn.com/brazilsolaratlasr1-130313102328-phpapp02/85/Brazil-solar-atlas_r1-27-320.jpg)
![localização de Caicó foi definida em função da preponderância de dias clear sky days throughout the year [29], which is ideal for comparing the
com baixa nebulosidade durante o ano [29], ideal para a comparação do model behavior with regards to the parameterization of typical radiative
Atlas Brasileiro de Energia Solar
comportamento dos modelos em relação à parametrização dos processes for clear sky conditions. The Balbina site is located close to
processos radiativos típicos de condições de céu claro. A estação de the hydroelectric power plant of the same name in the Amazon region.
Balbina está localizada próximo à usina hidroelétrica de mesmo nome The climatology of the region is strongly influenced by the Inter-tropical
na região amazônica. A climatologia da região é fortemente Convergence Zone (ITCZ), with a high precipitation and a few clear sky
influenciada pela “Zona de Convergência Intertropical” (ZCIT), sendo days throughout the year. The Florianópolis site already reached the
que a precipitação pluviométrica é elevada e a quantidade de dias de established requirements by the BSRN (Baseline Solar Radiation
céu claro é pequena ao longo do ano. A estação de Florianópolis já Network) network for collection and qualification of ground data. The
atendia aos padrões estabelecidos para a rede BSRN (Baseline Solar climatology of Florianópolis exhibits days with clear sky and overcast
Radiation Network) para coleta e qualificação dos dados coletados. A well distributed all over the year.
climatologia de Florianópolis apresenta dias de céu claro e encoberto
bem distribuídos ao longo do ano. A t the three stations Kipp&Zonen CM21 pyranometers and NIP
N as três estações foram utilizados piranômetros Kipp&Zonen CM21
e pirheliômetros NIP da Eppley para a medida de irradiação global e da
pirheliometers from Eppley were used respectively to measure the
global irradiation and the direct normal component of the solar
radiation flux. The results of the inter-comparison showed a similar
componente direta normal do fluxo de radiação solar, respectivamente. performance of all models for all three locations. The BRASIL-SR model
Os resultados da intercomparação mostraram um desempenho showed mean bias and root mean square deviations for the daily total
semelhante de todos os modelos para as três localidades. O modelo solar radiation flux statistically comparable to those exhibited by the
BRASIL-SR apresentou desvios médios e quadráticos para o total diário other core models involved in the inter-comparison, including the
de fluxo de radiação solar comparáveis estatisticamente aos HELIOSAT model which used METEOSAT images with much better
apresentados pelos demais modelos envolvidos na intercomparação, temporal resolution (hourly), while the GOES-8 images available for the
inclusive o modelo HELIOSAT que utilizou imagens do METEOSAT BRASIL-SR model exhibited a temporal resolution of 3 hours [30, 31].
com resolução temporal horária, enquanto as imagens do GOES-8
disponíveis para o modelo BRASIL-SR apresentavam uma resolução
temporal de 3 horas [30, 31].
26
T he second phase of the reliability evaluation was done by the
A segunda etapa de avaliação dos níveis de confiabilidade do modelo
BRASIL-SR foi feita pela validação das estimativas do modelo com base
validation of the model's estimates based on solar irradiation data
collected at ground sites dispersed throughout the Brazilian territory.
nos dados de irradiação solar coletados em estações de superfície Here are shown the validation results of the estimates for global and
distribuídas pelo território brasileiro. Aqui estão apresentados os direct solar irradiation for the 5 geographical Brazilian regions.
resultados da validação para cada uma das cinco regiões geográficas
brasileiras.
VALIDAÇÃO DA IRRADIAÇÃO GLOBAL VALIDATION OF GLOBAL RADIATION
F oram utilizados dados coletados em oito estações da rede SONDA,
apresentadas na Tabela 1, e em 98 estações da rede de PCD
D ata collected at eight stations of the SONDA network (Table 1) and
at 98 sites of the AWS network distributed within the Brazilian territory
distribuídas no território brasileiro, conforme descrito na Tabela 2. Os as described in Table 2 were used in validation step. The results are
resultados estão apresentados por região geográfica do Brasil. exhibited for each geographic region of Brazil.
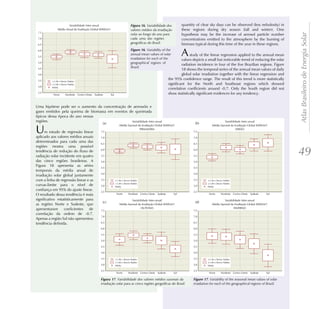
O s gráficos de dispersão, apresentados na Figura 12 para cada uma
das regiões brasileiras, permitem a comparação entre as estimativas
T he plots shown on Figure 12 for each Brazilian geographical region
allow a comparison between the BRASIL-SR estimates and the ground
fornecidas pelo modelo com valores medidos em superfície. A Tabela data values. Table 3 shows a summary of the results obtained for each
3 apresenta um resumo dos resultados obtidos para cada uma das of the Brazilian regions.
regiões brasileiras.](https://image.slidesharecdn.com/brazilsolaratlasr1-130313102328-phpapp02/85/Brazil-solar-atlas_r1-28-320.jpg)
![equipamento apresentou problemas inviabilizando sua utilização .
T able 4 shows the deviations observed in each of the three validation
A
Atlas Brasileiro de Energia Solar
Tabela 4 apresenta os valores dos desvios observados em cada uma sites. The mean bias error presented similar magnitude as other models
das três estações de medida. O desvio médio apresentado é da mesma in use by the scientific community [32]. The greater deviations were
ordem de grandeza dos desvios apresentados por outros modelos em observed for Florianópolis and it would be related to its location in a
uso pela comunidade científica [32]. A estação de Florianópolis coastal urban area. Figure 14 shows the scatter plot between measured
apresentou os maiores desvios e supõe-se que isso se deva ao fato de and estimated values for direct normal irradiation and the histogram of
estar localizada em área urbana. A Figura 14 apresenta o gráfico de observed deviations.
dispersão entre valores medidos e estimados da irradiação direta
normal e o histograma dos desvios observados.
. Gráfico de dispersão entre valores medidos e
estimados da irradiação direta e o histograma dos desvios
. Scatter plot between measured and estimated
values for direct irradiation and the histogram of observed 29
observados. Os pontos representam os dados das 3 estações deviations. The points represent data from the 3 SONDA
SONDA apresentadas na Tabela 4. stations presented in Table 4.](https://image.slidesharecdn.com/brazilsolaratlasr1-130313102328-phpapp02/85/Brazil-solar-atlas_r1-31-320.jpg)

![Atlas Brasileiro de Energia Solar
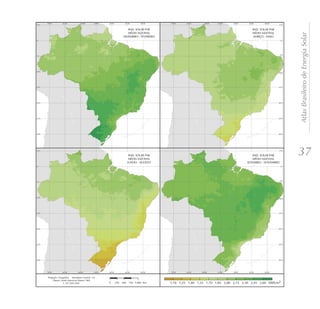
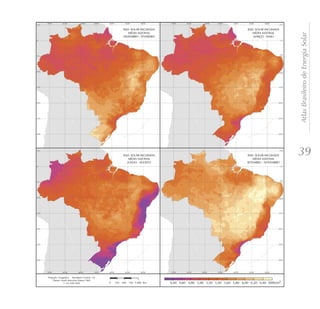
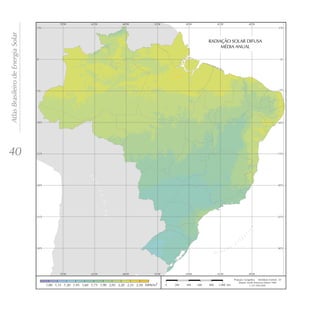
MAPAS SOLARIMÉTRICOS SOLARIMETRIC MAPS
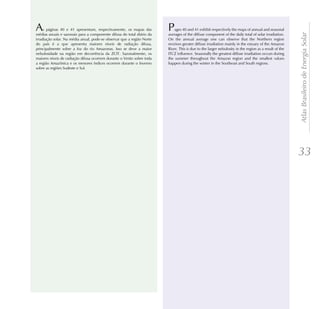
T odos os mapas a seguir apresentam os valores médios das
estimativas do total diário de irradiação solar fornecidas pelo modelo de
A ll the following maps exhibit the average values of estimates for the
daily total of solar irradiation provided by the BRASIL-SR radiative
transferência radiativa BRASIL-SR para o período de julho de 1995 a transfer model for the period between July 1995 and December 2005
dezembro de 2005 - uma década completa de dados. Os mapas estão – a full decade of data. The spatial resolution is 10km x 10km for all the
na resolução espacial de 10km x 10km. maps.
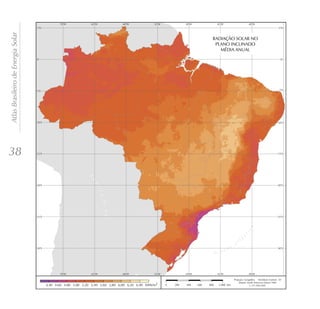
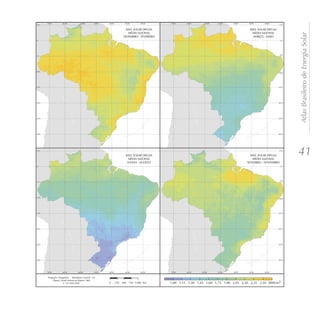
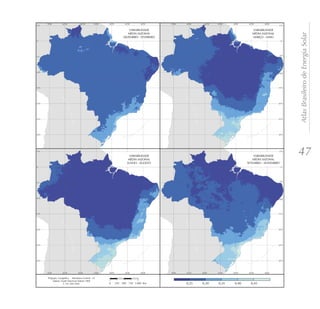
O mapa apresentado na página 34 mostra a média anual do total
diário de irradiação solar global incidente no território brasileiro. Apesar
T he map shown in the page 34 exhibits the annual average of daily
total of global solar irradiation that reaches the Brazilian territory. In
das diferentes características climáticas observadas no Brasil, pode-se spite of the different climate characteristics along the Brazilian territory,
observar que a média anual de irradiação global apresenta boa one can observe that the global irradiation is fairly uniform. The
uniformidade, com médias anuais relativamente altas em todo país. O maximum solar irradiation value - 6,5kWh/m2 - occurs in the northern
valor máximo de irradiação global – 6,5kWh/m2 - ocorre no norte do part of Bahia state close to the border with the Piauí state. This area
estado da Bahia, próximo à fronteira com o estado do Piauí. Essa área exhibits a semi-arid climate with low rainfall throughout the year
apresenta um clima semi-árido com baixa precipitação ao longo do ano (approximately 300mm/year) and the lowest annual mean cloud
amount [29]. The lowest global solar irradiation – 4,25kWh/m2 – occurs
(aproximadamente 300mm/ano) e a média anual de cobertura de
nuvens mais baixa do Brasil [29]. A menor irradiação solar global –
4,25kWh/m2 – ocorre no litoral norte de Santa Catarina, caracterizado
on the North shore of Santa Catarina where precipitation is well-
distributed throughout the year. The annual mean of daily horizontal
31
pela ocorrência de precipitação bem distribuída ao longo do ano. Os global solar irradiation in any region of the Brazil (1500-2500 kWh/m2)
valores de irradiação solar global incidente em qualquer região do are much greater than those for the majority of the European countries
território brasileiro (1500-2500 kWh/m2) são superiores aos da maioria such as Germany (900-1250 kWh/m2), France (900-1650kWh/m2) and
dos países da União Européia, como Alemanha (900-1250 kWh/m2), Spain (1200-1850 kWh/m2) where projects to harness solar resources
França (900-1650kWh/m2) e Espanha (1200-1850 kWh/m2), onde are greatly disseminated some of which with great government
projetos para aproveitamento de recursos solares, alguns contando com incentives [33].
fortes incentivos governamentais, são amplamente disseminados [33].
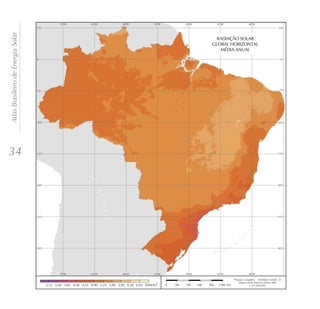
A página 35 apresenta os mapas de médias sazonais da irradiação
P age 35 shows the maps for seasonal averages of daily global
irradiation. The months of the year were arranged in 4 seasons so that
global diária. Os meses do ano foram classificados em 4 estações de the period from December to February applies to summer, March to
modo que o período de dezembro a fevereiro refere-se ao Verão, de May to fall, June to August to winter and September to November to
março a maio ao Outono, de junho a agosto ao Inverno e de setembro spring.
a novembro refere-se à Primavera.
A região Norte recebe menor incidência de radiação solar durante o
T he North region receives lower solar irradiation during the summer
than the South region in spite of its closer location to the Equator. The
Verão do que a região Sul, apesar de sua localização próxima à linha do opposite occurs during the winter months and the Amazon region
Equador. Durante os meses de Inverno, ocorre o inverso e a região receives larger daily global solar irradiation. This is due to climate
amazônica recebe maior irradiação solar global. Isso se deve às characteristics of the Amazon region which features a larger cloud
características climáticas da região amazônica que apresenta fração de coverage and rainfall during the summer as a consequence of strong
cobertura de nuvens e precipitação elevadas durante o Verão devido à influence of the Inter-tropical Convergence Zone (ITCZ). The variation
forte influência da Zona de Convergência Intertropical (ZCIT). A of the solar irradiation between winter and summer is smaller in the
variação da incidência de radiação solar entre o Inverno e Verão é North region than in the South and Southeast. The inherent decrease
menor na região Norte do que nas regiões Sul e Sudeste. O decréscimo of solar irradiation at the top of the atmosphere in the winter due to
natural da incidência de radiação solar no topo da atmosfera que ocorre astronomic factors is counterbalanced in the Amazon region by a
no Inverno em decorrência de fatores astronômicos associados ao](https://image.slidesharecdn.com/brazilsolaratlasr1-130313102328-phpapp02/85/Brazil-solar-atlas_r1-33-320.jpg)

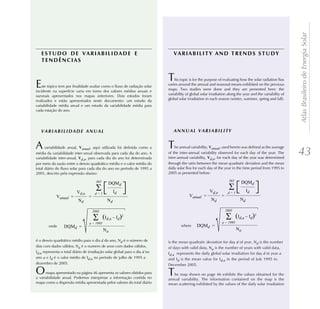
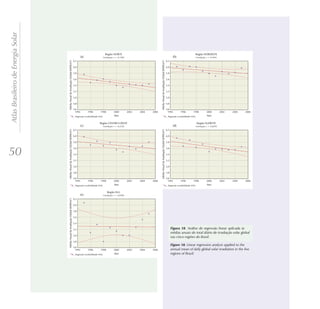
![em torno de sua média no período de 10,5 anos de dados considerados around its average within the whole period of 10.5 years of data of
nesse estudo. Em outras palavras, uma variabilidade anual igual a 0,45 this study. In other words, an annual variability equal to 0.45 stands
Atlas Brasileiro de Energia Solar
significa que o total diário de irradiação solar global apresentou uma for a spreading of daily values of global solar irradiation up to 45%
dispersão média de 45% em torno do valor médio apresentado na around its mean value presented in page 34.
página 34.
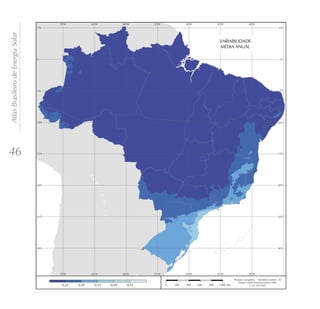
A nalisando o mapa de variabilidade anual, pode-se notar que toda a
A nalyzing the annual variability map one may notice that the
entire Amazon region and the western portion of the Northeast and
região amazônica e a parte setentrional das regiões Nordeste e Centro- Midwest regions including the North of the São Paulo state and the
Oeste, incluindo o norte do estado de São Paulo e o oeste de Minas West of Minas Gerais show modest variability throughout the year -
Gerais, apresentam menor variabilidade ao longo do ano – menor de less than 25%. These regions show distinctive climate characteristics
25%. Essas regiões apresentam diferentes características climáticas que that reduces the solar flux variability throughout the year as for
reduzem a variabilidade da irradiação solar incidente na superfície ao example the low nebulosity during the entire year in the semi-arid
longo do ano como por exemplo a baixa nebulosidade durante todo o region and the high nebulosity during the summer in the Amazon
ano na região semi-árida do Nordeste e a elevada nebulosidade durante region.
o Verão na região amazônica.
G rande parte da região Sul e o leste da região Sudeste apresentou
A great portion of the South region and the eastern area of the
Southeast showed annual variability between 30 and 35% caused
uma variabilidade anual entre 30 e 35% causada principalmente pela mainly by the penetration of polar air masses during the dry season
penetração das massas de ar polares durante a estação seca do ano of the year (May through October). The greatest variability values
(maio a outubro). Os maiores valores de variabilidade foram were observed in coastal region from Santa Catarina to São Paulo.
observados na região costeira desde Santa Catarina até São Paulo. Essa This region coincides with the area of largest mean nebulosity of
região coincide com a área de maior nebulosidade média anual do Brazil according to the climate data presented by INMET [29].
Brasil, conforme dados das normais climatológicos apresentados pelo
INMET [29].
44
A variabilidade sazonal, Vsazonal, foi definida como a média da
T he seasonal variability, Vsazonal, was defined as the mean intra-
seasonal variability observed for each year for the period from 1995 to
variabilidade intra-sazonal observada para cada ano do período de 2005. The intra-seasonal variability for specific year, Vsaza, was
1995 a 2005. A variabilidade intra-sazonal para um ano específico, determined through the ratio between the mean quadratic deviation
Vsaza, foi determinada por meio da razão entre o desvio quadrático and the mean value of the daily solar flux for the specific season:
médio e o valor médio do total diário do fluxo solar na estação do ano
em estudo, descrito pela expressão abaixo: 2005
Vsaza
2005
a = 1995
Vsaza Vsazonal =
Na
a = 1995
Vsazonal =
Na n2
n2
(Id,a – Isaz)2
d = n1
(Id,a – Isaz)2 Nd
d = n1
where Vsaza =
Nd Isaz
onde Vsaza =
Isaz
Nd is the number of days with valid data, Na is the number of years
with valid data, Id,a represents the daily global solar irradiation for day
Nd é o número de dias com dados válidos, Na é o numero de anos
d in year a and Isaz is the average value for global solar irradiation in
com dados válidos, Id,a representa o total diário de irradiação solar](https://image.slidesharecdn.com/brazilsolaratlasr1-130313102328-phpapp02/85/Brazil-solar-atlas_r1-46-320.jpg)
![Atlas Brasileiro de Energia Solar
CENÁRIOS DE APLICAÇÕES DA SOLAR ENERGY APPLICATION
ENERGIA SOLAR SCENARIOS
C om o intuito de demonstrar as aplicações potenciais e destacar as
possibilidades econômicas de exploração do recurso energético solar,
T his topic aims at demonstrating the potential application and
highlighting the economic possibilities for exploring the solar energy
são apresentados, a seguir, alguns cenários energéticos estabelecidos a resource. Some energy scenarios established from the socio-economic
partir da base de dados sócio-econômicos coletados durante a database collected during the SWERA project and the solar irradiation
execução do Projeto SWERA e das estimativas de irradiação solar estimates supplied by this Atlas were presented and discussed. The
fornecidas por este Atlas. Os cenários aqui apresentados são bastante scenarios presented are greatly simplified and have the sole purpose to
simplificados e tem como objetivo apenas ilustrar possíveis aplicações illustrate some possible applications for the data presented in this
dos dados apresentados nesta publicação. publication.
E stima-se que o aquecimento de água é responsável por 25% do total I t is being estimated that water heating is responsible for 25% of the
51
de energia elétrica consumida nas residências brasileiras o que total electric power consumed in the Brazilian households (electricity
representa um consumo da ordem de 20 bilhões de kWh. Tal demanda consumption around 20 billion kWh). Such demand for electric energy
de energia elétrica ocorre principalmente no fim da tarde ocasionando occurs primarily in the late afternoon causing a demand peak that could
um pico que poderia ser reduzido em grande parte com a exploração be greatly reduced with the exploration of solar energy with economic
da energia solar, trazendo ainda vantagens econômicas e ambientais. O and environmental advantages. The electric showerhead is the
chuveiro elétrico é o equipamento mais empregado para esta tarefa, equipment mostly used for water heating as it has a very low cost for
apresenta um custo reduzido para instalação (abaixo de US$15) e pode installation (below US$15) but may consume up to 6kWh
consumir uma potência de até 6kWh.
S egundo informações da Sociedade Brasileira de Refrigeração, Ar-
A ccording to information from the Brazilian Society for Refrigeration,
Air Conditioning, Ventilation and Heating [34], there are approximately
condicionado, Ventilação e Aquecimento [34], existem 250,000 solar heaters installed in Brazil which represents only 0.6% of
aproximadamente 250.000 aquecedores solares instalados no Brasil, o the total of Brazilian homes. Brazil still has a small number of solar
que representa apenas 0,6% do total de residências brasileiras. O Brasil systems installed when compared to countries like China, Israel, Turkey,
possui um número ainda pequeno de sistemas solares instalados para Greece, Germany, etc., and it is therefore a great market to be
aquecimento de água quando comparado com países como China, commercially explored.
Israel, Turquia, Grécia, Alemanha, etc., e é, portanto, um grande
mercado a ser explorado comercialmente. T he initial investment is the main barrier to adopt solar systems on a
O investimento inicial é a principal barreira para a adoção em larga
escala de sistemas solares para aquecimento de água no Brasil. Um
great scale to heat domestic water in Brazil. A compact system sized for
a low-income family represents a cost above US$450, about 30 times
more than the cost of an electric shower. However, the cost paid by the
sistema compacto dimensionado para famílias de baixa renda electric distribution company to meet the demand during the peak is
apresenta um custo superior a US$450, ou seja, cerca de 30 vezes substantially greater so the incentive policies towards a large scale
superior ao custo de um chuveiro elétrico. No entanto, o custo pago adoption of solar heating systems could be undertaken by the
pela empresa de distribuição de energia elétrica para atender a companies responsible for electric power distribution. Law No. 10.295
demanda de energia durante o pico causado pelo uso de chuveiros](https://image.slidesharecdn.com/brazilsolaratlasr1-130313102328-phpapp02/85/Brazil-solar-atlas_r1-53-320.jpg)
![elétricos é consideravelmente maior, de forma que políticas de establishes a Brazilian policy for the rationalization and conservation of
incentivo para adoção em larga escala de sistemas solares de energy and intends to encourage the adoption of solar heating.
Atlas Brasileiro de Energia Solar
aquecimento poderiam ser praticadas pelas empresas responsáveis pela
distribuição de eletricidade. A lei no. 10.295 estabelece uma política
nacional para a racionalização e conservação da energia que visa
T he methodology employed for the development of the solar water
heating scenario have used the "F-Chart" [35] analysis considering the
incentivar a adoção de aquecimento solar. adoption of a compact low cost system designed to replace the electric
A metodologia empregada para o desenvolvimento do cenário
apresentado a seguir utilizou a análise “F-Chart” [35] considerando a
shower in households of low income family. The solar fraction F is
defined as the ratio between the electric power saving and the total
energy required to heat the water without the use of solar heat. The
adoção de um system adopted
sistema for the scenario
. Resultados apresentados para o cenário de . Results shown for the solar water heating
compacto de adoção de um sistema solar de baixo custo para scenario that adopts a low cost system for low-income shows a net area
baixo custo aquecimento de água em residências da população de households. FxL is the energy saving achieved with the of 1.6m2 with a
voltado para baixa renda. FxL é a economia de energia conseguida adoption of a solar heating system. volume of 120
substituição do com a adoção do sistema. liters and a total
chuveiro elétrico cost of US$500.
em residências The efficiency
da população de curve meets the
baixa renda. A 1.911,1 – 2.309,6 14.447.343 9.079.651 5.358.072 3.611.836 2.269.913 1.339.518 2.480.154,0 standard
fração solar F é classified as
2.309,6 – 2.376,8 48.519.937 36.776.206 11.709.431 12.129.984 9.194.051 2.927.358 2.294.565,5
definida como a Type A by the
razão entre a 2.376,8 – 2.473,3 24.933.479 20.805.483 4.082.695 6.233.370 5.201.371 1.020.674 1.538.850,7 INMETRO
economia de 2.473,3 – 2.584,0 51.738.039 45.443.008 6.257.941 12.934.510 11.360.752 1.564.485 1.171.379,9 (Brazilian
eletricidade e a 2.584,0 – 3.039,1 47.759.416 42.065.036 5.664.617 11.939.854 10.516.259 1.416.154 1.029.926,6 Institute for
energia total Metrology). The
necessária para life cycle
52 o aquecimento da água sem o uso de aquecedor solar. O sistema
adotado para o cenário apresenta uma área útil de 1,6m2 com volume
considered in the analysis was 20 years. It was supposed that the
electricity price in 0.12US$/kWh, the fuel inflation at 5% per year and
diário de 120 litros e preço total de US$500. A curva de eficiência the interest rate equal to 10% per annum. The power consumption was
atende o padrão classificado como Tipo A pelo INMETRO (Instituto estimated on basis of a water temperature of 40°C at the shower and
Brasileiro de Metrologia). O ciclo de vida considerado na análise tem a the seasonal mean of air temperature for the location under
duração de 20 anos. Considerou-se o custo da eletricidade em consideration. Table 5 shows the data obtained with the analysis
0,12US$/kWh, a inflação do combustível em 5%aa e uma taxa de juros performed and the maps shown in Figure 19 exhibit (a) the total
. .
(a) Energia total (a) Total
necessária para required energy
aquecimento e for water
(b) tempo de heating and
retorno do (b) payback
investimento time (PB).
(PB).](https://image.slidesharecdn.com/brazilsolaratlasr1-130313102328-phpapp02/85/Brazil-solar-atlas_r1-54-320.jpg)
![de 10%aa. O consumo de energia foi estimado assumindo a required energy for heat and (b) the time for a return on the investment
temperatura da água em 40º C no chuveiro e a temperatura ambiente (PB). The payback is smaller for regions with greater energy demand
Atlas Brasileiro de Energia Solar
climatológica para o local em estudo em função do estação do ano when compared to regions with greater solar energy availability. That
(Verão, Outono, Inverno e Primavera). A Tabela 5 apresenta as suggests better results could be obtained in these regions with smaller
informações obtidas com a análise realizada e os mapas apresentados systems (smaller cost). Notice that a system with a cost still lesser than
na Figura 19 mostram (a) a energia total necessária para aquecimento e the one given here as an example would bring better returns. Table 6
(b) o tempo de retorno do investimento (PB). O tempo de retorno do exhibits the results for the case study done for the city of Brasilia where
investimento é menor para regiões com maior demanda de energia inhabitants represent the total number of people (urban + rural) with
quando comparadas a regiões com maior disponibilidade de energia and income below US$1,000/month.
solar, o que indica que nessas regiões seriam obtidos
melhores resultados com sistemas menores (menor . Estudo de Caso para a cidade de . A case study for Brasilia - the results
custo). Observe-se que um sistema com custo ainda Brasília a partir dos resultados apresentados obtained for the scenario that adopts a low
menor que o aqui utilizado como exemplo traria para o cenário de adoção de um sistema solar cost solar water heating system in low-income
melhores retornos. A Tabela 6 apresenta os resultados de baixo custo para aquecimento de água em households. The number of inhabitants
para o estudo de caso realizado para a cidade de residências da população de baixa renda. O represents the population living in Brasilia
Brasília onde a população atingida representa o número de habitantes é formado pela (urban + rural area) with an income below
número total de habitantes (urbana + rural) com renda população residente em Brasília (urbana + US$1,000/month.
rural) com renda inferior a US$1000 ao mês.
inferior a US$1000/mês.
Renda inferior a
1.004.826,7 322.303 323,9 2.993,1 2,9
1000US$/mês
E stão apresentadas neste tópico duas grandes aplicações da
tecnologia PV no Brasil que foram identificadas e mostram a existência 53
de potencial para grandes volumes. O conhecimento detalhado da
distribuição do potencial de energia solar é crítico para o
desenvolvimento dos cenários e em levantamentos de viabilidade
T his topic presents two major applications for PV in Brazil, where
there is a potential for large capacity for investiments, and for which the
econômica para ambas as aplicações. accurate knowledge of the solar resource distribution is critical.
SISTEMAS HÍBRIDOS DIESEL-PV EM PEQUENAS HYBRID DIESEL-PV SYSTEMS IN MINI-GRIDS IN
REDES NA REGIÃO AMAZÔNICA THE AMAZON REGION
A tualmente, é largamente difundido que a descentralização da
distribuição de energia e do aproveitamento de fontes de energia é a
I n most of the large countries of the developing world, it is widely
acknowledged that distributed resources are the only way of providing
única forma de entregar eletricidade para bilhões de pessoas que ainda electricity to the billions of people that presently do not have access to
não tem acesso a essa comodidade essencial para a qualidade de vida. it. There is no capital available and it is not cost-effective to deliver
Não há capital disponível e o custo efetivo inviabiliza a distribuição na power in the traditional way. Long distances and relatively small energy
forma tradicional. As grandes distâncias e a demanda relativamente demands make transmission and distribution costs prohibitive.
baixa tornam os custos de transmissão e distribuição proibitivos.
A maior parte da região Amazônica não está conectada ao sistema
T he most of Amazon region is not linked to the Brazilian inter-
connected system of electricity distribution as shown in the Figure 20.
interligado de distribuição de eletricidade do Brasil, como pode ser There are currently hundreds of mini-grids operated by independent
observado na Figura 20. Atualmente há centenas de pequenas redes power producers (IPPs) or local state utilities in the Amazon, that cover
operadas por produtores independentes ou fornecedoras de energia the main share of this energy demand, which is however only a small
estatais, cobrindo a maior parte da demanda dessa região que proportion of the country's total energy consumption. Mini-grids extend
corresponde a uma pequena parcela do consumo total de energia do over some 45% of the area, but supply energy to only 3% of the
país. As pequenas redes cobrem cerca de 45% da área, mas fornecem population [36]. Most of the sites where they operate are not easily
energia a somente 3% da população [36]. A maioria dos locais onde elas accessible, increasing cost and decreasing reliability of supply. The
operam não são facilmente acessíveis, aumentando os custos e operators of these systems, however, all make use of a subsidy that](https://image.slidesharecdn.com/brazilsolaratlasr1-130313102328-phpapp02/85/Brazil-solar-atlas_r1-55-320.jpg)
![diminuindo a confiabilidade desses recursos. Os operadores desses covers 100% of the fuel, as long as they operate at or below the 0.34
sistemas, no entanto, fazem uso de um subsídio que paga 100% do l/kWh specific consumption limit. This government subsidy’s life span
Atlas Brasileiro de Energia Solar
combustível, conquanto que eles operem abaixo do limite de consumo has recently been extended for another 20 years. Utilities are allowed
específico de 0,34 l/kWh. O período de duração desse subsídio to include a surcharge to all urban and rural consumers of the national
governamental foi aumentado para mais 20 anos. As prestadoras de interconnected system to collect funds to subsidize consumers of these
serviço são autorizadas a cobrar uma taxa maior de todos os isolated systems. This surcharge system, and the funds collected, are
consumidores urbanos e residenciais do directed to the so-called Isol-CCC Account (Fuel Consumption Account
sistema elétrico interligado brasileiro, de of the Isolated Systems) which sub-sidizes diesel for the thermal plants
maneira a adquirir fundos para subsidiar os in isolated mini-grids.
consumidores desses locais isolados. Esse
sistema de sobre-taxa, e os fundos
arrecadados, são dirigidos dire-
T he potential for using PV, however, is huge, and can be
estimated in tens to hundreds of MWp in the Amazon
tamente a chamada Conta de region alone, even if only a fraction of the 286
Consumo de Combustíveis dos existing diesel power plants with a
Sistemas Isolados, que subsidia total installed capacity of over
o diesel das centrais térmicas 620 MVA would adopt
das pequenas redes some PV to an optimum
isoladas. DIESEL-PV mix [37].
O potencial de uso de
PV, no entanto, é imenso,
Furthermore, while the
solar radiation resource
distribution in the region
e pode ser estimado de is considerable, and
dezenas a centenas de MWp with a small seasonal
somente na região amazônica, variation, as de-
mesmo se somente uma monstrated by
parcela das 286 centrais de the resource
54 geração diesel existentes, com
capacidade de 620MWA,
maps presented
earlier in this
adotassem módulos PV numa Atlas, the wind
proporção diesel-PV otimizada [37]. resource distribu-
Além disso, enquanto a tion in the Amazon
distribuição da radiação solar na region is one of the worst in the
região é considerável, e com country (26,45 TWh/ano) [5]. As a result,
pequena variação sazonal, tal Solar PV is one of the most viable renewable
como demonstrado pelo energy technologies currently available for the
mapeamento apresentado neste dispersed and relatively small energy density
Atlas, a distribuição dos recursos demands in the region. Lower diesel consumption during
eólicos na região é uma das piores daytime hours and reduction of greenhouse gases
do país (26,45 TWh/ano) [5]. emission are examples of other
Dessa forma, a tecnologia solar . . benefits bring out by using simple
PV é uma das alternativas mais Sistema interligado de distribuição Interconected system for electricity hybrid DIESEL-PV system without
viáveis de energia renovável de eletricidade no Brasil [2]. distribution in Brazil [2]. storage, where PV systems are
atualmente disponível para atender added to existing diesel thermal
a demanda da região, que é dispersa e de relativamente pequena plants with prospects of future conversion to fuel cell / PV hybrid
densidade energética. A economia de combustível fóssil e a redução configurations, in which case energy generation would rely 100% on PV.
de emissão de gases do efeito estufa são exemplos dos benefícios
trazidos pela adoção de um sistema simples com a adição de gerador
fotovoltaico sem capacidade de armazenamento de energia à uma
T he solar radiation resource distribution in the region is considerable
(around 5.5 MW/m2), and with a small seasonal variation. These
planta térmica alimentada com óleo diesel. Acrescenta-se a isso a features match up the technical standards requirements for mini-hybrid
perspectiva de conversão futura para uma configuração systems technology. Figure 21 shows, on an annual average, the daily
fotovoltaico/célula de combustível resultaria numa geração 100% PV generation yields, in kWh/kWp, that can be expected for the
“limpa e renovável” baseada exclusivamente no recurso solar. amorphous silicon thin-film PV technology deployed at latitude-tilted
arrays in the Amazon region, together with the location of villages/towns
and diesel-fired generation units in the region. Besides all the solar](https://image.slidesharecdn.com/brazilsolaratlasr1-130313102328-phpapp02/85/Brazil-solar-atlas_r1-56-320.jpg)
![O mapeamento dos recursos de energia solar mostram um
Atlas Brasileiro de Energia Solar
elevado fluxo de radiação solar na região Amazônica (cerca de
5,5 MW/m2) com baixa variabilidade inter-sazonal e adequada
aos padrões técnicos recomendados para a tecnologia de
mini-sistemas híbridos. A Figura 21 mostra, numa média anual,
o potencial disponível para a geração diária PV, em kWh/kWp,
que pode ser esperada para a tecnologia PV de silício amorfo
em filme fino empregado na região da Amazônia, junto às
pequenas cidades e vilarejos locais e unidades de geração
diesel da região. Além dos mapas de disponibilidade solar
apresentados neste Atlas, o projeto SWERA disponibiliza
também dados numa base mensal, onde a variabilidade
sazonal pode ser vista com maior detalhe
(http://swera.unep.net/).
SISTEMAS PV INTERLIGADOS À REDE EM
ÁREAS URBANAS
A maior parte do impressionante crescimento do mercado
PV está relacionada a instalações conectadas à rede nos países
desenvolvidos. Existe um imenso potencial para essa aplicação . Potencial disponível para a . The daily PV generation yields,
em áreas urbanas ensolaradas por todo o mundo. O Brasil está geração diária PV, em kWh/kWp, na in kWh/kWp, in the Amazon region [38].
particularmente bem situado para esse tipo de aplicação, por
causa da considerável disponibilidade de recurso energético
região da Amazônia [38].
resource maps shown in this Atlas, the SWERA project provides solar
55
solar, e o alto valor que pode ser dado a sistemas PV em áreas
comerciais de centros urbanos [39]. Os mapas de irradiação solar em data on a monthly basis, where seasonal trends can be seen in more
um plano inclinado no valor da latitude local apresentados neste detail (http://swera.unep.net/).
Atlas (páginas 38 e 39) demonstram tanto a possibilidade de
utilização de PV por todo o país quanto à pequena variação sazonal
ao longo do ano. No levantamento da viabilidade econômica de
projetos PV, informações mais detalhadas do comportamento GRID-CONNECTED PV SYSTEMS IN URBAN
sazonal da distribuição de radiação solar são necessárias, e a base de AREAS
dados do projeto SWERA disponibiliza o mapeamento desse recurso
solar em resolução temporal mensal (http://swera.unep.net/).
T he impressive growth in the PV market is related to grid-connected
S istemas PV podem contribuir para a capacidade máxima de uma
rede se o pico de demanda ocorre no período diurno. Regiões
installations in developed countries. There is a huge potential for this
application in sunny urban areas all over the world as well. Brazil is
comerciais com altas cargas de ar-condicionado no horário do particularly well suited for the application of grid-connected PV due to
meio-dia em geral possuem curvas de demanda em boa sincronia both a considerable solar resource availability, and to the high value that
com a radiação solar [40, 41]. Outro fator importante para essa análise can be attributed to PV in commercial areas of urban centers [39]. The
é a comparação entre os valores de pico de carga no inverno e no maps on pages 38 and 39 present the annual and seasonal averages of
verão. Quanto maior a demanda no verão em comparação com o the daily solar radiation availability at the latitude-tilted plane for the
período de inverno, maior a possibilidade de a carga coincidir com Brazilian territory, demonstrating both the potential of deploying PV all
a disponibilidade do recurso solar. Esse é o comportamento típico over the country, and the small seasonal variability throughout the year.
na maioria das capitais do Brasil. Curvas de dados de consumo das In the assessment of the economic viability of PV projects, more
áreas urbanas de todo o país mostram diferença entre as regiões detailed information on the seasonal behavior of the solar radiation
onde prédios comerciais dominam, apresentando picos de demanda resource distribution is necessary. Similar maps on a monthly basis are
no período diurno, e regiões residenciais, onde os valores de pico available in SWERA database (http://swera.unep.net/).
de demanda ocorrem ao anoitecer. Para fazer melhor proveito da
natureza distribuída da geração solar de eletricidade, é importante](https://image.slidesharecdn.com/brazilsolaratlasr1-130313102328-phpapp02/85/Brazil-solar-atlas_r1-57-320.jpg)
![saber a capacidade PV de diferentes regiões da cidade quando
instalando uma nova estação PV, de maneira a selecionar o P V can contribute to a utility’s capacity if the demand peak occurs in
Atlas Brasileiro de Energia Solar
consumidor com maior potencial de crédito. Nesse contexto, o the day-time period. Commercial regions with high midday air-
conceito de Potencial Efetivo de Amenização de Carga de PV foi conditioning loads have normally a demand curve in a good
definido, para quantificar o potencial de crédito de uma instalação synchronism with the solar irradiance [40, 41]. Another important factor in
PV localizada estrategicamente [41, 42]. A Figura 22 mostra, para uma this analysis, is the comparison between the peak load values in summer
curva de demanda típica em um centro urbano, o efeito de redução and winter. The greater the demand in summertime in comparison with
de pico ao adicionar um pequeno número de módulos PV (por the demand in wintertime, the more closely the load is likely to match
exemplo, 2m2 de painéis fotovoltaicos de filme fino de silício amorfo the actual solar resource. This is the typical picture of most capital cities
com 15% de eficiência) para auxiliar na redução dos requisitos de in Brazil. Utility feeders in urban areas all over the country show distinct
carga da rede. Para determinar o potencial benefício dos sistemas PV regions where commercial and office buildings dominate, and which
como mostrado na Figura 22, é necessário conhecimento da present daytime peak demand curves, and residential regions where the
distribuição da radiação solar numa base horária, e essa informação peak demand values take place in the evening. To add value to the
pode ser acessada para todo o território brasileiro através da base de distributed nature of solar generated electricity, it is important to know
dados gerada no projeto SWERA. Em um futuro próximo, quando o the PV capacity of the different regions of a city when installing a PV
uso de sistemas PV inter- power plant, in order to select
ligados à rede elétrica se the feeder with the greatest
tornar mais difundido, com a capacity credit. In this context,
redução dos custos e the concept of the Effective
reconhecimento dos bene- Load Carrying Capacity (ELCC)
fícios da geração PV of PV was defined, to quantify
distribuída, o levantamento the capacity credit of a
do Potencial Efetivo de strategically sited PV ins-
Amenização de Carga será de tallation [41, 42]. Figure 22 shows,
alto valor estratégico para for a typical daytime peaking
fornecedores de energia e utility feeder in an urban
56 investidores.
. Efeito de redução de pico ao . Peak-shaving effect of
center, the peak-shaving effect
of adding a small amount of PV
to assist in reducing the load
adicionar-se um pequeno número de adding a small amount of PV to assist in
módulos PV para auxiliar na redução reducing the load requirements of the requirements of the feeder (for
dos requisitos de carga da rede numa feeder for a typical daytime peaking example using 2m2 of a thin
curva de demanda típica de um centro utility feeder in an urban center. amorphous silicon PV pannel
urbano. with efficiency around 15%).
To determine the capacity
benefits of PV as shown in Figure 22, knowledge of the solar radiation
resource distribution on an hourly basis is necessary, and this
information can be retrieved for the whole of the Brazilian territory
through SWERA. In the near future, when the use of grid-connected PV
becomes more widespread due to both cost reductions and the
acknowledgment of the benefits of distributed PV, the assessment of
ELCC will be of strategic value for utilities and investors.](https://image.slidesharecdn.com/brazilsolaratlasr1-130313102328-phpapp02/85/Brazil-solar-atlas_r1-58-320.jpg)
![Atlas Brasileiro de Energia Solar
REFERÊNCIAS BIBLIOGRÁFICAS (REFERENCES)
1. Goldemberg, J.; Villanueva, L. D. Energia, meio ambiente e desenvolvimento. São Paulo: EDUSP, 225p., 2003.
2. Agência Nacional de Energia Elétrica, Ministério de Minas e Energia. Balanço Energético Nacional - BEN 2004, 2004. [online]
http://www.mme.gov.br/, 2005.
3. Stivari, S. M. S; Oliveira, A. P.; Soares, J. On the climate impact of the local circulation in the Itaipu lake área. Climatic Change, 72(1-2):103-121,
2005.
4. Fearnside, P. M. Do hydroeletric dams mitigate global warming? The case of Brazil’s Curuá-Una dam. Mitigation and Adaptation Strategies for
Global Change, 10:675-691, 2005.
5. Centro de Pesquisas de Energia Elétrica. Atlas do Potencial Eólico Brasileiro. CEPEL/ELETROBRÁS/Ministério de Minas e Energia. 45p., 2001.
6. Tiba, C. Atlas Solarimétrico do Brasil – banco de dados terrestres. Recife: Editora Universitária da UFPE, 2000.
7. Colle, S.; Pereira, E. B. Atlas de irradiação solar do Brasil – 1ª. versão para irradiação global derivada de satélite e validada na superfície. Brasília:
Instituto Nacional de Meteorologia, 1998.
8. Pereira, E.B., Colle, S. A energia que vem do sol. Ciência Hoje. 22(130): 24-35. 1997.
9. Perez, R.; Seals, R.; Zelenka, A. Comparing Satellite Remote Sensing and Ground Network Measurements for the Production of Site/Time Specific
Irradiance Data. Solar Energy, 60 (2): 89-96, 1997.
10. Guarnieri, R. A.; Martins, F. R.; Silva, S. A. B.; Pereira, E. B. Avaliação de estimativas de radiação solar incidente baseadas em extrapolação e
57
interpolação na região sudeste do Brasil. Anais do XIV Congresso Brasileiro de Meteorologia realizado em Florianópolis, 2006.
11. Gambi, W. Avaliação de um modelo físico estimador de irradiância solar baseado em satélites geoestacionários. Dissertação de Mestrado.
Universidade Federal de Santa Catarina. Florianópolis, 1998.
12. Lenoble, J. Radiative transfer in scattering and absorbing atmospheres: standard computational procedures. Virginia: A. Deepak Publishing,
1985.
13. Martins, F. R. Influência do processo de determinação da cobertura de nuvens e dos aerossóis de queimada no modelo físico de radiação
BRASIL-SR. Tese de Doutoramento apresentada no Instituto Nacional de Pesquisas Espaciais. São José dos Campos, Agosto 2001.
14. Stuhlmann, R.; Rieland, M.; Raschke, E. An improvement of the IGMK model to derive total and diffuse solar radiation at the surface from satellite
data. J. Applied Meteorology, 29(7): 586-603, 1990.
15. Pereira, E. B.; Martins, F. R.; Abreu, S. L.; Couto, P.; Stuhlmann, R.; Colle, S. Effects of burning of biomass on satellite estimations of solar irradiation
in Brazil. Solar Energy, 68(1): 91-107, 2000.
16. Leckner, B. The spectral distribution of solar radiation at the Earth’s surface – elements of a model. Solar Energy, 20(2): 143-150, 1978.
17. McClatchey, R. A.; Fenn, R. W.; Selby, J. E. A.; Volz, F. E.; Garin, J. S. Optical properties of atmosphere. Bedford, Massachusetts: Air Force
Cambridge Research Laboratories, (AFCRL-72-0497), 108p, 1972.
18. Warren, S. G.; Hahn, C. J.; London, J.; Chervin, R. M.; JennE, R. Global distribution of total cloud cover and cloud types amount over land.
DOE/ER/60085-H1, NCAR/TN-273+STR, NCAR Technical Notes, 1986.
19. Stephens, G. L. Radiation profiles in extended water clouds. II: parameterization schemes. Journal of Atmospheric Science, 35: 2123-2132, 1978.
20. Sellers, P.J.; Los, S.O.; Tucker, C.J.; Justice, C.O.; Dazlich, D.A.; Collatz, G.J.; Randall, D.A.. A revised land surface parameterization (SiB2) for
atmospheric GCMs. Part 2: The generation of global fields of terrestrial biophysical parameters from satellite data. Journal of Climate, 9:706-737,
1995.](https://image.slidesharecdn.com/brazilsolaratlasr1-130313102328-phpapp02/85/Brazil-solar-atlas_r1-59-320.jpg)
![21. Harshvardhan; Davies, R.; Randall, D.A.; Corsetti, T.G. A fast radiation parameterization for general circulation models. Journal of Geophysical
Research, 92:1009-1016, 1987.
Atlas Brasileiro de Energia Solar
22. BSRN, Baseline Solar Radiation Network – Quality Assurance of Database. World Meteorological Organization. [online]: http://bsrn.ethz.ch/.
23. Ceballos, J. C.; Bottino, M. J.; Souza, J. M. A simplified physical model for assessing solar radiation over Brazil using GOES 8 visible imagery. Journal
of Geophysical Research, 109, D2, D02211 10.1029/2003JD003531, 2004.
24. Rigollier, C.; Lefreve, M.; Wal, L. The method HELIOSAT-2 for deriving shortwave solar radiation from satellite images. Solar energy, 77:159-169,
2004.
25. Zelenka , A.; Perez, R.Prediciting solar irradiance from satellite – Estimated global irradiance and cloud cover. Application of Satellite Technology -
Annual Progress Report. Geneva: World Meteorological Organization, 1986.
26. Perez, R. Seals, R.; Stewart, R. Modelling irradiance on tilted planes: a simpler version of the Perez Model. Proc. of ISES World Congress in
Hamburg, Germany, 1987.
27. Perez, R. Seals, R.; Ineichen, P.; Stewart, R.; Menicucci, D. A new simplified version of the Perez Diffuse irradiance model for tilted surfaces, Solar
Energy, 39: 221-232, 1987.
28. Diekmann, F. J.; Happ, S.; Rieland, M.; Köln, Benesch, W.; Offenbach, Czeplak, G.; Kasten F. An operational estimate of global solar irradiance at
ground level from METEOSAT data: results from 1985 to 1987. Meteorol. Rdsch., 41, 65-79, 1988.
29. INMET. Normais Climatológicas – 1931 a 1990. [online] http://www.inmet.gov.br/.
30. Beyer, H. G.; Pereira, E. B.; Martins, F. R.; Abreu, S. L.; Colle, S.; Perez, R.; Schillings, C.; Mannstein, H.; Meyer, R.. Assessing satellite derived
irradiance information for South America within the UNEP resource assessment project SWERA. Proceedings of the 5th Ises Europe Solar
Conference, held in Freiburg, Germany, 2004.
31. Martins, F. R.; Pereira, E. B., Abreu, S. L.; Beyer, H. G.; Colle, S.; Perez, R.; Heinemann, D. Cross-validation of the satellite radiation transfer models
during SWERA project in Brazil. Proceedings of the ISES World Congress, held in Goteborg, Sweden, 2003.
32. Perez, R.; Ineichen, P.; Moore, K.; Kmiecik, M.; Chain, C.; George, R.; Vignola, M. A new operational modelfor satellites irradiances: description and
58 validation. Solar Energy, 73(5): 307-317, 2002.
33. European Database for Daylight and Solar Radiation, 2005. [online]:http://www.satel-light.com/.
34. Associação Brasileira de Refrigeração, Ar Condicionado, Ventilação e Aquecimento. [online]: http://www.abrava.com.br/.
35. Duffie J. A.; Beckman, W. A. Solar Engineering of Thermal Processess. New York: John Wiley, 2nd edition, 1991.
36. Rüther, R.; Schmid, A.; Beyer, H. G.; Montenegro, A.A.; Oliveira, S.H.F. Cutting on Diesel, boosting PV: The potential of hybrid DIESEL-PV systems
in existing mini-grids in the Brazilian Amazon, Proceedings of the 3rd World Conference on Photovoltaic Energy Renewable and Rural Electrification
Conversion, Osaka - Japan, 555 – 558, 2003.
37. Beyer, H.G.; Rüther, R.; Oliveira, S.H.F. PV systems as option to assist Diesel based electricity supply in the Brazilian Amazon, in, Ed. G.
Chakravarthy, A. Shukla & A. Misra, pp. 179 – 194, 2004.
38. ONS, Operação Nacional do Sistema Elétrico Interligado: dados relevantes de 2001.
39. Rüther, R. Edificios Solares Fotovoltaicos: O potencial da geração solar fotovoltaica integrada a edificações urbanas e interligada à rede elétrica
pública no Brasil, ISBN 858758304-2, pp. 1 – 113, 2004.
40. Perez, R.; Letendre, S.; Herig,C. PV and Grid Reliability: Availability of PV Power during Capacity Shortfalls, Proceedings of the American Solar
Energy Society - ASES Annual Conference, Washington, DC, , 1-4, 2001.
41. Knob, P.; Rüther, R.; Jardim, C.S.; Beyer, H.G. Investigating the peak demand reduction capability of PV: A case study in Florianopolis, south
Brazil, Proceedings of the 19th European Photovoltaic Solar Energy Conference, Paris – France, 877 – 890, 2004.
42. Perez, R.; Seals, R.; Herig, C. PV can add capacity fo the grid, NREL Publication DOC/GO-10096-262, NREL, Golden – USA, 1996.](https://image.slidesharecdn.com/brazilsolaratlasr1-130313102328-phpapp02/85/Brazil-solar-atlas_r1-60-320.jpg)


Este documento apresenta o Atlas Brasileiro de Energia Solar, que foi desenvolvido como parte do projeto SWERA para mapear os recursos de energia solar do Brasil. O atlas contém mapas e dados digitais de irradiação solar do Brasil gerados a partir de um modelo de transferência radiativa. Ele também fornece cenários de uso de energia solar usando ferramentas de sistema de informações geográficas. O atlas é dividido em cinco seções e tem como objetivo auxiliar no planejamento de projetos de energia solar no Brasil.