SlideShare uma empresa Scribd logo
1 de 6
Baixar para ler offline
888 The Leading Edge July 2008
Modern land recording systems: How do they weigh up?
As hydrocarbons are becoming more difficult to find and
to produce, operators who utilize relevant advanced
technology have a clear advantage. What is not always clear
is which advanced technology is relevant or applicable in
a given situation. If we look at developments in land 3D
seismic surveying over the last few years, we see a dramatic
increase in the capabilities of the equipment being used and
also innovative methods of its usage. We have seen significant
increases in the trace densities of surveys and the recording
intervals have been decreasing accordingly, but at what trace
interval do we cease using geophone arrays and start using
point receivers? Should these receivers be vertical component
(1-C) sensors or multicomponent (3-C)? Should we use
capacitance-basedMEMSsensorsorinduction-basedmoving-
coil geophones? Finally, advances in electronic systems now
permit recording data without the use of telemetry cables—
either by transmitting the data back to the recording truck
by radio for quality control purposes and immediate storage
on tape or discs or by storing it locally at the receiver for later
recovery. Are there circumstances where there is a significant
benefit from the utilization of a cable-less system as opposed
to one with cables? This paper will discuss some geophysical
and operational factors related to these questions.
MALCOLM LANSLEY, Sercel, Houston, USA
MIKE LAURIN, CGGVeritas
SHUKI RONEN, Chevron, San Ramon, USA
SPECIAL SECTION: S e i s m i c a c q u i s i t i o n
Geophysical considerations (data quality)
The signal-to-noise ratio is how most geophysicists evaluate
the quality of a seismic survey. When considering the use
of point receivers instead of geophone arrays, it is very im-
portant to remember that there is both a numerator (signal)
and a denominator (noise). It is important to understand the
characteristics of the signals that we wish to preserve and the
noises that we wish to attenuate. Is the desired signal from
a relatively strong, shallow reflector that we can expect to
record with high frequencies and broad bandwidth, or is it
from a deep formation with a weak reflection coefficient and
correspondingly lower energy? If the latter, can we expect a
single point sensor to give us the same signal strength as a
well-planted array of 12 or more geophones?
Is the noise primarily random ambient noise (wind, rain,
etc.), or is it coherent source-generated (e.g., ground roll),
scattered source-generated, or perhaps a combination of all
three? Although random noise may be attenuated very well by
the use of higher-trace density surveys, geophone arrays may
still offer an advantage in areas with very high random noise
levels. However, for ground roll, we cannot deploy geophones
arrays that are sufficiently long to attenuate the noise wave-
lengths without also suffering significant signal attenuation,
Figure 1. Shot record with 12 vertical geophones per group (left); single-sensor vertical component DSU MEMS before polarization filters
(center) and after such filtering (right). Polarization filters use the data from the horizontal components to attenuate noise on the vertical
component. Other methods (not shown here) are used to attenuate noise on 1-C data. Comparing the data from the geophone groups to the single-
sensor MEMS, it is evident that the single-sensor data are noisier but also contain more signal especially in the high frequencies.
July 2008 The Leading Edge 889
the three geophones, together with the
operational difficulties of leveling and
aligning them (Lansley et al., 1998)
and channel-capacity limitations of
the old recording systems, result in
costly data acquisition; hence, the use
of multicomponent surveys has been
limited. In recent year, the introduc-
tion of digital MEMS sensors and very
high channel-count recording systems
has eliminated the weight and level-
ing problems. Yet we still do not see
widespread recording of 3-C surveys,
except in a few areas. Why? If we again
consider the question of arrays versus
point receivers, it is necessary to un-
derstand that, due to the digital nature
of their electronics, MEMS sensors
cannot be connected in arrays to per-
form electrical summation in the same
way as analog sensors. Therefore, in or-
der to record 3-C data with MEMS,
we are automatically recording with a
point receiver or single sensors.
Single sensors eliminate intra-array
statics and the effects of differential
NMO, and MEMS have a wider fre-
quency band and do not have high-fre-
quency spurious noise. Therefore, they provide better signal
than geophone groups, with improved resolution and mul-
ticomponent data, and they also provide more random and
coherent noise. This increased noise with single sensors must
be compensated by increased data density and more sophis-
ticated data processing. It is also apparent that getting the
full value from analysis of shear waves is more difficult than
actually acquiring multicomponent data (Mattocks et al.,
2005; Roche et al., 2006). In order to deliver the same final
data quality as is recorded with geophone arrays, surveys with
single sensors typically require smaller station intervals. We
have found that single-sensor intervals must be, at most, half
of geophone group intervals. Figures 2-4 show one example
of 3D data from the United States in which single sensors,
with an interval of 110 ft, provided similar final data quality
to groups of six geophones at 220 ft.
In this example, a small 3D survey was recorded with the
following parameters. Receiver lines were oriented NS with a
nominal line interval of 1650 ft. Production geophone arrays
with six geophones per group were planted along the receiver
lines at an interval of 220 ft. In the center of the survey area,
an embedded test, consisting of 544 additional MEMS 3-C
single sensors, was planted along seven of the receiver lines
(red in Figure 2). These single sensors were spaced at an in-
terval of 110 ft so that alternate receivers were aligned with
the centers of the production geophone groups and the others
were midway between. Sources were aligned primarily EW
with a nominal line spacing of 2420 ft. The source-point in-
terval was 330 ft and 1266 explosive shot points were drilled
S e i s m i c a c q u i s i t i o n
particularly on shallow, high-frequency reflections. There are
two solutions for attenuating coherent noise such as ground
roll. One solution is to reduce the station interval to less than
half a wavelength of the ground roll so that f-k filters can be
used. This is very expensive, no matter what type of sensors
are used. Ground-roll wavelengths can be less than 20 m and
the implied 10-m station interval may be prohibitively ex-
pensive. In 3D we have to provide sampling in the crossline
as well as in the inline direction. In 3D, ground roll can be
sampled and attenuated by f-k-k filters only at great cost due
to increased receiver and source effort. The other solution is
polarization filters as described by a number of authors in-
cluding de Meersman and Kendall (2005). Polarization filters
use the data recorded on the horizontal components to at-
tenuate ground roll on the vertical component and vice-versa.
Figure 1 shows a data example from the Green River Basin,
Wyoming (Ronen et al., 2005.) This comparison is between
data recorded using linear arrays of 12 geophones and single
3-C digital sensors with half the receiver spacing. The single
sensors are shown without and with polarization filtering. In
this case there is a significant advantage to recording all three
components of the ground motion to attenuate the ground
roll. The data on the right clearly show a strong reduction
in the amplitudes of the ground roll and much better signal
continuity.
Multicomponent (3-C) recording has been conducted on
land since the 1970s. For many years analog moving-coil geo-
phones were used, either in arrays or individually, in conjunc-
tion with conventional data recording systems. The weight of
Figure 2. Location map of the receiver spread (in a circle) and two shots, one at the center of the
spread and one outside.
890 The Leading Edge July 2008
S e i s m i c a c q u i s i t i o n
Figure 3. (a) Geophone groups data. (b) Single-sensor MEMS data. Two shot profiles with different offset ranges are shown for each data set.
Bandpass filter (8-12-80-100) and 1000-ms AGC. The geophones in groups of six have an advantage in signal/noise as can be seen, for example,
on the reflector at 1.2 and 1.5 s two-way traveltime.
892 The Leading Edge July 2008
ter than the single sensors and vice versa. In general, the geo-
phone data are marginally better in the deep section and the
MEMS data better at shallow depths. Since the single sensors
were recorded with finer spatial sampling, this agrees quite
well with what we expect. Note, however, that the single-
sensor data were recorded with half the receiver interval (i.e.,
twice the trace density) of the geophone group data.
A few years ago, acquisition systems were limited by chan-
nel count and reducing the receiver interval and recording
3-C was not practical. Fortunately, channel counts are no
longer an issue because modern systems have a capability of
100 000 channels in real time at a sampling rate of 2 ms.
Of course, although the recording of the seismic data with
most of the cable-less systems is in real time, the actual data
recovery for transfer to data processing and long-term storage
is not. In fact, data recovery and, hence, data processing may
be delayed significantly depending upon weather and other
operational issues.
The geophysical considerations relevant to comparing
cable to cable-less systems are less obvious. The same receivers
can be connected to either system. However, one big advan-
tage of cable telemetry is improved field QC with better mon-
itoring of noise levels and early detection of poor coupling.
Operational considerations (time and money)
The potential operational advantage of systems without ca-
and recorded simultaneously by both the production geo-
phone arrays and the single sensors. This enables comparison
of the different sensors to be made on single-fold shot records
and migrated data.
Two shot records (locations shown in Figure 2) are com-
pared in Figure 3. Figure 3a shows the data recorded by the
production groups of six geophones and Figure 3b that from
the single sensors. Both data sets are displayed with the same
filter and 1000-ms AGC scaling. Since the MEMS sensors
(Figure 3b) are recording acceleration and also have a much
wider bandwidth than the geophones, these data have been
integrated to velocity and match-filtered to simulate the
low-frequency response of the geophones. The single-sensor
MEMS data are decimated to the same trace spacing as the
regular geophone groups for comparison purposes. Note that
the reflections on the MEMS data compare very well with
the geophone data after integration (from acceleration to ve-
locity) and match-filtering to simulate the low-frequency re-
sponse of the geophones. Also, more high-frequency noise is
visible before the first breaks and on the deeper data.
Figure 4 is the comparison after 3D migration. The
MEMS data were processed using all of the data all of the
way through the data processing, but were decimated to the
same trace interval after migration for comparison purposes.
Overall, the signal-to-noise ratio is very comparable. There
are some places where geophone groups look marginally bet-
S e i s m i c a c q u i s i t i o n
Figure 4. Cross-sections from the conventional geophone groups data (left) and MEMS single-sensor data (right) after migration. The MEMS
single-sensor data have been decimated after migration to the same bin size for display. It therefore has the signal/noise benefit of having been re-
corded with twice the data density. In areas of complex geology, the benefit of the finer spatial sampling would be more visible. The factor two in
fold more or less compensated for the factor six in groups versus single sensors.
July 2008 The Leading Edge 893
agement, and source/spread manage-
ment.
As discussed earlier, when using
point receivers, the trace density is
typically doubled in order to provide
a similar signal-to-random-noise ratio
as would be achieved when using ar-
rays of six geophones. Therefore, when
considering equipment weight, this
factor needs to be comprehended. Fig-
ure 5 shows the approximate weight
relationship between three different
recording scenarios: a cable system
with arrays of six geophones, a cable
system with 3-C digital point receiv-
ers, and a cable-less system also using
3-C digital point receivers. The total
weights shown are for a 10 ϫ 10-km
square spread with 400-m receiver line
interval plotted against receiver station
interval. (For these weight compari-
sons, the choice of cable and the ac-
tual cable length between takeouts are
very important. The cable used in these
graphs is that recommended by Sercel
for 3-C single sensor deployment with
a weight of 47 kg/km.) The length of
cable between takeouts is equal to the
group interval plus 5 m for group in-
tervals of 20 m and larger and group
interval plus 3 m for intervals less than
20 m. For the cable system shown, the
weight of all ground equipment nec-
essary for data recording is included:
transverse cables, crossline telemetry
boxes, batteries, etc. There is a signifi-
cant weight advantage to using the dig-
ital 3-C sensors, even when the record-
ing group interval is halved as shown
on the graph. This is due to the large
difference in weight between a string
of six geophones (3.3 kg, not including
digitizer) and the weight of one of the
equivalent two 3-C digital sensors (2
ϫ 0.5 kg including digitizer). What is
also apparent is that, for large group in-
tervals (coarse spatial sampling), there
may be a slight weight advantage for
the system without cables. However, as
the industry moves to higher and higher trace densities and
finer spatial sampling, the weight advantage moves in favor
of the cable system. If we compare systems with 3-C digital
sensors, the crossover between cable and cable-less systems is
at approximately 50 m (or ~165 ft.)
Figure 6 shows an alternative view of the same informa-
tion where the weight per 3-C digital sensor station is plotted
against the group interval. Here the advantage of a cabled
bles is in areas with limited access or on surveys where the re-
ceiver station interval is large. Cable-based systems have op-
erational advantages where cables can be deployed, receiver
station intervals are small and they also have the geophysical
advantage of improved field QC.
The most important factors that govern the operational
and recording efficiency are: equipment weight, power con-
sumption of the ground electronics, battery and power man-
Figure 6. Weight per receiver position, calculated from the total weight of all required ground
equipment divided by the number of receiver positions.
Figure 5. Total ground equipment weight as a function of receiver interval for a 10 × 10-km
recording spread with 400-m receiver line interval. All necessary equipment, including transverse
data transmission cables, boxes and batteries, is incorporated.
S e i s m i c a c q u i s i t i o n
894 The Leading Edge July 2008
S e i s m i c a c q u i s i t i o n
system is clearly apparent as the receiver station interval is
reduced. Since different cable-less systems have different ca-
pabilities (e.g., 1-C versus 3-C, analog sensors versus digital
MEMS) and different power consumption, it is difficult to
make direct comparisons. However, understanding the power
consumption and the corresponding battery requirements for
each type and make of receiver station will provide a good
estimate of the weight per receiver position. Comparison with
the weight of a cable system, such as shown in Figure 6, will
then provide a better understanding of the relative merits of
one system versus another in any given situation.
Power consumption and battery management are obvi-
ously related and the lower the power consumption of the
ground electronics the better. Although some battery types
may have very good power-to-weight ratios, initial and re-
placement cost may be significantly higher. Low temperatures
also affect battery life and some types (e.g., lithium-ion) may
not be very well suited to such environments. When we con-
sider the number of batteries deployed within an active re-
cording spread, with the cable-less system we have at least
as many batteries as receiver points, which today may range
from 5000 to 50 000. For battery charging and management,
an additional 50% is often necessary to ensure an adequate
supply of fully charged batteries. With a cable system, the
number of batteries per line is typically divided by 30-40,
which becomes much more manageable. Although each in-
dividual battery may be heavier, the type can be selected to
be appropriate for the operating environment and the man-
agement and recharging is much easier. Another issue that is
of concern for land surveys is whether the seismic source is
explosives or vibrators. For explosive surveys, the recording
time can be minimized by the use of several shooters and care-
ful management of the operations. Hence the battery life can
be optimized and may allow the deployed battery to remain
in the field until the station is picked up and rolled to the
next location. However, for vibrator recording the operations
are normally continuous and therefore require the recording
system to be active continuously. This increased recording
time means that most cable-less systems do not have adequate
battery life and will require battery replacement during the
time that the units are deployed at one receiver location. If
we consider a recording spread with 10 000 or more active
receiver locations, that is a very large number of batteries to
recharge and replace.
Modern high channel-count recording systems incorpo-
rate very efficient source and receiver spread management
tools that enable source-controlled shooting to be effectively
implemented. These, together with the real-time verification
of data quality, can ensure that these high-density multicom-
ponent surveys meet the desired objectives.
Conclusions
High-quality, high-density, multicomponent 3D surveys are
being acquired very cost-effectively using single sensors. The
receiver station interval (hence trace density) needs to be ad-
justed to compensate for the increased random noise that will
be recorded with single sensors. We have found that two 3-C
digital MEMS sensors are typically required to replace an
array of six geophones. In areas with weak reflection strength
or poor signal-to-noise ratio, where arrays with more than six
geophones are frequently used, the number of single sensors
may need to be increased even more to ensure that adequate
signal strength is being recorded. Despite this improved spa-
tial sampling, there is still a considerable reduction in the
weight of the ground equipment being deployed with a corre-
sponding improvement in operational efficiency. When com-
pared with the historical average recording production over
several prior recording seasons in the same area, statistics
from a number of large, Canadian, single-sensor surveys with
more than 170 500-receiver locations showed an increase of
better than 40% in the layout and pickup of the recording
equipment. A remarkable increase of more than 45% in the
number of shots recorded per day was also observed.
In areas with difficult access and/or high population den-
sities, such as cities, there will be a benefit in using cable-less
systems. For low trace density, coarsely sampled 3D surveys
with large receiver-station intervals, there will also be a slight
weight advantage in recording without cables. However, as
the spatial sampling becomes smaller and the trace density
greater, significant operational and recording efficiency ben-
efits are gained using cables. Uncommitted systems that offer
the flexibility to use either cables, or cable-less technology, or
a combination of both within the recording spread will per-
mit recording optimization under all conditions.
Suggested reading. “Multicomponent 3D seismic pilot
study in the Orinoco heavy oil belt” by Lansley et al. (SEG
1998 Expanded Abstracts). “A complex SVD-polarization fil-
ter for ground-roll attenuation on multicomponent data” by
de Meersman and Kendall (EAGE 2005 Extended Abstracts).
“Multicomponent seismic in rough terrain: an example from
Wyoming Green River basin” by Ronen et al. (SEG 2005
Expanded Abstracts). More general reading on some of the
additional benefits of 3-C recording may be found in “Pre-
diction of shale plugs between wells in heavy oil sands using
seismic attributes” by Gray et al. (Natural Resources Research,
2006); “Converted-wave azimuthal anisotropy in a carbon-
ate foreland basin” by Mattocks et al. (SEG 2005 Expanded
Abstracts) and “Delineating reservoir sands using PP and PS
seismic data” by Roche et al. (EAGE 2006 Extended Ab-
stracts).
Acknowledgements. The authors thank an anonymous client for
permission to show results using their data shown in Figures 2–4.
We also thank ExxonMobil for their support in the recording,
processing, and analysis of the data shown in Figure 1. Thanks also
to CGGVeritas and Sercel for their support during the preparation
of this paper.
Shuki Ronen was employed by CGGVeritas at the time this article
was authored.
Corresponding author: malcolm.lansley@sercel.com

Mais conteúdo relacionado

Mais procurados

TGS IMG- Clari-Fi
TGS IMG- Clari-Fi TGS IMG- Clari-Fi
TGS IMG- Clari-Fi TGS
 
Satellite Downlink Budget Analysis
Satellite Downlink Budget AnalysisSatellite Downlink Budget Analysis
Satellite Downlink Budget AnalysisPartho Choudhury
 
Different Multilayer Substrate Approaches to Improve Array Antenna Characteri...
Different Multilayer Substrate Approaches to Improve Array Antenna Characteri...Different Multilayer Substrate Approaches to Improve Array Antenna Characteri...
Different Multilayer Substrate Approaches to Improve Array Antenna Characteri...TELKOMNIKA JOURNAL
 
IGARSS 2011.ppt
IGARSS 2011.pptIGARSS 2011.ppt
IGARSS 2011.pptgrssieee
 
IGARSS_DESDynI_2011.pptx
IGARSS_DESDynI_2011.pptxIGARSS_DESDynI_2011.pptx
IGARSS_DESDynI_2011.pptxgrssieee
 
Proposed P-shaped Microstrip Antenna Array for Wireless Communication Applica...
Proposed P-shaped Microstrip Antenna Array for Wireless Communication Applica...Proposed P-shaped Microstrip Antenna Array for Wireless Communication Applica...
Proposed P-shaped Microstrip Antenna Array for Wireless Communication Applica...TELKOMNIKA JOURNAL
 
151_HEXAGONAL FRACTAL ANTENNA ARRAY FOR UWB APPLICATION
151_HEXAGONAL FRACTAL ANTENNA ARRAY FOR UWB APPLICATION151_HEXAGONAL FRACTAL ANTENNA ARRAY FOR UWB APPLICATION
151_HEXAGONAL FRACTAL ANTENNA ARRAY FOR UWB APPLICATIONNAMAN BHARGAVA
 
Link budget satalite for calculation system
Link budget satalite for calculation systemLink budget satalite for calculation system
Link budget satalite for calculation systemUniversity of Technology
 
Earth Station and Satellite Antennas
Earth Station and Satellite AntennasEarth Station and Satellite Antennas
Earth Station and Satellite Antennasfurkansleyman
 
Synthetic aperture radar
Synthetic aperture radar Synthetic aperture radar
Synthetic aperture radar Cigi Cletus
 
PLANAR ACS FED DUAL BAND ANTENNA WITH DGS FOR WIRELESS APPLICATIONS
PLANAR ACS FED DUAL BAND ANTENNA WITH DGS FOR WIRELESS APPLICATIONS PLANAR ACS FED DUAL BAND ANTENNA WITH DGS FOR WIRELESS APPLICATIONS
PLANAR ACS FED DUAL BAND ANTENNA WITH DGS FOR WIRELESS APPLICATIONS jantjournal
 
REVIEW OF FRACTAL TECHNIQUES FOR DESIGNING MICROSTRIP PATCH ANTENNA FOR X BAND
REVIEW OF FRACTAL TECHNIQUES FOR DESIGNING MICROSTRIP PATCH ANTENNA FOR X BANDREVIEW OF FRACTAL TECHNIQUES FOR DESIGNING MICROSTRIP PATCH ANTENNA FOR X BAND
REVIEW OF FRACTAL TECHNIQUES FOR DESIGNING MICROSTRIP PATCH ANTENNA FOR X BANDIJEEE
 
MINIATURISATION OF PATCH ANTENNA USING NOVEL FRACTAL GEOMETRY
MINIATURISATION OF PATCH ANTENNA USING NOVEL FRACTAL GEOMETRYMINIATURISATION OF PATCH ANTENNA USING NOVEL FRACTAL GEOMETRY
MINIATURISATION OF PATCH ANTENNA USING NOVEL FRACTAL GEOMETRYIAEME Publication
 
New Miniature Planar Microstrip Antenna Using DGS for ISM Applications
New Miniature Planar Microstrip Antenna Using DGS for ISM ApplicationsNew Miniature Planar Microstrip Antenna Using DGS for ISM Applications
New Miniature Planar Microstrip Antenna Using DGS for ISM ApplicationsTELKOMNIKA JOURNAL
 

Mais procurados (19)

TGS IMG- Clari-Fi
TGS IMG- Clari-Fi TGS IMG- Clari-Fi
TGS IMG- Clari-Fi
 
Satellite Downlink Budget Analysis
Satellite Downlink Budget AnalysisSatellite Downlink Budget Analysis
Satellite Downlink Budget Analysis
 
Different Multilayer Substrate Approaches to Improve Array Antenna Characteri...
Different Multilayer Substrate Approaches to Improve Array Antenna Characteri...Different Multilayer Substrate Approaches to Improve Array Antenna Characteri...
Different Multilayer Substrate Approaches to Improve Array Antenna Characteri...
 
Satellite link design
Satellite link designSatellite link design
Satellite link design
 
IGARSS 2011.ppt
IGARSS 2011.pptIGARSS 2011.ppt
IGARSS 2011.ppt
 
IGARSS_DESDynI_2011.pptx
IGARSS_DESDynI_2011.pptxIGARSS_DESDynI_2011.pptx
IGARSS_DESDynI_2011.pptx
 
Proposed P-shaped Microstrip Antenna Array for Wireless Communication Applica...
Proposed P-shaped Microstrip Antenna Array for Wireless Communication Applica...Proposed P-shaped Microstrip Antenna Array for Wireless Communication Applica...
Proposed P-shaped Microstrip Antenna Array for Wireless Communication Applica...
 
D0344029041
D0344029041D0344029041
D0344029041
 
A011130108
A011130108A011130108
A011130108
 
151_HEXAGONAL FRACTAL ANTENNA ARRAY FOR UWB APPLICATION
151_HEXAGONAL FRACTAL ANTENNA ARRAY FOR UWB APPLICATION151_HEXAGONAL FRACTAL ANTENNA ARRAY FOR UWB APPLICATION
151_HEXAGONAL FRACTAL ANTENNA ARRAY FOR UWB APPLICATION
 
Link budget satalite for calculation system
Link budget satalite for calculation systemLink budget satalite for calculation system
Link budget satalite for calculation system
 
Earth Station and Satellite Antennas
Earth Station and Satellite AntennasEarth Station and Satellite Antennas
Earth Station and Satellite Antennas
 
Synthetic aperture radar
Synthetic aperture radar Synthetic aperture radar
Synthetic aperture radar
 
PLANAR ACS FED DUAL BAND ANTENNA WITH DGS FOR WIRELESS APPLICATIONS
PLANAR ACS FED DUAL BAND ANTENNA WITH DGS FOR WIRELESS APPLICATIONS PLANAR ACS FED DUAL BAND ANTENNA WITH DGS FOR WIRELESS APPLICATIONS
PLANAR ACS FED DUAL BAND ANTENNA WITH DGS FOR WIRELESS APPLICATIONS
 
REVIEW OF FRACTAL TECHNIQUES FOR DESIGNING MICROSTRIP PATCH ANTENNA FOR X BAND
REVIEW OF FRACTAL TECHNIQUES FOR DESIGNING MICROSTRIP PATCH ANTENNA FOR X BANDREVIEW OF FRACTAL TECHNIQUES FOR DESIGNING MICROSTRIP PATCH ANTENNA FOR X BAND
REVIEW OF FRACTAL TECHNIQUES FOR DESIGNING MICROSTRIP PATCH ANTENNA FOR X BAND
 
MINIATURISATION OF PATCH ANTENNA USING NOVEL FRACTAL GEOMETRY
MINIATURISATION OF PATCH ANTENNA USING NOVEL FRACTAL GEOMETRYMINIATURISATION OF PATCH ANTENNA USING NOVEL FRACTAL GEOMETRY
MINIATURISATION OF PATCH ANTENNA USING NOVEL FRACTAL GEOMETRY
 
Freznal zone
Freznal zoneFreznal zone
Freznal zone
 
New Miniature Planar Microstrip Antenna Using DGS for ISM Applications
New Miniature Planar Microstrip Antenna Using DGS for ISM ApplicationsNew Miniature Planar Microstrip Antenna Using DGS for ISM Applications
New Miniature Planar Microstrip Antenna Using DGS for ISM Applications
 
EE4800report
EE4800reportEE4800report
EE4800report
 

Semelhante a Modern Land Recording- Systems

Improvement of Fading Channel Modeling Performance for Wireless Channel
Improvement of Fading Channel Modeling Performance for Wireless Channel Improvement of Fading Channel Modeling Performance for Wireless Channel
Improvement of Fading Channel Modeling Performance for Wireless Channel IJECEIAES
 
Path inclination
Path inclinationPath inclination
Path inclinationAshish Jain
 
Channel Overlapping Between IMT-Advanced Users and Fixed Satellite Service
Channel Overlapping Between IMT-Advanced Users and Fixed Satellite ServiceChannel Overlapping Between IMT-Advanced Users and Fixed Satellite Service
Channel Overlapping Between IMT-Advanced Users and Fixed Satellite ServiceEECJOURNAL
 
A Review Of Diversity Techniques For Wireless Communiation Systems
A Review Of Diversity Techniques For Wireless Communiation SystemsA Review Of Diversity Techniques For Wireless Communiation Systems
A Review Of Diversity Techniques For Wireless Communiation SystemsCourtney Esco
 
An empirically based path loss model for
An empirically based path loss model forAn empirically based path loss model for
An empirically based path loss model forNguyen Minh Thu
 
Prediction of wireless communication systems in the context of modeling 2-3-4
Prediction of wireless communication systems in the context of modeling 2-3-4Prediction of wireless communication systems in the context of modeling 2-3-4
Prediction of wireless communication systems in the context of modeling 2-3-4IAEME Publication
 
Jenner_ST_FB_Jan_2016
Jenner_ST_FB_Jan_2016Jenner_ST_FB_Jan_2016
Jenner_ST_FB_Jan_2016Hans Ecke
 
Smart antennas for mobile communications
Smart antennas for mobile communicationsSmart antennas for mobile communications
Smart antennas for mobile communicationspriyasindhu
 
COMPARISON OF SISO & MIMO TECHNIQUES IN WIRELESS COMMUNICATION
COMPARISON OF SISO & MIMO TECHNIQUES IN WIRELESS COMMUNICATIONCOMPARISON OF SISO & MIMO TECHNIQUES IN WIRELESS COMMUNICATION
COMPARISON OF SISO & MIMO TECHNIQUES IN WIRELESS COMMUNICATIONJournal For Research
 
Third Generation Wireless Modeling in Urban Environment
Third Generation Wireless Modeling in Urban EnvironmentThird Generation Wireless Modeling in Urban Environment
Third Generation Wireless Modeling in Urban EnvironmentEECJOURNAL
 
Field Acqusition Paramater Design
Field Acqusition Paramater DesignField Acqusition Paramater Design
Field Acqusition Paramater DesignAli Osman Öncel
 
A Simple, Accurate Approximation to the Sum of Gamma-Gamma variates and Appli...
A Simple, Accurate Approximation to the Sum of Gamma-Gamma variates and Appli...A Simple, Accurate Approximation to the Sum of Gamma-Gamma variates and Appli...
A Simple, Accurate Approximation to the Sum of Gamma-Gamma variates and Appli...Anax_Fotopoulos
 
A Simple, Accurate Approximation to the Sum of Gamma-Gamma variates and Appli...
A Simple, Accurate Approximation to the Sum of Gamma-Gamma variates and Appli...A Simple, Accurate Approximation to the Sum of Gamma-Gamma variates and Appli...
A Simple, Accurate Approximation to the Sum of Gamma-Gamma variates and Appli...Anax Fotopoulos
 
Error Rate Performance of Interleaved Coded OFDM For Undersea Acoustic Links
Error Rate Performance of Interleaved Coded OFDM For Undersea Acoustic LinksError Rate Performance of Interleaved Coded OFDM For Undersea Acoustic Links
Error Rate Performance of Interleaved Coded OFDM For Undersea Acoustic LinksCSCJournals
 
Design & simulation of 8 shape slotted microstrip patch antenna
Design & simulation of 8 shape slotted microstrip patch antennaDesign & simulation of 8 shape slotted microstrip patch antenna
Design & simulation of 8 shape slotted microstrip patch antennaSk Sohag
 

Semelhante a Modern Land Recording- Systems (20)

Improvement of Fading Channel Modeling Performance for Wireless Channel
Improvement of Fading Channel Modeling Performance for Wireless Channel Improvement of Fading Channel Modeling Performance for Wireless Channel
Improvement of Fading Channel Modeling Performance for Wireless Channel
 
Path inclination
Path inclinationPath inclination
Path inclination
 
Channel Overlapping Between IMT-Advanced Users and Fixed Satellite Service
Channel Overlapping Between IMT-Advanced Users and Fixed Satellite ServiceChannel Overlapping Between IMT-Advanced Users and Fixed Satellite Service
Channel Overlapping Between IMT-Advanced Users and Fixed Satellite Service
 
A Review Of Diversity Techniques For Wireless Communiation Systems
A Review Of Diversity Techniques For Wireless Communiation SystemsA Review Of Diversity Techniques For Wireless Communiation Systems
A Review Of Diversity Techniques For Wireless Communiation Systems
 
An empirically based path loss model for
An empirically based path loss model forAn empirically based path loss model for
An empirically based path loss model for
 
A045060107
A045060107A045060107
A045060107
 
A045060107
A045060107A045060107
A045060107
 
C1103031822
C1103031822C1103031822
C1103031822
 
Prediction of wireless communication systems in the context of modeling 2-3-4
Prediction of wireless communication systems in the context of modeling 2-3-4Prediction of wireless communication systems in the context of modeling 2-3-4
Prediction of wireless communication systems in the context of modeling 2-3-4
 
Jenner_ST_FB_Jan_2016
Jenner_ST_FB_Jan_2016Jenner_ST_FB_Jan_2016
Jenner_ST_FB_Jan_2016
 
Smart antennas for mobile communications
Smart antennas for mobile communicationsSmart antennas for mobile communications
Smart antennas for mobile communications
 
COMPARISON OF SISO & MIMO TECHNIQUES IN WIRELESS COMMUNICATION
COMPARISON OF SISO & MIMO TECHNIQUES IN WIRELESS COMMUNICATIONCOMPARISON OF SISO & MIMO TECHNIQUES IN WIRELESS COMMUNICATION
COMPARISON OF SISO & MIMO TECHNIQUES IN WIRELESS COMMUNICATION
 
Third Generation Wireless Modeling in Urban Environment
Third Generation Wireless Modeling in Urban EnvironmentThird Generation Wireless Modeling in Urban Environment
Third Generation Wireless Modeling in Urban Environment
 
Field Acqusition Paramater Design
Field Acqusition Paramater DesignField Acqusition Paramater Design
Field Acqusition Paramater Design
 
A Simple, Accurate Approximation to the Sum of Gamma-Gamma variates and Appli...
A Simple, Accurate Approximation to the Sum of Gamma-Gamma variates and Appli...A Simple, Accurate Approximation to the Sum of Gamma-Gamma variates and Appli...
A Simple, Accurate Approximation to the Sum of Gamma-Gamma variates and Appli...
 
A Simple, Accurate Approximation to the Sum of Gamma-Gamma variates and Appli...
A Simple, Accurate Approximation to the Sum of Gamma-Gamma variates and Appli...A Simple, Accurate Approximation to the Sum of Gamma-Gamma variates and Appli...
A Simple, Accurate Approximation to the Sum of Gamma-Gamma variates and Appli...
 
Error Rate Performance of Interleaved Coded OFDM For Undersea Acoustic Links
Error Rate Performance of Interleaved Coded OFDM For Undersea Acoustic LinksError Rate Performance of Interleaved Coded OFDM For Undersea Acoustic Links
Error Rate Performance of Interleaved Coded OFDM For Undersea Acoustic Links
 
Design & simulation of 8 shape slotted microstrip patch antenna
Design & simulation of 8 shape slotted microstrip patch antennaDesign & simulation of 8 shape slotted microstrip patch antenna
Design & simulation of 8 shape slotted microstrip patch antenna
 
Ijst 131202
Ijst 131202Ijst 131202
Ijst 131202
 
EC6651 COMMUNICATION ENGINEERING UNIT 5
EC6651 COMMUNICATION ENGINEERING UNIT 5EC6651 COMMUNICATION ENGINEERING UNIT 5
EC6651 COMMUNICATION ENGINEERING UNIT 5
 

Mais de Ali Osman Öncel

Riskli Yapılar - Çevre ve Şehircilik
Riskli Yapılar - Çevre ve ŞehircilikRiskli Yapılar - Çevre ve Şehircilik
Riskli Yapılar - Çevre ve ŞehircilikAli Osman Öncel
 
Riskli Yapılar -Çevre ve Şehircilik
Riskli Yapılar -Çevre ve ŞehircilikRiskli Yapılar -Çevre ve Şehircilik
Riskli Yapılar -Çevre ve ŞehircilikAli Osman Öncel
 
Kar Kar Geothermal Field Work
Kar Kar Geothermal Field WorkKar Kar Geothermal Field Work
Kar Kar Geothermal Field WorkAli Osman Öncel
 
High Resolution Earth's Gravitational Field
High Resolution Earth's Gravitational FieldHigh Resolution Earth's Gravitational Field
High Resolution Earth's Gravitational FieldAli Osman Öncel
 
Gravity Predictions for Earthquakes
Gravity Predictions for EarthquakesGravity Predictions for Earthquakes
Gravity Predictions for EarthquakesAli Osman Öncel
 
Nakamura Technique for Soil Characterization
Nakamura Technique for Soil CharacterizationNakamura Technique for Soil Characterization
Nakamura Technique for Soil CharacterizationAli Osman Öncel
 
Geopsy: Seismic Vibration Processing
Geopsy: Seismic Vibration ProcessingGeopsy: Seismic Vibration Processing
Geopsy: Seismic Vibration ProcessingAli Osman Öncel
 

Mais de Ali Osman Öncel (20)

APA Yazım Kuralları
APA Yazım KurallarıAPA Yazım Kuralları
APA Yazım Kuralları
 
Gravimetri : Ders 14
Gravimetri : Ders 14Gravimetri : Ders 14
Gravimetri : Ders 14
 
Gravimetri : Ders 13
Gravimetri : Ders 13Gravimetri : Ders 13
Gravimetri : Ders 13
 
Gravimetri : Ders 12
Gravimetri : Ders 12Gravimetri : Ders 12
Gravimetri : Ders 12
 
Riskli Yapılar - Çevre ve Şehircilik
Riskli Yapılar - Çevre ve ŞehircilikRiskli Yapılar - Çevre ve Şehircilik
Riskli Yapılar - Çevre ve Şehircilik
 
Riskli Yapılar -Çevre ve Şehircilik
Riskli Yapılar -Çevre ve ŞehircilikRiskli Yapılar -Çevre ve Şehircilik
Riskli Yapılar -Çevre ve Şehircilik
 
Gravimetri : Ders 07
Gravimetri : Ders 07Gravimetri : Ders 07
Gravimetri : Ders 07
 
Gravimetri : Ders 06
Gravimetri : Ders 06Gravimetri : Ders 06
Gravimetri : Ders 06
 
Gravimetri: Ders 05
Gravimetri: Ders 05Gravimetri: Ders 05
Gravimetri: Ders 05
 
Gravimetri : Ders 04
Gravimetri : Ders 04Gravimetri : Ders 04
Gravimetri : Ders 04
 
Gravimetri : Ders 03
Gravimetri : Ders 03Gravimetri : Ders 03
Gravimetri : Ders 03
 
Gravimetri Ders 02
Gravimetri Ders 02Gravimetri Ders 02
Gravimetri Ders 02
 
Gravimetri Ders 01
Gravimetri Ders 01Gravimetri Ders 01
Gravimetri Ders 01
 
Kar Kar Geothermal Field Work
Kar Kar Geothermal Field WorkKar Kar Geothermal Field Work
Kar Kar Geothermal Field Work
 
Beppu geothermal field
Beppu geothermal fieldBeppu geothermal field
Beppu geothermal field
 
High Resolution Earth's Gravitational Field
High Resolution Earth's Gravitational FieldHigh Resolution Earth's Gravitational Field
High Resolution Earth's Gravitational Field
 
Gravity Predictions for Earthquakes
Gravity Predictions for EarthquakesGravity Predictions for Earthquakes
Gravity Predictions for Earthquakes
 
Nakamura Technique for Soil Characterization
Nakamura Technique for Soil CharacterizationNakamura Technique for Soil Characterization
Nakamura Technique for Soil Characterization
 
H/V User Guidelines
H/V User Guidelines H/V User Guidelines
H/V User Guidelines
 
Geopsy: Seismic Vibration Processing
Geopsy: Seismic Vibration ProcessingGeopsy: Seismic Vibration Processing
Geopsy: Seismic Vibration Processing
 

Último

Nutritional Needs Presentation - HLTH 104
Nutritional Needs Presentation - HLTH 104Nutritional Needs Presentation - HLTH 104
Nutritional Needs Presentation - HLTH 104misteraugie
 
Kisan Call Centre - To harness potential of ICT in Agriculture by answer farm...
Kisan Call Centre - To harness potential of ICT in Agriculture by answer farm...Kisan Call Centre - To harness potential of ICT in Agriculture by answer farm...
Kisan Call Centre - To harness potential of ICT in Agriculture by answer farm...Krashi Coaching
 
CARE OF CHILD IN INCUBATOR..........pptx
CARE OF CHILD IN INCUBATOR..........pptxCARE OF CHILD IN INCUBATOR..........pptx
CARE OF CHILD IN INCUBATOR..........pptxGaneshChakor2
 
Presentation by Andreas Schleicher Tackling the School Absenteeism Crisis 30 ...
Presentation by Andreas Schleicher Tackling the School Absenteeism Crisis 30 ...Presentation by Andreas Schleicher Tackling the School Absenteeism Crisis 30 ...
Presentation by Andreas Schleicher Tackling the School Absenteeism Crisis 30 ...EduSkills OECD
 
1029-Danh muc Sach Giao Khoa khoi 6.pdf
1029-Danh muc Sach Giao Khoa khoi  6.pdf1029-Danh muc Sach Giao Khoa khoi  6.pdf
1029-Danh muc Sach Giao Khoa khoi 6.pdfQucHHunhnh
 
Measures of Central Tendency: Mean, Median and Mode
Measures of Central Tendency: Mean, Median and ModeMeasures of Central Tendency: Mean, Median and Mode
Measures of Central Tendency: Mean, Median and ModeThiyagu K
 
Grant Readiness 101 TechSoup and Remy Consulting
Grant Readiness 101 TechSoup and Remy ConsultingGrant Readiness 101 TechSoup and Remy Consulting
Grant Readiness 101 TechSoup and Remy ConsultingTechSoup
 
Sanyam Choudhary Chemistry practical.pdf
Sanyam Choudhary Chemistry practical.pdfSanyam Choudhary Chemistry practical.pdf
Sanyam Choudhary Chemistry practical.pdfsanyamsingh5019
 
Student login on Anyboli platform.helpin
Student login on Anyboli platform.helpinStudent login on Anyboli platform.helpin
Student login on Anyboli platform.helpinRaunakKeshri1
 
Contemporary philippine arts from the regions_PPT_Module_12 [Autosaved] (1).pptx
Contemporary philippine arts from the regions_PPT_Module_12 [Autosaved] (1).pptxContemporary philippine arts from the regions_PPT_Module_12 [Autosaved] (1).pptx
Contemporary philippine arts from the regions_PPT_Module_12 [Autosaved] (1).pptxRoyAbrique
 
Software Engineering Methodologies (overview)
Software Engineering Methodologies (overview)Software Engineering Methodologies (overview)
Software Engineering Methodologies (overview)eniolaolutunde
 
Mastering the Unannounced Regulatory Inspection
Mastering the Unannounced Regulatory InspectionMastering the Unannounced Regulatory Inspection
Mastering the Unannounced Regulatory InspectionSafetyChain Software
 
Organic Name Reactions for the students and aspirants of Chemistry12th.pptx
Organic Name Reactions  for the students and aspirants of Chemistry12th.pptxOrganic Name Reactions  for the students and aspirants of Chemistry12th.pptx
Organic Name Reactions for the students and aspirants of Chemistry12th.pptxVS Mahajan Coaching Centre
 
Introduction to ArtificiaI Intelligence in Higher Education
Introduction to ArtificiaI Intelligence in Higher EducationIntroduction to ArtificiaI Intelligence in Higher Education
Introduction to ArtificiaI Intelligence in Higher Educationpboyjonauth
 
The basics of sentences session 2pptx copy.pptx
The basics of sentences session 2pptx copy.pptxThe basics of sentences session 2pptx copy.pptx
The basics of sentences session 2pptx copy.pptxheathfieldcps1
 
Beyond the EU: DORA and NIS 2 Directive's Global Impact
Beyond the EU: DORA and NIS 2 Directive's Global ImpactBeyond the EU: DORA and NIS 2 Directive's Global Impact
Beyond the EU: DORA and NIS 2 Directive's Global ImpactPECB
 
Q4-W6-Restating Informational Text Grade 3
Q4-W6-Restating Informational Text Grade 3Q4-W6-Restating Informational Text Grade 3
Q4-W6-Restating Informational Text Grade 3JemimahLaneBuaron
 
Interactive Powerpoint_How to Master effective communication
Interactive Powerpoint_How to Master effective communicationInteractive Powerpoint_How to Master effective communication
Interactive Powerpoint_How to Master effective communicationnomboosow
 

Último (20)

Nutritional Needs Presentation - HLTH 104
Nutritional Needs Presentation - HLTH 104Nutritional Needs Presentation - HLTH 104
Nutritional Needs Presentation - HLTH 104
 
Kisan Call Centre - To harness potential of ICT in Agriculture by answer farm...
Kisan Call Centre - To harness potential of ICT in Agriculture by answer farm...Kisan Call Centre - To harness potential of ICT in Agriculture by answer farm...
Kisan Call Centre - To harness potential of ICT in Agriculture by answer farm...
 
CARE OF CHILD IN INCUBATOR..........pptx
CARE OF CHILD IN INCUBATOR..........pptxCARE OF CHILD IN INCUBATOR..........pptx
CARE OF CHILD IN INCUBATOR..........pptx
 
Presentation by Andreas Schleicher Tackling the School Absenteeism Crisis 30 ...
Presentation by Andreas Schleicher Tackling the School Absenteeism Crisis 30 ...Presentation by Andreas Schleicher Tackling the School Absenteeism Crisis 30 ...
Presentation by Andreas Schleicher Tackling the School Absenteeism Crisis 30 ...
 
TataKelola dan KamSiber Kecerdasan Buatan v022.pdf
TataKelola dan KamSiber Kecerdasan Buatan v022.pdfTataKelola dan KamSiber Kecerdasan Buatan v022.pdf
TataKelola dan KamSiber Kecerdasan Buatan v022.pdf
 
1029-Danh muc Sach Giao Khoa khoi 6.pdf
1029-Danh muc Sach Giao Khoa khoi  6.pdf1029-Danh muc Sach Giao Khoa khoi  6.pdf
1029-Danh muc Sach Giao Khoa khoi 6.pdf
 
Measures of Central Tendency: Mean, Median and Mode
Measures of Central Tendency: Mean, Median and ModeMeasures of Central Tendency: Mean, Median and Mode
Measures of Central Tendency: Mean, Median and Mode
 
Grant Readiness 101 TechSoup and Remy Consulting
Grant Readiness 101 TechSoup and Remy ConsultingGrant Readiness 101 TechSoup and Remy Consulting
Grant Readiness 101 TechSoup and Remy Consulting
 
Sanyam Choudhary Chemistry practical.pdf
Sanyam Choudhary Chemistry practical.pdfSanyam Choudhary Chemistry practical.pdf
Sanyam Choudhary Chemistry practical.pdf
 
Student login on Anyboli platform.helpin
Student login on Anyboli platform.helpinStudent login on Anyboli platform.helpin
Student login on Anyboli platform.helpin
 
Contemporary philippine arts from the regions_PPT_Module_12 [Autosaved] (1).pptx
Contemporary philippine arts from the regions_PPT_Module_12 [Autosaved] (1).pptxContemporary philippine arts from the regions_PPT_Module_12 [Autosaved] (1).pptx
Contemporary philippine arts from the regions_PPT_Module_12 [Autosaved] (1).pptx
 
Software Engineering Methodologies (overview)
Software Engineering Methodologies (overview)Software Engineering Methodologies (overview)
Software Engineering Methodologies (overview)
 
Mastering the Unannounced Regulatory Inspection
Mastering the Unannounced Regulatory InspectionMastering the Unannounced Regulatory Inspection
Mastering the Unannounced Regulatory Inspection
 
Organic Name Reactions for the students and aspirants of Chemistry12th.pptx
Organic Name Reactions  for the students and aspirants of Chemistry12th.pptxOrganic Name Reactions  for the students and aspirants of Chemistry12th.pptx
Organic Name Reactions for the students and aspirants of Chemistry12th.pptx
 
Introduction to ArtificiaI Intelligence in Higher Education
Introduction to ArtificiaI Intelligence in Higher EducationIntroduction to ArtificiaI Intelligence in Higher Education
Introduction to ArtificiaI Intelligence in Higher Education
 
The basics of sentences session 2pptx copy.pptx
The basics of sentences session 2pptx copy.pptxThe basics of sentences session 2pptx copy.pptx
The basics of sentences session 2pptx copy.pptx
 
Beyond the EU: DORA and NIS 2 Directive's Global Impact
Beyond the EU: DORA and NIS 2 Directive's Global ImpactBeyond the EU: DORA and NIS 2 Directive's Global Impact
Beyond the EU: DORA and NIS 2 Directive's Global Impact
 
Q4-W6-Restating Informational Text Grade 3
Q4-W6-Restating Informational Text Grade 3Q4-W6-Restating Informational Text Grade 3
Q4-W6-Restating Informational Text Grade 3
 
Interactive Powerpoint_How to Master effective communication
Interactive Powerpoint_How to Master effective communicationInteractive Powerpoint_How to Master effective communication
Interactive Powerpoint_How to Master effective communication
 
Staff of Color (SOC) Retention Efforts DDSD
Staff of Color (SOC) Retention Efforts DDSDStaff of Color (SOC) Retention Efforts DDSD
Staff of Color (SOC) Retention Efforts DDSD
 

Modern Land Recording- Systems

  • 1. 888 The Leading Edge July 2008 Modern land recording systems: How do they weigh up? As hydrocarbons are becoming more difficult to find and to produce, operators who utilize relevant advanced technology have a clear advantage. What is not always clear is which advanced technology is relevant or applicable in a given situation. If we look at developments in land 3D seismic surveying over the last few years, we see a dramatic increase in the capabilities of the equipment being used and also innovative methods of its usage. We have seen significant increases in the trace densities of surveys and the recording intervals have been decreasing accordingly, but at what trace interval do we cease using geophone arrays and start using point receivers? Should these receivers be vertical component (1-C) sensors or multicomponent (3-C)? Should we use capacitance-basedMEMSsensorsorinduction-basedmoving- coil geophones? Finally, advances in electronic systems now permit recording data without the use of telemetry cables— either by transmitting the data back to the recording truck by radio for quality control purposes and immediate storage on tape or discs or by storing it locally at the receiver for later recovery. Are there circumstances where there is a significant benefit from the utilization of a cable-less system as opposed to one with cables? This paper will discuss some geophysical and operational factors related to these questions. MALCOLM LANSLEY, Sercel, Houston, USA MIKE LAURIN, CGGVeritas SHUKI RONEN, Chevron, San Ramon, USA SPECIAL SECTION: S e i s m i c a c q u i s i t i o n Geophysical considerations (data quality) The signal-to-noise ratio is how most geophysicists evaluate the quality of a seismic survey. When considering the use of point receivers instead of geophone arrays, it is very im- portant to remember that there is both a numerator (signal) and a denominator (noise). It is important to understand the characteristics of the signals that we wish to preserve and the noises that we wish to attenuate. Is the desired signal from a relatively strong, shallow reflector that we can expect to record with high frequencies and broad bandwidth, or is it from a deep formation with a weak reflection coefficient and correspondingly lower energy? If the latter, can we expect a single point sensor to give us the same signal strength as a well-planted array of 12 or more geophones? Is the noise primarily random ambient noise (wind, rain, etc.), or is it coherent source-generated (e.g., ground roll), scattered source-generated, or perhaps a combination of all three? Although random noise may be attenuated very well by the use of higher-trace density surveys, geophone arrays may still offer an advantage in areas with very high random noise levels. However, for ground roll, we cannot deploy geophones arrays that are sufficiently long to attenuate the noise wave- lengths without also suffering significant signal attenuation, Figure 1. Shot record with 12 vertical geophones per group (left); single-sensor vertical component DSU MEMS before polarization filters (center) and after such filtering (right). Polarization filters use the data from the horizontal components to attenuate noise on the vertical component. Other methods (not shown here) are used to attenuate noise on 1-C data. Comparing the data from the geophone groups to the single- sensor MEMS, it is evident that the single-sensor data are noisier but also contain more signal especially in the high frequencies.
  • 2. July 2008 The Leading Edge 889 the three geophones, together with the operational difficulties of leveling and aligning them (Lansley et al., 1998) and channel-capacity limitations of the old recording systems, result in costly data acquisition; hence, the use of multicomponent surveys has been limited. In recent year, the introduc- tion of digital MEMS sensors and very high channel-count recording systems has eliminated the weight and level- ing problems. Yet we still do not see widespread recording of 3-C surveys, except in a few areas. Why? If we again consider the question of arrays versus point receivers, it is necessary to un- derstand that, due to the digital nature of their electronics, MEMS sensors cannot be connected in arrays to per- form electrical summation in the same way as analog sensors. Therefore, in or- der to record 3-C data with MEMS, we are automatically recording with a point receiver or single sensors. Single sensors eliminate intra-array statics and the effects of differential NMO, and MEMS have a wider fre- quency band and do not have high-fre- quency spurious noise. Therefore, they provide better signal than geophone groups, with improved resolution and mul- ticomponent data, and they also provide more random and coherent noise. This increased noise with single sensors must be compensated by increased data density and more sophis- ticated data processing. It is also apparent that getting the full value from analysis of shear waves is more difficult than actually acquiring multicomponent data (Mattocks et al., 2005; Roche et al., 2006). In order to deliver the same final data quality as is recorded with geophone arrays, surveys with single sensors typically require smaller station intervals. We have found that single-sensor intervals must be, at most, half of geophone group intervals. Figures 2-4 show one example of 3D data from the United States in which single sensors, with an interval of 110 ft, provided similar final data quality to groups of six geophones at 220 ft. In this example, a small 3D survey was recorded with the following parameters. Receiver lines were oriented NS with a nominal line interval of 1650 ft. Production geophone arrays with six geophones per group were planted along the receiver lines at an interval of 220 ft. In the center of the survey area, an embedded test, consisting of 544 additional MEMS 3-C single sensors, was planted along seven of the receiver lines (red in Figure 2). These single sensors were spaced at an in- terval of 110 ft so that alternate receivers were aligned with the centers of the production geophone groups and the others were midway between. Sources were aligned primarily EW with a nominal line spacing of 2420 ft. The source-point in- terval was 330 ft and 1266 explosive shot points were drilled S e i s m i c a c q u i s i t i o n particularly on shallow, high-frequency reflections. There are two solutions for attenuating coherent noise such as ground roll. One solution is to reduce the station interval to less than half a wavelength of the ground roll so that f-k filters can be used. This is very expensive, no matter what type of sensors are used. Ground-roll wavelengths can be less than 20 m and the implied 10-m station interval may be prohibitively ex- pensive. In 3D we have to provide sampling in the crossline as well as in the inline direction. In 3D, ground roll can be sampled and attenuated by f-k-k filters only at great cost due to increased receiver and source effort. The other solution is polarization filters as described by a number of authors in- cluding de Meersman and Kendall (2005). Polarization filters use the data recorded on the horizontal components to at- tenuate ground roll on the vertical component and vice-versa. Figure 1 shows a data example from the Green River Basin, Wyoming (Ronen et al., 2005.) This comparison is between data recorded using linear arrays of 12 geophones and single 3-C digital sensors with half the receiver spacing. The single sensors are shown without and with polarization filtering. In this case there is a significant advantage to recording all three components of the ground motion to attenuate the ground roll. The data on the right clearly show a strong reduction in the amplitudes of the ground roll and much better signal continuity. Multicomponent (3-C) recording has been conducted on land since the 1970s. For many years analog moving-coil geo- phones were used, either in arrays or individually, in conjunc- tion with conventional data recording systems. The weight of Figure 2. Location map of the receiver spread (in a circle) and two shots, one at the center of the spread and one outside.
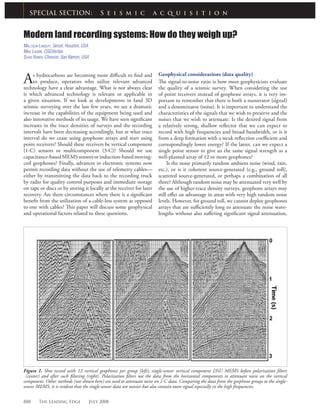
  • 3. 890 The Leading Edge July 2008 S e i s m i c a c q u i s i t i o n Figure 3. (a) Geophone groups data. (b) Single-sensor MEMS data. Two shot profiles with different offset ranges are shown for each data set. Bandpass filter (8-12-80-100) and 1000-ms AGC. The geophones in groups of six have an advantage in signal/noise as can be seen, for example, on the reflector at 1.2 and 1.5 s two-way traveltime.
  • 4. 892 The Leading Edge July 2008 ter than the single sensors and vice versa. In general, the geo- phone data are marginally better in the deep section and the MEMS data better at shallow depths. Since the single sensors were recorded with finer spatial sampling, this agrees quite well with what we expect. Note, however, that the single- sensor data were recorded with half the receiver interval (i.e., twice the trace density) of the geophone group data. A few years ago, acquisition systems were limited by chan- nel count and reducing the receiver interval and recording 3-C was not practical. Fortunately, channel counts are no longer an issue because modern systems have a capability of 100 000 channels in real time at a sampling rate of 2 ms. Of course, although the recording of the seismic data with most of the cable-less systems is in real time, the actual data recovery for transfer to data processing and long-term storage is not. In fact, data recovery and, hence, data processing may be delayed significantly depending upon weather and other operational issues. The geophysical considerations relevant to comparing cable to cable-less systems are less obvious. The same receivers can be connected to either system. However, one big advan- tage of cable telemetry is improved field QC with better mon- itoring of noise levels and early detection of poor coupling. Operational considerations (time and money) The potential operational advantage of systems without ca- and recorded simultaneously by both the production geo- phone arrays and the single sensors. This enables comparison of the different sensors to be made on single-fold shot records and migrated data. Two shot records (locations shown in Figure 2) are com- pared in Figure 3. Figure 3a shows the data recorded by the production groups of six geophones and Figure 3b that from the single sensors. Both data sets are displayed with the same filter and 1000-ms AGC scaling. Since the MEMS sensors (Figure 3b) are recording acceleration and also have a much wider bandwidth than the geophones, these data have been integrated to velocity and match-filtered to simulate the low-frequency response of the geophones. The single-sensor MEMS data are decimated to the same trace spacing as the regular geophone groups for comparison purposes. Note that the reflections on the MEMS data compare very well with the geophone data after integration (from acceleration to ve- locity) and match-filtering to simulate the low-frequency re- sponse of the geophones. Also, more high-frequency noise is visible before the first breaks and on the deeper data. Figure 4 is the comparison after 3D migration. The MEMS data were processed using all of the data all of the way through the data processing, but were decimated to the same trace interval after migration for comparison purposes. Overall, the signal-to-noise ratio is very comparable. There are some places where geophone groups look marginally bet- S e i s m i c a c q u i s i t i o n Figure 4. Cross-sections from the conventional geophone groups data (left) and MEMS single-sensor data (right) after migration. The MEMS single-sensor data have been decimated after migration to the same bin size for display. It therefore has the signal/noise benefit of having been re- corded with twice the data density. In areas of complex geology, the benefit of the finer spatial sampling would be more visible. The factor two in fold more or less compensated for the factor six in groups versus single sensors.
  • 5. July 2008 The Leading Edge 893 agement, and source/spread manage- ment. As discussed earlier, when using point receivers, the trace density is typically doubled in order to provide a similar signal-to-random-noise ratio as would be achieved when using ar- rays of six geophones. Therefore, when considering equipment weight, this factor needs to be comprehended. Fig- ure 5 shows the approximate weight relationship between three different recording scenarios: a cable system with arrays of six geophones, a cable system with 3-C digital point receiv- ers, and a cable-less system also using 3-C digital point receivers. The total weights shown are for a 10 ϫ 10-km square spread with 400-m receiver line interval plotted against receiver station interval. (For these weight compari- sons, the choice of cable and the ac- tual cable length between takeouts are very important. The cable used in these graphs is that recommended by Sercel for 3-C single sensor deployment with a weight of 47 kg/km.) The length of cable between takeouts is equal to the group interval plus 5 m for group in- tervals of 20 m and larger and group interval plus 3 m for intervals less than 20 m. For the cable system shown, the weight of all ground equipment nec- essary for data recording is included: transverse cables, crossline telemetry boxes, batteries, etc. There is a signifi- cant weight advantage to using the dig- ital 3-C sensors, even when the record- ing group interval is halved as shown on the graph. This is due to the large difference in weight between a string of six geophones (3.3 kg, not including digitizer) and the weight of one of the equivalent two 3-C digital sensors (2 ϫ 0.5 kg including digitizer). What is also apparent is that, for large group in- tervals (coarse spatial sampling), there may be a slight weight advantage for the system without cables. However, as the industry moves to higher and higher trace densities and finer spatial sampling, the weight advantage moves in favor of the cable system. If we compare systems with 3-C digital sensors, the crossover between cable and cable-less systems is at approximately 50 m (or ~165 ft.) Figure 6 shows an alternative view of the same informa- tion where the weight per 3-C digital sensor station is plotted against the group interval. Here the advantage of a cabled bles is in areas with limited access or on surveys where the re- ceiver station interval is large. Cable-based systems have op- erational advantages where cables can be deployed, receiver station intervals are small and they also have the geophysical advantage of improved field QC. The most important factors that govern the operational and recording efficiency are: equipment weight, power con- sumption of the ground electronics, battery and power man- Figure 6. Weight per receiver position, calculated from the total weight of all required ground equipment divided by the number of receiver positions. Figure 5. Total ground equipment weight as a function of receiver interval for a 10 × 10-km recording spread with 400-m receiver line interval. All necessary equipment, including transverse data transmission cables, boxes and batteries, is incorporated. S e i s m i c a c q u i s i t i o n
  • 6. 894 The Leading Edge July 2008 S e i s m i c a c q u i s i t i o n system is clearly apparent as the receiver station interval is reduced. Since different cable-less systems have different ca- pabilities (e.g., 1-C versus 3-C, analog sensors versus digital MEMS) and different power consumption, it is difficult to make direct comparisons. However, understanding the power consumption and the corresponding battery requirements for each type and make of receiver station will provide a good estimate of the weight per receiver position. Comparison with the weight of a cable system, such as shown in Figure 6, will then provide a better understanding of the relative merits of one system versus another in any given situation. Power consumption and battery management are obvi- ously related and the lower the power consumption of the ground electronics the better. Although some battery types may have very good power-to-weight ratios, initial and re- placement cost may be significantly higher. Low temperatures also affect battery life and some types (e.g., lithium-ion) may not be very well suited to such environments. When we con- sider the number of batteries deployed within an active re- cording spread, with the cable-less system we have at least as many batteries as receiver points, which today may range from 5000 to 50 000. For battery charging and management, an additional 50% is often necessary to ensure an adequate supply of fully charged batteries. With a cable system, the number of batteries per line is typically divided by 30-40, which becomes much more manageable. Although each in- dividual battery may be heavier, the type can be selected to be appropriate for the operating environment and the man- agement and recharging is much easier. Another issue that is of concern for land surveys is whether the seismic source is explosives or vibrators. For explosive surveys, the recording time can be minimized by the use of several shooters and care- ful management of the operations. Hence the battery life can be optimized and may allow the deployed battery to remain in the field until the station is picked up and rolled to the next location. However, for vibrator recording the operations are normally continuous and therefore require the recording system to be active continuously. This increased recording time means that most cable-less systems do not have adequate battery life and will require battery replacement during the time that the units are deployed at one receiver location. If we consider a recording spread with 10 000 or more active receiver locations, that is a very large number of batteries to recharge and replace. Modern high channel-count recording systems incorpo- rate very efficient source and receiver spread management tools that enable source-controlled shooting to be effectively implemented. These, together with the real-time verification of data quality, can ensure that these high-density multicom- ponent surveys meet the desired objectives. Conclusions High-quality, high-density, multicomponent 3D surveys are being acquired very cost-effectively using single sensors. The receiver station interval (hence trace density) needs to be ad- justed to compensate for the increased random noise that will be recorded with single sensors. We have found that two 3-C digital MEMS sensors are typically required to replace an array of six geophones. In areas with weak reflection strength or poor signal-to-noise ratio, where arrays with more than six geophones are frequently used, the number of single sensors may need to be increased even more to ensure that adequate signal strength is being recorded. Despite this improved spa- tial sampling, there is still a considerable reduction in the weight of the ground equipment being deployed with a corre- sponding improvement in operational efficiency. When com- pared with the historical average recording production over several prior recording seasons in the same area, statistics from a number of large, Canadian, single-sensor surveys with more than 170 500-receiver locations showed an increase of better than 40% in the layout and pickup of the recording equipment. A remarkable increase of more than 45% in the number of shots recorded per day was also observed. In areas with difficult access and/or high population den- sities, such as cities, there will be a benefit in using cable-less systems. For low trace density, coarsely sampled 3D surveys with large receiver-station intervals, there will also be a slight weight advantage in recording without cables. However, as the spatial sampling becomes smaller and the trace density greater, significant operational and recording efficiency ben- efits are gained using cables. Uncommitted systems that offer the flexibility to use either cables, or cable-less technology, or a combination of both within the recording spread will per- mit recording optimization under all conditions. Suggested reading. “Multicomponent 3D seismic pilot study in the Orinoco heavy oil belt” by Lansley et al. (SEG 1998 Expanded Abstracts). “A complex SVD-polarization fil- ter for ground-roll attenuation on multicomponent data” by de Meersman and Kendall (EAGE 2005 Extended Abstracts). “Multicomponent seismic in rough terrain: an example from Wyoming Green River basin” by Ronen et al. (SEG 2005 Expanded Abstracts). More general reading on some of the additional benefits of 3-C recording may be found in “Pre- diction of shale plugs between wells in heavy oil sands using seismic attributes” by Gray et al. (Natural Resources Research, 2006); “Converted-wave azimuthal anisotropy in a carbon- ate foreland basin” by Mattocks et al. (SEG 2005 Expanded Abstracts) and “Delineating reservoir sands using PP and PS seismic data” by Roche et al. (EAGE 2006 Extended Ab- stracts). Acknowledgements. The authors thank an anonymous client for permission to show results using their data shown in Figures 2–4. We also thank ExxonMobil for their support in the recording, processing, and analysis of the data shown in Figure 1. Thanks also to CGGVeritas and Sercel for their support during the preparation of this paper. Shuki Ronen was employed by CGGVeritas at the time this article was authored. Corresponding author: malcolm.lansley@sercel.com