

Recomendados
Mais conteúdo relacionado
Mais procurados
Mais procurados (20)
Destaque
Destaque (12)
Semelhante a Uml Diagrams
Semelhante a Uml Diagrams (20)
Último
Último (20)
Uml Diagrams
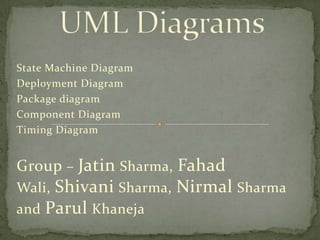
- 1. State Machine Diagram Deployment Diagram Package diagram Component Diagram Timing Diagram Group – Jatin Sharma, Fahad Wali, Shivani Sharma, Nirmal Sharma and Parul Khaneja
- 2. Its Unified Modeling Language used to prepare blue prints of software What is UML Diagrams?????? They use various notations to specify the syntax of the construct. UML notations specify how to depict the user or the classes and interface of the system.
- 3. State machine describes the different states of a component in its life cycle. The notations are described in the following diagram.
- 4. The various constituents of state Machine diagram are: 1. State Machines 2. Transitions 3. Events Advance feature of state machine are Entry and Exit actions. Activities. Internal transition. Substate Deferred events
- 5. Identify the collaboration for a system, class or use case. Identify the start and end states for each object. Identify the stable states of each object. Identify the events that cause a transition in the state of an object. Associate actions to each transition and state. Use the sequential and concurrent states to simplify the state diagrams.
- 6. Deployment diagrams are used to describe the static deployment view of a system. Deployment diagrams consist of nodes and their relationships. Purpose: The purpose of deployment diagrams can be described as: 1. Visualize hardware topology of a system. 2. Describe the hardware components used to deploy software components. 3. Describe runtime processing nodes. Consider the Deployment Diagram of an order management system on the next slide.
- 8. Deployment diagrams are mainly used by system engineers. Usage of deployment diagrams can be described as: To model the hardware topology of a system. To model embedded system. To model hardware details for a client/server system. To model hardware details of a distributed application. Forward and reverse engineering.
- 9. Packages diagrams are used to group the related constituents of a software system. Advantages of using packages to model the constituents of a software system are: Enables visualizing the functional groups and the relationships among them. Facilitates easy management of large software systems.
- 10. Symbols used to set the visibility of constituents in packages are: +: Indicates that the constituents is public , accessible to the constituents of other packages. #: Indicates that the constituents is protected, accessible to the constituents that inherit it. - : Indicates that the constituents is private , accessible to the constituents outside the package.
- 12. Component diagrams are used to model the various components required for a system execute. Purpose: 1. Visualize the components of a system. 2. Construct executables by using forward and reverse engineering. 3. Describe the organization and relationships of the components. Consider the Component Diagram of an order management system on the next slide.
- 14. Component diagrams are used to visualize the static implementation view of a system. Usage of component diagrams can be described as: Model the components of a system. Model database schema. Model executables of an application. Model system's source code.
- 15. It is a specific type of Interaction Diagram. They are used to represent the changes in state and value of one or more objects over a period of time.
- 16. A value lifeline is used to represent the changes in the value of objects over a period of time.
- 17. A state lifeline is used to represent the changes in state of objects over a period of time.