SlideShare uma empresa Scribd logo
1 de 6
Baixar para ler offline
P.Divya, P. Ramesh Kumar / International Journal of Engineering Research and Applications
                 (IJERA)                ISSN: 2248-9622       www.ijera.com
                    Vol. 2, Issue 5, September- October 2012, pp.2100-2105
      The Investment Portfolio Selection Using Fuzzy Logic And
                        Genetic Algorithm
                                     P.Divya1, P. Ramesh Kumar2
                           1
                             student, Department Of Cse, Vrsiddhartha Engineering College
                 2
                     sr. Assistant Professor, Department Of Cse, Vrsiddhartha Engineering College


ABSTRACT
         The selection of a portfolio encounters              annual profitability, being for the portfolio the
several extremely complex situations. From                    weighted average of each asset profitability times
among them, it has to be highlighted, due to its              the asset investment risk. The latter indicates how
difficulty and transcendence, the Financial Assets            the financial investment has varied regarding the
selection when interrelations (positive and/or                average of the past data analysis. Thus, when a
negative)      occur    among     the    expected             portfolio has to be managed, the decision maker will
profitabilities of each one of them. To solve this            have to choose those investments maximizing their
Genetic Algorithms are used due to its utility                profitability with the minimum possible risk. when
when offering solutions to complex optimization               several investments are brought together into the
problems. Furthermore, by using the Fuzzy                     same portfolio, the assumed risk does not
Logic, we intend to obtain a closer representation            correspond, except for a few given cases, with the
for the uncertainty that characterises Financial              weighted average of each one of the investments
Market. This way, it is intended to outline an                risk. The idea of correlation between the different
approach to solve Financial Assets selection                  financial assets profitabilities emerges here and,
problems for a portfolio in a non-linear and                  therefore, it raises the portfolio risk reduction
uncertainty environment, by applying a Fuzzy                  through diversification.
logic and Genetic Algorithm to optimize the                             The risk that can be eliminated through
investment profitability.                                     diversification is called specific risk. Its reason
                                                              d’être is based in the fact that many of the threats
Keywords - financial assets, decision making,                 surrounding a given firm stem out from the own
portfolio analysis, fuzzy logic, genetic algorithms.          firm and, perhaps, from its immediate competitors.

1. INTRODUCTION                                                         There is also a risk, called market risk, that
         In this essay we introduce a new approach            cannot be avoided, no matter how much it is
to improve the selection of a portfolio. First of all,        diversified. This market risk arises from the fact that
we present the traditional approach to portfolio              there are other perils in the Economy as a whole
management. Second, we explain a new approach to              threatening all the business. This is the reason why
the problem that considers the use of fuzzy logic.            investors are exposed to the uncertainties of the
After that, we introduce the application of Genetic           market, no matter how many shares they hold.
Algorithms to optimize the expected return from the                     Once exposed the reasons to have a
portfolio with fuzzy information. At the end of the           diversified investment portfolio in which maximum
paper we include an example of the problems that              synergies among assets are obtained, the arising
could be solved with. Finally, in the last section of         question is how to achieve that portfolio. The first
the paper we suggest some conclusions and future              contribution in this field was made by Markowitz
developments..                                                (1952), who proposed a investment portfolio
                                                              evaluation method based on risk and profitability
2. TRADITIONAL APPROACH                            TO         analysis. According to him, every investor facing
                                                              two portfolios with the same risk will choose the
PORTFOLIO MANAGEMENT
                                                              one with the bigger profitability, and facing two
          The concept of Portfolio Analysis spreads
                                                              portfolios with the same profitability will choose the
from the financial area. A financial investment does
                                                              one minimising the risk. It is intended to obtain the
not usually have a constant profitability, except for a
                                                              optimum decision in the selection of the financial
few exceptions, but changes according to certain
                                                              assets.
variables. This variability determines the investment
                                                                        The different methods consist basically, of
risk, so the bigger risk investment have the higher
                                                              three stages. The first one deals with determining all
profitability opportunities, in most of cases.
                                                              the available financial assets and, subsequently,
          Traditionally, the measures used to valuate
                                                              generating every possible portfolio from these
a portfolio profitability and risk are the arithmetic
                                                              elements. In the second stage the efficient portfolios,
mean and the standard deviation of the different
                                                              that is, those not dominated by others, are selected
financial assets. The former shows the average

                                                                                                    2100 | P a g e
P.Divya, P. Ramesh Kumar / International Journal of Engineering Research and Applications
                 (IJERA)                ISSN: 2248-9622       www.ijera.com
                    Vol. 2, Issue 5, September- October 2012, pp.2100-2105
using some rules, such as the Mean-Variance or the
Stochastic Dominance Then, in the third one, the
optimum portfolio is chosen among them. This final
decision is proposed in this method as purely
intuitive.

3. A NEW APPROACH TO PORTFOLIO
MANAGEMENT
          This paper endeavours to find a
representation of the available information in the
financial market , as reliable as possible, since using
both mean and standard deviation as indicators for
investment profitability and risk, may bring out
inefficient decisions. With this, it’s not intended to
suggest their non-validity but, in addition to the
information supplied by those indicators, the
investor can complete his knowledge of the financial       Figure 1
market with other sources. In particular, it all deals
with including estimates from market behaviour                       A TFN has four points that represent or
experts, economic variables forecasts that can             define it; in Figure 1 they are: a1 , a2 , a3 , a4 . So,
determine the financial assets behaviour through the       a TFN can be represented in a quaternary way:
sensibility they show towards them, government             Ã = ( a1 , a2 , a3 , a4 ) with a1 , a2 , a3 , a4 ∈ ℜ
policies, business strategies, etc., or even it may be     and a1 ≤ a2 ≤ a3 ≤ a4
considered subjective aspects such as the broker’s         These four numbers involve that:
accuracy when focusing a certain portfolio on              ∀ x ≤ a1           μ(x) =0
determined financial assets. With this it is aimed to      ∀ x ≥ a4            μ(x) =0
include both objective and subjective criteria,            ∀ a2 ≤x ≤ a3        μ(x) =1
provided by the financial market itself. On the other      and that function μ(x) for the remaining values is the
hand, as an additional element to this set of issues, it   line that joins point ( a1 , 0) with point ( a2 ,1), and
has to be highlighted a relation or interconnection        the line joining point ( a3 , 1) with ( a4 , 0).
among the available financial assets. This fact is due     Consequently, a TFN membership function, can be
to synergies existing among them, that cause               noted as follow:
changes in profitability because of certain situations,
such as modifications in share prices of the
enterprises depending on the same economic
variables, joint ventures, shares of enterprises whose
profitability is interfered with a certain currency
price, fixed interest investments depending on the
interest rate set by each country’s Central Bank, etc.
In order to fit all the available information together
it is proposed to use the Fuzzy logic, since as a
mathematics branch dealing with objective and
subjective matters, it attempts to take a phenomenon                 The very conceptualisation of TFN allows
as presented in reality, and handle it to make it          a good suitability to different real situations,
certain or accurate.                                       particularly to economic and entrepreneurial
          The reason to use logic and fuzzy                estimates. Thus, for instance, the expected return for
technology is based in author’s perception that,           a financial asset in a given period of time can be
since portfolio selectors realise that their               established as:
environment and, therefore, the information they           R = (4%; 5,5%; 6%; 8%)
handle, is uncertain and diffuse, it seems obvious                   which means that, the profitability of this
they prefer realistic representations rather than just     asset will be at least four percent, that it is likely to
models assumed to be exact.                                be between five point five and six percent and that it
          The decision help system supported by            will not be higher than eight percent. This way, not
Trapezoidal Fuzzy Numbers (TFN) is used to                 only the expected profitability can be represented,
represent uncertain values of the different variables.     but also the risk run when investing in a financial
The membership functions that define then, μ(x), are       asset, for in that TFN it is represented the whole set
linear, as shown in Figure 1.                              of possibilities where its profitability is bound to be
                                                           found.


                                                                                                  2101 | P a g e
P.Divya, P. Ramesh Kumar / International Journal of Engineering Research and Applications
                 (IJERA)                ISSN: 2248-9622       www.ijera.com
                    Vol. 2, Issue 5, September- October 2012, pp.2100-2105
Apart from a TFNs great adaptability to the human             At the same time, it might work out to consider
mind structure, it is also important to consider how          those situations in which financial assets have some
easy to use it is, due to the simplicity of its               kind of relationship and then, savings can result in
membership function, which is defined by linear               the initial expenses incurred to start the investment.
functions.                                                    This is why it has to be taken into account the fixed
         Once the representation has been decided, a          expenses and initial commissions when, in the
study of the qualities of the financial market must be        portfolio, assets from the same enterprise, group,
done. That analysis aims to gather the existence of           financial entity , etc., have been included. This
variables affecting the profitability of the portfolio        information can be represented through two
as a whole.                                                   matrixes, one indicating the fixed assets variation:
         Therefore, each available financial asset            FEVij = {—,FEV12, FEV13,.......FEV1m
will bear investment’s materialization financial              FEV21,—, FEV23,.....….FEV2m
expenses, which can be distinguished between those            ..........................……………
with a flat amount and those whose value varies               FEVm1, FEVm2, FEVm3..... —},
according to the invested quantity as it happens, for         and the other one containing commissions or
instance, in commissions. It has to be taken into             variable expenses variations:
account that the higher investing capital, the lower          VEVij = {—,VEV12, VEV13,...…...VEV1m
influence of those expenses on the decision. Their            VEV21,—, VEV23,.……VEV2m
representation can be carried out through matrixes            ..........................……………
containing the different values they take.                    VEVm1, VEVm2, VEVm3..... —}.
For n assets can be considered the following fixed                          With this information it is possible to
expenses:                                                     establish the optimum portfolio selection problem,
FEi = {FE1, FE2, FE3,.......FEn}                              where it is intended to find out the financial assets
and the following variable expenses:                          combination maximizing the total expected
VEi = {VE1, VE2, VE3,.......VEn}                              profitability of the portfolio as a whole.
                                                              Traditional methods do not analyse such a complex
          Through a specialist’s opinion or through           problem, but set it up in
the knowledge the current asset manager has about             a linear way, escaping from reality
the capital market, estimates can be accomplished
about the expected profitability for each asset. These        4. APPLICATION OF FUZZY LOGIC
values will be represented by TFNs, that allow to             AND GENETIC ALGORITHMS TO THE
fulfil properly the economic variables estimates. The         SELECTION     OF     FINANCIAL
fuzzy profitability matrix for each of the n financial        PORTFOLIOS
assets would be:                                               4.1 GENETIC ALGORITHM
~Ri = { ~R1, ~R2,........ ~Rn}                                          The Genetic Algorithms constitute
                                                              optimization tools based on natural selection and on
              In addition, different profitabilities can be   the genetics mechanisms. In natural selection, the
considered regarding the invested amount and,                 evolution processes happen when the following
consequently, there will be as many such like                 conditions are satisfied:
matrixes as different investment levels shown by the          • An entity or individual is able to reproduce.
assets.                                                       • There is a population of such entities or
              Deepening into the analysis, it is possible     individuals able to reproduce.
to consider the modifications taking place in the             • Some differences in the capacity to survive in the
portfolio’s expected profitability when financial             environment are associated to that diversity.
assets related to it are incorporated. This is aimed at       Such diversity is shown in changes in the
contemplating interconnections among enterprises              chromosomes of the individuals of a population, and
shares, shares with currencies, etc., found out at            transfers into the variation of the structure and
analysing thoroughly the financial market. Those              behaviour of the individuals in their environment,
modifications can be represented as a matrix                  which is reflected in the degree of survival,
containing variations of the four values that                 adaptation and in the level of reproduction. The
determine each assets expected profitability.                 individuals that adapt better to their environment are
RVIJ = {—,RV12, RV13,.......RV1M                              those who survive longer and reproduce more.
RV21,—, RV23,.......RV2M                                      In a period of time and after many generations, the
..........................……..                                population gets more individuals, whose
RVM1, RVM2, RVM3..... —},                                     chromosomes define structures and behaviours
                                                              adapted to their environment, surviving and
          which indicates how the expected                    reproducing in a higher level , so that in the course
profitability of asset i varies when we invest also in        of time, the structure of individuals in the population
asset j.                                                      changes due to the natural selection.


                                                                                                    2102 | P a g e
P.Divya, P. Ramesh Kumar / International Journal of Engineering Research and Applications
                 (IJERA)                ISSN: 2248-9622       www.ijera.com
                    Vol. 2, Issue 5, September- October 2012, pp.2100-2105
According to the explanations above and though            On the other hand, in this paper, and considering the
there are many possible variations of Genetic             inaccuracy of the information used by Genetic
Algorithms, their fundamental mechanisms are: to          Algorithms, we will use fuzzy numbers to represent
operate over a population of individuals, usually         that information and so, the different operators of
generated in a random way, and changing the               the designed Algorithm have to be adapted to that
individuals in every iteration, according to the          point which involves a Fuzzy logic and genetic
following steps:                                          algorithm.
a) Evaluation of the individuals of a population.
b) Selection of a new set of individuals.                 4.2 SELECTION PROCESS USING FUZZY
c) Reproduction on the base of their relative             LOGIC AND GENETIC ALGORITHM
adaptation or fitness.                                              To identify the quality of each investment
d) Re-combination to create a new population from         using Fuzzy logic and GA here we use investment
the crossover and mutation operators.                     ranking to determine the quality of investment. The
The set of individuals resulting of these operations      investments with a high rank are regarded as good
conform the next population, iterating this process       quality investment. In this study, some financial
until the model cannot produce any fitness improved       indicators of the listed companies are employed to
situation.                                                determine and identify the quality of each
          Generally, each individual is represented       investment. That is, the financial indicators of the
by a binary or decimal string of fixed length,            companies are used as input variables while a score
chromosome, that codifies the values of the               is given to rate the investments. The output variable
variables that take part in the problem, so that the      is investment ranking. Throughout the study, four
representation of the data and the operations can be      important financial indicators, return on capital
manipulated to generate new strings fitting better to     employed (ROCE), price/earnings ratio (P/E Ratio),
the problem to solve.                                     earning per share (EPS) and liquidity ratio are
          Acting this way over a population of            utilized in this study.
individuals, an essential component of every                        ROCE is an indicator of a company's
Genetic Algorithm is introduced, the Fitness              profitability related to the total financing, which is
Function, that constitutes the link between such          calculated as
Algorithm and the problem to solve. A Fitness             ROCE = (Profit)/(Shareholder’s equity)×100% (1)
Function takes a chromosome as input and returns a        The higher the indicator (ROCE), the better is the
number that shows the appropriateness of the              company’s performance in terms of how efficient
solution represented by the chromosome to the             the company utilizes shareholder’s capital to
analyzed problem.                                         produce revenue.
          The Fitness Function plays the same role        P/E Ratio measures the multiple of earnings per
as the environment in the Natural Selection, due to       share at which the investment is traded on the
the fact that the interaction of an individual with its   investment exchange.
environment gives a measure of its fitting and it          The higher the ratio, the stronger is the company’s
determines that the best adapted individual has a         earning power. The calculation of this ratio is
higher probability to survive.                            computed by
          Right after the selection, a process of         P/E ratio = (investment price)/(earnings per share)
crossover is performed, trying to imitate the             ×100% (2)
reproduction of individuals according to the laws of      EPS is a performance indicator that expresses a
Nature, exchanging the genetic information of the         company’s net income in relation to the number of
parents (selected individuals), in order to obtain the    ordinary shares issued. Generally, the higher the
chromosomes of the offspring, possibly producing          indicator, the better is the company’s investment
better or more adapted individuals.                       value. The calculation of the indicator can be
          Besides the exchange of chromosomes,            represented as
Nature often produce sporadic changes in the              Earnings per share = (Net income)/(The number of
genetic information, denominated by biologist             ordinary shares) (3)
mutations. That is the reason why, in the execution       Liquidity ratio measures the extent to which a
of the Algorithm, this process is introduced and          company can quickly liquidate assets to cover short-
performs small random modifications in the                term liabilities. It is calculated as follows:
chromosomes of the individuals resulting from the         Liquidity Ratio = (Current Assets)/(Current
crossover.                                                Liabilities) ×100% (4)
          When the above described operative is           If the liquidity ratio is too high, company
performed correctly within this evolutive process, an     performance is not good due to too much cash or
initial population will be improved by its successors     investment on hand. When the ratio is too low, the
and therefore, the best fitting individual of the last    company does not have sufficient cash to settle
population can be a very appropriate                      short-term debt.
solution for the problem.

                                                                                               2103 | P a g e
P.Divya, P. Ramesh Kumar / International Journal of Engineering Research and Applications
                 (IJERA)                ISSN: 2248-9622       www.ijera.com
                    Vol. 2, Issue 5, September- October 2012, pp.2100-2105
When the input variables are determined, we can use       point in using GA, which determines what a GA
GA to distinguish and identify the quality of each        should optimize. Since the output is some estimated
investment, as illustrated in Fig. 1. The detailed        investment ranking of designated testing companies,
procedure is illustrated                                  some actual investment ranking should be defined in
as follows.                                               advance for designing fitness function. Here we use
                                                          annual price return (APR) to rank the listed
                                                          investment and the APR is represented as


                                                                   where APRn is the annual price return for
                                                          year n, ASPn is the annual investment price for year
                                                          n. Usually, the investments with a high annual price
                                                          return are regarded as good investments. With the
                                                          value of APR evaluated for each of the N trading
                                                          investments, they will be assigned for a ranking r
                                                          ranged from 1 and N, where 1 is the highest value of
                                                          the APR while N is the lowest. For convenience of
                                                          comparison, the investment’s rank r should be
                                                          mapped linearly into investment ranking ranged
                                                          from 0 to 7 with the following equation:
Fig. 1. Investment selection with genetic algorithm

          First of all, a population, which consists of
a given number of chromosomes, is initially created                Thus, the fitness function can be designed
by randomly assigning “1” and “0” to all genes. In        to minimize the root mean square error (RMSE) of
the case of investment ranking, a gene contains only      the difference between the financial indicator
a single bit string for the status of input variable.     derived ranking and the next year’s actual ranking
The top right part of Figure 1 shows a population         of all the listed companies for a particular
with four chromosomes, each chromosome includes           chromosome, representing by
different genes. In this study, the initial population
of the GA is generated by encoding four input
variables. For the testing case of ROCE, we design 8
statuses representing different qualities in terms of
different interval, varying from 0 (Extremely poor)       After evolving the fitness of the population, the
to 7 (very good). An example of encoding ROCE is          best chromosomes with the highest fitness value are
shown in Table 1. Other input variables are encoded       selected by means of the roulette wheel. Thereby,
by the same principle. That is, the binary string of a    the chromosomes are allocated space on a roulette
gene consists of three single bits, as illustrated by     wheel proportional to their fitness and thus the
Fig. 1.                                                   fittest chromosomes are more likely selected. In the
Table 1. An example of encoding ROCE                      following crossover step, offspring chromosomes
ROCE                value             Status Encoding     are created by some crossover techniques. A so-
(-∞, -30%]           0                 000                called one-point crossover technique is employed,
(-30%, -20%]         1                 001                which randomly selects a crossover point within the
(-20%,-10%]          2                 010                chromosome. Then two parent chromosomes are
(-10%,0%]            3                 011                interchanged at this point to produce two new
(0%, 10%]            4                 100                offspring. After that, the chromosomes are mutated
(10%, 20%]           5                 101                with a probability of 0.005 per gene by randomly
(20%, 30%]           6                 110                changing genes from “0” to “1” and vice versa. The
(30%,+∞)             7                 111                mutation prevents the GA from converging too
          Note that 3-digit encoding is used for          quickly in a small area of the search space. Finally,
simplicity in this study. Of course, 4-digit encoding     the final generation will be judged. If yes, then the
is also adopted, but the computations will be rather      optimized results are obtained. If no, then the
complexity.                                               evaluation and reproduction steps are repeated until
          The subsequent work is to evaluate the          a certain number of generations, until a defined
chromosomes generated by previous operation by a          fitness or until a convergence criterion of the
so-called fitness function, while the design of the       population are reached. In the ideal case, all
fitness function is a crucial                             chromosomes of the last generation have the same
                                                          genes representing the optimal solution.


                                                                                              2104 | P a g e
P.Divya, P. Ramesh Kumar / International Journal of Engineering Research and Applications
                    (IJERA)                ISSN: 2248-9622       www.ijera.com
                       Vol. 2, Issue 5, September- October 2012, pp.2100-2105
Through the process of fuzzy logic and GA                          Fuzzy Sets and Systems, vol. 159, no. 23,
optimization, the investments are ranked according                 pp. 3183-3200, 2008.
to the fundamental financial information and price          [6]    HERRERA, F. and VERDEGAY, J.L.
return. Investors can select the top n investments to              (1996): “Genetic Algorithms and Soft
construct a portfolio.                                             Computing”, Physica-Verlag.
                                                            [7]    Chu, T.C. Tsao, C.T. Shiue, Y.R.:
I CONCLUSION                                                       Application of Fuzzy Multiple Attribute
          The solutions obtained with this Fuzzy                   Decision Making on Company Analysis for
logic and Genetic Model of portfolio selection are                 Stock Selection. Proceedings of Soft
more correct, in our opinion, because it tries to                  Computing in Intelligent Systems and
considerate the reality of the financial market                    Information Processing (1996) 509-514
without transforming it or reducing its high                [8]    Chen, S.H. Genetic Algorithms and
complexity.                                                        Genetic Programming in Computational
          The fuzzy treatment of the information                   Finance. Kluwer Academic Publishers,
allows the representation of the expected                          Dordrecht (2002)
profitability of the assets including the risk that their   [9]    Holland, J. H.: Genetic Algorithms.
selection bears as well as the higher yield that can               Scientific American 267 (1992) 66-72
be obtained within the best situation.                      [10]    Goldberg, D.E.: Genetic Algorithm in
          Also, the use of a Fuzzy logic and Genetic               Search, Optimization, and Machine
Algorithm allows us to include the relations between               Learning. Addison-Wesley, Reading, MA
the assets and the resulting modifications that such               (1989)
relations originate in profitabilities and expenses         [11]    J. Lewellen, “Predicting returns with
and, therefore, complete and extend the field of                   financial ratio,” Journal of Financial
application of the portfolio selection to the everyday             Economics, vol. 74, no. 2, pp. 209-235,
reality of the problem INTRODUCING A USEFUL TOOL                   2004.
FOR CASH MANAGEMENT .Acknowledgements                       [12]    E. F. Fama and K. R. French, “Average
An acknowledgement section may be presented                        returns, B/M, and share issue,” Journal of
after the conclusion, if desired.                                  Finance, vol. 63, no. 6, pp. 2971-2995,
                                                                   2008.
REFERENCES                                                  [13]    E. Hjalmarsson, “Predicting global stock
    [1]   BEETIS , R.A. and MAHAJAN, V. (1985):                    returns,” Journal of Financial and
          “Risk/Return         Performance       of                Quantitative Analysis, vol. 45, no. 1, pp.
          DiversedFirms”, Management Science,                      49-80, 2010.
          July, pp. 136-167.                                [14]    M. Omran, “Linear versus non-linear
    [2]   DAVIS, L. (1991): “Handbook of Genetic                   relationships between financial ratios and
          Algorithms”, Van Nostrand Reinhold, New                  stock returns: empirical evidence from
          York.                                                    Egyptian firms,” Review of Accounting and
    [3]   GOLDBERG, D.E. (1989): “Genetic                          Finance, vol. 3, no. 2, pp. 84-102, 2004.
          Algorithms in Search, Optimation &                [15]    R. Bauer, N. Guenster, and R. Otten,
          Machine Learning”, Addison-Wesley,                       “Empirical     evidence      on    corporate
          Massachusetts.                                           governance in Europe: the effect on stock
    [4]   B. R. Chang, “Applying nonlinear                         returns, firm value and performance,”
          generalized autoregressive conditional                   Journal of Asset Management, vol. 5, no. 2,
          heteroscedasticity to compensate ANFIS                   pp. 91-104, 2004.
          outputs tuned by adaptive support vector          [16]    B. A. Sensoy, “Performance evaluation
          regression,” Fuzzy Sets and Systems, vol.                and self-designated benchmark indexes in
          157, no. 13, pp. 1832-1850, 2006.                        the mutual fund industry,” Journal of
    [5]   B. R. Chang, “Resolving the forecasting                  Financial Economics, vol. 92, no. 1, pp.
          problems of overshoot and volatility                     25-39, 2009.
          clustering using ANFIS coupling nonlinear
          heteroscedasticity with quantum tuning,”

`


                                                                                              2105 | P a g e

Mais conteúdo relacionado

Mais procurados

L2 flash cards portfolio management - SS 18
L2 flash cards portfolio management - SS 18L2 flash cards portfolio management - SS 18
L2 flash cards portfolio management - SS 18analystbuddy
 
Portfolio management
Portfolio managementPortfolio management
Portfolio managementAshwini Das
 
Portfolio theory chapter
Portfolio theory chapterPortfolio theory chapter
Portfolio theory chaptershashi09kumar
 
L2 flash cards corporate finance - SS 8
L2 flash cards corporate finance - SS 8L2 flash cards corporate finance - SS 8
L2 flash cards corporate finance - SS 8analystbuddy
 
Security Analysis and Portfolio Management
Security Analysis and Portfolio ManagementSecurity Analysis and Portfolio Management
Security Analysis and Portfolio ManagementVishnu Rajendran C R
 
L2 flash cards fixed income - SS 14
L2 flash cards fixed income - SS 14L2 flash cards fixed income - SS 14
L2 flash cards fixed income - SS 14analystbuddy
 
Fundamental and Technical Analysis
Fundamental and Technical AnalysisFundamental and Technical Analysis
Fundamental and Technical AnalysisMACFAST
 
Capital asset pricing model
Capital asset pricing modelCapital asset pricing model
Capital asset pricing modelAaryendr
 
MODERN PORTFOLIO MANAGEMENT
MODERN PORTFOLIO MANAGEMENTMODERN PORTFOLIO MANAGEMENT
MODERN PORTFOLIO MANAGEMENT123vedapradha
 
Capital market theory
Capital market theoryCapital market theory
Capital market theoryStudent
 
Security Analysis and Portfolio Management
Security Analysis and Portfolio ManagementSecurity Analysis and Portfolio Management
Security Analysis and Portfolio ManagementShrey Sao
 

Mais procurados (19)

L2 flash cards portfolio management - SS 18
L2 flash cards portfolio management - SS 18L2 flash cards portfolio management - SS 18
L2 flash cards portfolio management - SS 18
 
Portfolio management
Portfolio managementPortfolio management
Portfolio management
 
Portfolio theory chapter
Portfolio theory chapterPortfolio theory chapter
Portfolio theory chapter
 
L2 flash cards corporate finance - SS 8
L2 flash cards corporate finance - SS 8L2 flash cards corporate finance - SS 8
L2 flash cards corporate finance - SS 8
 
Security Analysis and Portfolio Management
Security Analysis and Portfolio ManagementSecurity Analysis and Portfolio Management
Security Analysis and Portfolio Management
 
Chap010
Chap010Chap010
Chap010
 
Portfolio theory
Portfolio theoryPortfolio theory
Portfolio theory
 
CAPM
CAPMCAPM
CAPM
 
Modern Portfolio Theory
Modern Portfolio TheoryModern Portfolio Theory
Modern Portfolio Theory
 
L2 flash cards fixed income - SS 14
L2 flash cards fixed income - SS 14L2 flash cards fixed income - SS 14
L2 flash cards fixed income - SS 14
 
Fundamental and Technical Analysis
Fundamental and Technical AnalysisFundamental and Technical Analysis
Fundamental and Technical Analysis
 
Capital asset pricing model
Capital asset pricing modelCapital asset pricing model
Capital asset pricing model
 
Capital Asset pricing model- lec6
Capital Asset pricing model- lec6Capital Asset pricing model- lec6
Capital Asset pricing model- lec6
 
MODERN PORTFOLIO MANAGEMENT
MODERN PORTFOLIO MANAGEMENTMODERN PORTFOLIO MANAGEMENT
MODERN PORTFOLIO MANAGEMENT
 
Capital market theory
Capital market theoryCapital market theory
Capital market theory
 
Security Analysis and Portfolio Management
Security Analysis and Portfolio ManagementSecurity Analysis and Portfolio Management
Security Analysis and Portfolio Management
 
CAPM
CAPMCAPM
CAPM
 
Capm
CapmCapm
Capm
 
Modern portfolio theory
Modern portfolio theoryModern portfolio theory
Modern portfolio theory
 

Destaque

STF guia do advogado 2010
STF guia do advogado 2010STF guia do advogado 2010
STF guia do advogado 2010Cristiane Lara
 
Manualdascantinasescolaressaudveis
ManualdascantinasescolaressaudveisManualdascantinasescolaressaudveis
ManualdascantinasescolaressaudveisLidiane Martins
 
Relatorio Sustentabilidade_BAUMGARTEN_2016
Relatorio Sustentabilidade_BAUMGARTEN_2016Relatorio Sustentabilidade_BAUMGARTEN_2016
Relatorio Sustentabilidade_BAUMGARTEN_2016Duda Bottini
 
Seminario port. final naquelas
Seminario port. final naquelasSeminario port. final naquelas
Seminario port. final naquelascloust
 
Para Genios
Para GeniosPara Genios
Para Genioseliago
 
Europe shared photo
Europe shared photoEurope shared photo
Europe shared photoPcomeius0911
 
Lesslie Newbigin_Teologia_Reformada_Tradição
Lesslie Newbigin_Teologia_Reformada_TradiçãoLesslie Newbigin_Teologia_Reformada_Tradição
Lesslie Newbigin_Teologia_Reformada_TradiçãoMarcelo Gonçalves
 
Camino a-la-superacion-persona l
Camino a-la-superacion-persona lCamino a-la-superacion-persona l
Camino a-la-superacion-persona lRaul Gil
 
Grupo L Bajo Coste
Grupo L Bajo CosteGrupo L Bajo Coste
Grupo L Bajo Costesanti79
 
La contaminacion
La   contaminacionLa   contaminacion
La contaminacionflavio
 
Publico Y Privado
Publico Y PrivadoPublico Y Privado
Publico Y Privadouexternado
 
morning star Xose Miranda
morning star Xose Mirandamorning star Xose Miranda
morning star Xose Mirandalagoazul
 
Alimentos regionais brasileiros
Alimentos regionais brasileirosAlimentos regionais brasileiros
Alimentos regionais brasileirosLidiane Martins
 

Destaque (20)

Z25128135
Z25128135Z25128135
Z25128135
 
STF guia do advogado 2010
STF guia do advogado 2010STF guia do advogado 2010
STF guia do advogado 2010
 
Manualdascantinasescolaressaudveis
ManualdascantinasescolaressaudveisManualdascantinasescolaressaudveis
Manualdascantinasescolaressaudveis
 
Relatorio Sustentabilidade_BAUMGARTEN_2016
Relatorio Sustentabilidade_BAUMGARTEN_2016Relatorio Sustentabilidade_BAUMGARTEN_2016
Relatorio Sustentabilidade_BAUMGARTEN_2016
 
Seminario port. final naquelas
Seminario port. final naquelasSeminario port. final naquelas
Seminario port. final naquelas
 
Para Genios
Para GeniosPara Genios
Para Genios
 
Europe shared photo
Europe shared photoEurope shared photo
Europe shared photo
 
Fono Call Center
Fono Call CenterFono Call Center
Fono Call Center
 
Cartilha pescado2008
Cartilha pescado2008Cartilha pescado2008
Cartilha pescado2008
 
Lesslie Newbigin_Teologia_Reformada_Tradição
Lesslie Newbigin_Teologia_Reformada_TradiçãoLesslie Newbigin_Teologia_Reformada_Tradição
Lesslie Newbigin_Teologia_Reformada_Tradição
 
Camino a-la-superacion-persona l
Camino a-la-superacion-persona lCamino a-la-superacion-persona l
Camino a-la-superacion-persona l
 
Diapositivas Proyecto
Diapositivas ProyectoDiapositivas Proyecto
Diapositivas Proyecto
 
Grupo L Bajo Coste
Grupo L Bajo CosteGrupo L Bajo Coste
Grupo L Bajo Coste
 
Proyecto inpes digital 2013
Proyecto inpes digital 2013Proyecto inpes digital 2013
Proyecto inpes digital 2013
 
La contaminacion
La   contaminacionLa   contaminacion
La contaminacion
 
Publico Y Privado
Publico Y PrivadoPublico Y Privado
Publico Y Privado
 
morning star Xose Miranda
morning star Xose Mirandamorning star Xose Miranda
morning star Xose Miranda
 
Alimentos regionais brasileiros
Alimentos regionais brasileirosAlimentos regionais brasileiros
Alimentos regionais brasileiros
 
Receitas regionais
Receitas regionaisReceitas regionais
Receitas regionais
 
París
ParísParís
París
 

Semelhante a Mb2521002105

TO STUDY THE OPTIMIZATION OF PORTFOLIO RISK AND RETURN
TO STUDY THE OPTIMIZATION OF PORTFOLIO RISK AND RETURNTO STUDY THE OPTIMIZATION OF PORTFOLIO RISK AND RETURN
TO STUDY THE OPTIMIZATION OF PORTFOLIO RISK AND RETURNPriyansh Kesarwani
 
5_Saurabh-Agarwal-Sarita v.pdf a study on portfolio management & financial se...
5_Saurabh-Agarwal-Sarita v.pdf a study on portfolio management & financial se...5_Saurabh-Agarwal-Sarita v.pdf a study on portfolio management & financial se...
5_Saurabh-Agarwal-Sarita v.pdf a study on portfolio management & financial se...vaghasiyadixa1
 
Introducing-the-Two-Sigma-Factor-Lens.10.18.pdf
Introducing-the-Two-Sigma-Factor-Lens.10.18.pdfIntroducing-the-Two-Sigma-Factor-Lens.10.18.pdf
Introducing-the-Two-Sigma-Factor-Lens.10.18.pdfClarenceTee1
 
Assessment of Security Analysis and Portfolio Management in Indian Stock Market
Assessment of Security Analysis and Portfolio Management in Indian Stock MarketAssessment of Security Analysis and Portfolio Management in Indian Stock Market
Assessment of Security Analysis and Portfolio Management in Indian Stock Marketijtsrd
 
91506566 portfolio-management-process-of-a-financial-institution
91506566 portfolio-management-process-of-a-financial-institution91506566 portfolio-management-process-of-a-financial-institution
91506566 portfolio-management-process-of-a-financial-institutionMuhammad Waseem
 
Systematic return-strategies-cs
Systematic return-strategies-csSystematic return-strategies-cs
Systematic return-strategies-csScott Treloar
 
Measuring risk in investments
Measuring risk in investmentsMeasuring risk in investments
Measuring risk in investmentsBabasab Patil
 
Risk Factors as Building Blocks for Portfolio Diversification
Risk Factors as Building Blocks for Portfolio DiversificationRisk Factors as Building Blocks for Portfolio Diversification
Risk Factors as Building Blocks for Portfolio DiversificationCallan
 
Equity Risk Premium in an Emerging Market Economy
Equity Risk Premium in an Emerging Market EconomyEquity Risk Premium in an Emerging Market Economy
Equity Risk Premium in an Emerging Market Economyiosrjce
 
Risk management in mutual fund
Risk management in mutual fundRisk management in mutual fund
Risk management in mutual fundDEEPAK PANDEY
 
Does the capital assets pricing model (capm) predicts stock market returns in...
Does the capital assets pricing model (capm) predicts stock market returns in...Does the capital assets pricing model (capm) predicts stock market returns in...
Does the capital assets pricing model (capm) predicts stock market returns in...Alexander Decker
 
Analysing private equity and venture capital funds through the lens of risk m...
Analysing private equity and venture capital funds through the lens of risk m...Analysing private equity and venture capital funds through the lens of risk m...
Analysing private equity and venture capital funds through the lens of risk m...Izam Ryan
 
Portfolio management
Portfolio managementPortfolio management
Portfolio managementDharmik
 
CAPM - Assessment and Data Analysis
CAPM - Assessment and Data Analysis CAPM - Assessment and Data Analysis
CAPM - Assessment and Data Analysis Mahad Akram
 

Semelhante a Mb2521002105 (20)

1762 5357-1-pb
1762 5357-1-pb1762 5357-1-pb
1762 5357-1-pb
 
Edhec Working Paper Solvency II
Edhec Working Paper Solvency IIEdhec Working Paper Solvency II
Edhec Working Paper Solvency II
 
report
reportreport
report
 
TO STUDY THE OPTIMIZATION OF PORTFOLIO RISK AND RETURN
TO STUDY THE OPTIMIZATION OF PORTFOLIO RISK AND RETURNTO STUDY THE OPTIMIZATION OF PORTFOLIO RISK AND RETURN
TO STUDY THE OPTIMIZATION OF PORTFOLIO RISK AND RETURN
 
5_Saurabh-Agarwal-Sarita v.pdf a study on portfolio management & financial se...
5_Saurabh-Agarwal-Sarita v.pdf a study on portfolio management & financial se...5_Saurabh-Agarwal-Sarita v.pdf a study on portfolio management & financial se...
5_Saurabh-Agarwal-Sarita v.pdf a study on portfolio management & financial se...
 
Introducing-the-Two-Sigma-Factor-Lens.10.18.pdf
Introducing-the-Two-Sigma-Factor-Lens.10.18.pdfIntroducing-the-Two-Sigma-Factor-Lens.10.18.pdf
Introducing-the-Two-Sigma-Factor-Lens.10.18.pdf
 
Assessment of Security Analysis and Portfolio Management in Indian Stock Market
Assessment of Security Analysis and Portfolio Management in Indian Stock MarketAssessment of Security Analysis and Portfolio Management in Indian Stock Market
Assessment of Security Analysis and Portfolio Management in Indian Stock Market
 
91506566 portfolio-management-process-of-a-financial-institution
91506566 portfolio-management-process-of-a-financial-institution91506566 portfolio-management-process-of-a-financial-institution
91506566 portfolio-management-process-of-a-financial-institution
 
Systematic return-strategies-cs
Systematic return-strategies-csSystematic return-strategies-cs
Systematic return-strategies-cs
 
Measuring risk in investments
Measuring risk in investmentsMeasuring risk in investments
Measuring risk in investments
 
Risk Factors as Building Blocks for Portfolio Diversification
Risk Factors as Building Blocks for Portfolio DiversificationRisk Factors as Building Blocks for Portfolio Diversification
Risk Factors as Building Blocks for Portfolio Diversification
 
Equity Risk Premium in an Emerging Market Economy
Equity Risk Premium in an Emerging Market EconomyEquity Risk Premium in an Emerging Market Economy
Equity Risk Premium in an Emerging Market Economy
 
Risk management in mutual fund
Risk management in mutual fundRisk management in mutual fund
Risk management in mutual fund
 
Does the capital assets pricing model (capm) predicts stock market returns in...
Does the capital assets pricing model (capm) predicts stock market returns in...Does the capital assets pricing model (capm) predicts stock market returns in...
Does the capital assets pricing model (capm) predicts stock market returns in...
 
Risk Whitepaper
Risk WhitepaperRisk Whitepaper
Risk Whitepaper
 
Analysing private equity and venture capital funds through the lens of risk m...
Analysing private equity and venture capital funds through the lens of risk m...Analysing private equity and venture capital funds through the lens of risk m...
Analysing private equity and venture capital funds through the lens of risk m...
 
MEI Summit 2011: Professor Noël Amenc
MEI Summit 2011: Professor Noël AmencMEI Summit 2011: Professor Noël Amenc
MEI Summit 2011: Professor Noël Amenc
 
Portfolio management
Portfolio managementPortfolio management
Portfolio management
 
CAPM - Assessment and Data Analysis
CAPM - Assessment and Data Analysis CAPM - Assessment and Data Analysis
CAPM - Assessment and Data Analysis
 
An introduction to asset
An introduction to assetAn introduction to asset
An introduction to asset
 

Mb2521002105

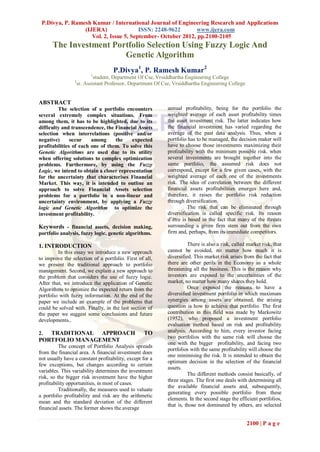
  • 1. P.Divya, P. Ramesh Kumar / International Journal of Engineering Research and Applications (IJERA) ISSN: 2248-9622 www.ijera.com Vol. 2, Issue 5, September- October 2012, pp.2100-2105 The Investment Portfolio Selection Using Fuzzy Logic And Genetic Algorithm P.Divya1, P. Ramesh Kumar2 1 student, Department Of Cse, Vrsiddhartha Engineering College 2 sr. Assistant Professor, Department Of Cse, Vrsiddhartha Engineering College ABSTRACT The selection of a portfolio encounters annual profitability, being for the portfolio the several extremely complex situations. From weighted average of each asset profitability times among them, it has to be highlighted, due to its the asset investment risk. The latter indicates how difficulty and transcendence, the Financial Assets the financial investment has varied regarding the selection when interrelations (positive and/or average of the past data analysis. Thus, when a negative) occur among the expected portfolio has to be managed, the decision maker will profitabilities of each one of them. To solve this have to choose those investments maximizing their Genetic Algorithms are used due to its utility profitability with the minimum possible risk. when when offering solutions to complex optimization several investments are brought together into the problems. Furthermore, by using the Fuzzy same portfolio, the assumed risk does not Logic, we intend to obtain a closer representation correspond, except for a few given cases, with the for the uncertainty that characterises Financial weighted average of each one of the investments Market. This way, it is intended to outline an risk. The idea of correlation between the different approach to solve Financial Assets selection financial assets profitabilities emerges here and, problems for a portfolio in a non-linear and therefore, it raises the portfolio risk reduction uncertainty environment, by applying a Fuzzy through diversification. logic and Genetic Algorithm to optimize the The risk that can be eliminated through investment profitability. diversification is called specific risk. Its reason d’être is based in the fact that many of the threats Keywords - financial assets, decision making, surrounding a given firm stem out from the own portfolio analysis, fuzzy logic, genetic algorithms. firm and, perhaps, from its immediate competitors. 1. INTRODUCTION There is also a risk, called market risk, that In this essay we introduce a new approach cannot be avoided, no matter how much it is to improve the selection of a portfolio. First of all, diversified. This market risk arises from the fact that we present the traditional approach to portfolio there are other perils in the Economy as a whole management. Second, we explain a new approach to threatening all the business. This is the reason why the problem that considers the use of fuzzy logic. investors are exposed to the uncertainties of the After that, we introduce the application of Genetic market, no matter how many shares they hold. Algorithms to optimize the expected return from the Once exposed the reasons to have a portfolio with fuzzy information. At the end of the diversified investment portfolio in which maximum paper we include an example of the problems that synergies among assets are obtained, the arising could be solved with. Finally, in the last section of question is how to achieve that portfolio. The first the paper we suggest some conclusions and future contribution in this field was made by Markowitz developments.. (1952), who proposed a investment portfolio evaluation method based on risk and profitability 2. TRADITIONAL APPROACH TO analysis. According to him, every investor facing two portfolios with the same risk will choose the PORTFOLIO MANAGEMENT one with the bigger profitability, and facing two The concept of Portfolio Analysis spreads portfolios with the same profitability will choose the from the financial area. A financial investment does one minimising the risk. It is intended to obtain the not usually have a constant profitability, except for a optimum decision in the selection of the financial few exceptions, but changes according to certain assets. variables. This variability determines the investment The different methods consist basically, of risk, so the bigger risk investment have the higher three stages. The first one deals with determining all profitability opportunities, in most of cases. the available financial assets and, subsequently, Traditionally, the measures used to valuate generating every possible portfolio from these a portfolio profitability and risk are the arithmetic elements. In the second stage the efficient portfolios, mean and the standard deviation of the different that is, those not dominated by others, are selected financial assets. The former shows the average 2100 | P a g e
  • 2. P.Divya, P. Ramesh Kumar / International Journal of Engineering Research and Applications (IJERA) ISSN: 2248-9622 www.ijera.com Vol. 2, Issue 5, September- October 2012, pp.2100-2105 using some rules, such as the Mean-Variance or the Stochastic Dominance Then, in the third one, the optimum portfolio is chosen among them. This final decision is proposed in this method as purely intuitive. 3. A NEW APPROACH TO PORTFOLIO MANAGEMENT This paper endeavours to find a representation of the available information in the financial market , as reliable as possible, since using both mean and standard deviation as indicators for investment profitability and risk, may bring out inefficient decisions. With this, it’s not intended to suggest their non-validity but, in addition to the information supplied by those indicators, the investor can complete his knowledge of the financial Figure 1 market with other sources. In particular, it all deals with including estimates from market behaviour A TFN has four points that represent or experts, economic variables forecasts that can define it; in Figure 1 they are: a1 , a2 , a3 , a4 . So, determine the financial assets behaviour through the a TFN can be represented in a quaternary way: sensibility they show towards them, government à = ( a1 , a2 , a3 , a4 ) with a1 , a2 , a3 , a4 ∈ ℜ policies, business strategies, etc., or even it may be and a1 ≤ a2 ≤ a3 ≤ a4 considered subjective aspects such as the broker’s These four numbers involve that: accuracy when focusing a certain portfolio on ∀ x ≤ a1 μ(x) =0 determined financial assets. With this it is aimed to ∀ x ≥ a4 μ(x) =0 include both objective and subjective criteria, ∀ a2 ≤x ≤ a3 μ(x) =1 provided by the financial market itself. On the other and that function μ(x) for the remaining values is the hand, as an additional element to this set of issues, it line that joins point ( a1 , 0) with point ( a2 ,1), and has to be highlighted a relation or interconnection the line joining point ( a3 , 1) with ( a4 , 0). among the available financial assets. This fact is due Consequently, a TFN membership function, can be to synergies existing among them, that cause noted as follow: changes in profitability because of certain situations, such as modifications in share prices of the enterprises depending on the same economic variables, joint ventures, shares of enterprises whose profitability is interfered with a certain currency price, fixed interest investments depending on the interest rate set by each country’s Central Bank, etc. In order to fit all the available information together it is proposed to use the Fuzzy logic, since as a mathematics branch dealing with objective and subjective matters, it attempts to take a phenomenon The very conceptualisation of TFN allows as presented in reality, and handle it to make it a good suitability to different real situations, certain or accurate. particularly to economic and entrepreneurial The reason to use logic and fuzzy estimates. Thus, for instance, the expected return for technology is based in author’s perception that, a financial asset in a given period of time can be since portfolio selectors realise that their established as: environment and, therefore, the information they R = (4%; 5,5%; 6%; 8%) handle, is uncertain and diffuse, it seems obvious which means that, the profitability of this they prefer realistic representations rather than just asset will be at least four percent, that it is likely to models assumed to be exact. be between five point five and six percent and that it The decision help system supported by will not be higher than eight percent. This way, not Trapezoidal Fuzzy Numbers (TFN) is used to only the expected profitability can be represented, represent uncertain values of the different variables. but also the risk run when investing in a financial The membership functions that define then, μ(x), are asset, for in that TFN it is represented the whole set linear, as shown in Figure 1. of possibilities where its profitability is bound to be found. 2101 | P a g e
  • 3. P.Divya, P. Ramesh Kumar / International Journal of Engineering Research and Applications (IJERA) ISSN: 2248-9622 www.ijera.com Vol. 2, Issue 5, September- October 2012, pp.2100-2105 Apart from a TFNs great adaptability to the human At the same time, it might work out to consider mind structure, it is also important to consider how those situations in which financial assets have some easy to use it is, due to the simplicity of its kind of relationship and then, savings can result in membership function, which is defined by linear the initial expenses incurred to start the investment. functions. This is why it has to be taken into account the fixed Once the representation has been decided, a expenses and initial commissions when, in the study of the qualities of the financial market must be portfolio, assets from the same enterprise, group, done. That analysis aims to gather the existence of financial entity , etc., have been included. This variables affecting the profitability of the portfolio information can be represented through two as a whole. matrixes, one indicating the fixed assets variation: Therefore, each available financial asset FEVij = {—,FEV12, FEV13,.......FEV1m will bear investment’s materialization financial FEV21,—, FEV23,.....….FEV2m expenses, which can be distinguished between those ..........................…………… with a flat amount and those whose value varies FEVm1, FEVm2, FEVm3..... —}, according to the invested quantity as it happens, for and the other one containing commissions or instance, in commissions. It has to be taken into variable expenses variations: account that the higher investing capital, the lower VEVij = {—,VEV12, VEV13,...…...VEV1m influence of those expenses on the decision. Their VEV21,—, VEV23,.……VEV2m representation can be carried out through matrixes ..........................…………… containing the different values they take. VEVm1, VEVm2, VEVm3..... —}. For n assets can be considered the following fixed With this information it is possible to expenses: establish the optimum portfolio selection problem, FEi = {FE1, FE2, FE3,.......FEn} where it is intended to find out the financial assets and the following variable expenses: combination maximizing the total expected VEi = {VE1, VE2, VE3,.......VEn} profitability of the portfolio as a whole. Traditional methods do not analyse such a complex Through a specialist’s opinion or through problem, but set it up in the knowledge the current asset manager has about a linear way, escaping from reality the capital market, estimates can be accomplished about the expected profitability for each asset. These 4. APPLICATION OF FUZZY LOGIC values will be represented by TFNs, that allow to AND GENETIC ALGORITHMS TO THE fulfil properly the economic variables estimates. The SELECTION OF FINANCIAL fuzzy profitability matrix for each of the n financial PORTFOLIOS assets would be: 4.1 GENETIC ALGORITHM ~Ri = { ~R1, ~R2,........ ~Rn} The Genetic Algorithms constitute optimization tools based on natural selection and on In addition, different profitabilities can be the genetics mechanisms. In natural selection, the considered regarding the invested amount and, evolution processes happen when the following consequently, there will be as many such like conditions are satisfied: matrixes as different investment levels shown by the • An entity or individual is able to reproduce. assets. • There is a population of such entities or Deepening into the analysis, it is possible individuals able to reproduce. to consider the modifications taking place in the • Some differences in the capacity to survive in the portfolio’s expected profitability when financial environment are associated to that diversity. assets related to it are incorporated. This is aimed at Such diversity is shown in changes in the contemplating interconnections among enterprises chromosomes of the individuals of a population, and shares, shares with currencies, etc., found out at transfers into the variation of the structure and analysing thoroughly the financial market. Those behaviour of the individuals in their environment, modifications can be represented as a matrix which is reflected in the degree of survival, containing variations of the four values that adaptation and in the level of reproduction. The determine each assets expected profitability. individuals that adapt better to their environment are RVIJ = {—,RV12, RV13,.......RV1M those who survive longer and reproduce more. RV21,—, RV23,.......RV2M In a period of time and after many generations, the ..........................…….. population gets more individuals, whose RVM1, RVM2, RVM3..... —}, chromosomes define structures and behaviours adapted to their environment, surviving and which indicates how the expected reproducing in a higher level , so that in the course profitability of asset i varies when we invest also in of time, the structure of individuals in the population asset j. changes due to the natural selection. 2102 | P a g e
  • 4. P.Divya, P. Ramesh Kumar / International Journal of Engineering Research and Applications (IJERA) ISSN: 2248-9622 www.ijera.com Vol. 2, Issue 5, September- October 2012, pp.2100-2105 According to the explanations above and though On the other hand, in this paper, and considering the there are many possible variations of Genetic inaccuracy of the information used by Genetic Algorithms, their fundamental mechanisms are: to Algorithms, we will use fuzzy numbers to represent operate over a population of individuals, usually that information and so, the different operators of generated in a random way, and changing the the designed Algorithm have to be adapted to that individuals in every iteration, according to the point which involves a Fuzzy logic and genetic following steps: algorithm. a) Evaluation of the individuals of a population. b) Selection of a new set of individuals. 4.2 SELECTION PROCESS USING FUZZY c) Reproduction on the base of their relative LOGIC AND GENETIC ALGORITHM adaptation or fitness. To identify the quality of each investment d) Re-combination to create a new population from using Fuzzy logic and GA here we use investment the crossover and mutation operators. ranking to determine the quality of investment. The The set of individuals resulting of these operations investments with a high rank are regarded as good conform the next population, iterating this process quality investment. In this study, some financial until the model cannot produce any fitness improved indicators of the listed companies are employed to situation. determine and identify the quality of each Generally, each individual is represented investment. That is, the financial indicators of the by a binary or decimal string of fixed length, companies are used as input variables while a score chromosome, that codifies the values of the is given to rate the investments. The output variable variables that take part in the problem, so that the is investment ranking. Throughout the study, four representation of the data and the operations can be important financial indicators, return on capital manipulated to generate new strings fitting better to employed (ROCE), price/earnings ratio (P/E Ratio), the problem to solve. earning per share (EPS) and liquidity ratio are Acting this way over a population of utilized in this study. individuals, an essential component of every ROCE is an indicator of a company's Genetic Algorithm is introduced, the Fitness profitability related to the total financing, which is Function, that constitutes the link between such calculated as Algorithm and the problem to solve. A Fitness ROCE = (Profit)/(Shareholder’s equity)×100% (1) Function takes a chromosome as input and returns a The higher the indicator (ROCE), the better is the number that shows the appropriateness of the company’s performance in terms of how efficient solution represented by the chromosome to the the company utilizes shareholder’s capital to analyzed problem. produce revenue. The Fitness Function plays the same role P/E Ratio measures the multiple of earnings per as the environment in the Natural Selection, due to share at which the investment is traded on the the fact that the interaction of an individual with its investment exchange. environment gives a measure of its fitting and it The higher the ratio, the stronger is the company’s determines that the best adapted individual has a earning power. The calculation of this ratio is higher probability to survive. computed by Right after the selection, a process of P/E ratio = (investment price)/(earnings per share) crossover is performed, trying to imitate the ×100% (2) reproduction of individuals according to the laws of EPS is a performance indicator that expresses a Nature, exchanging the genetic information of the company’s net income in relation to the number of parents (selected individuals), in order to obtain the ordinary shares issued. Generally, the higher the chromosomes of the offspring, possibly producing indicator, the better is the company’s investment better or more adapted individuals. value. The calculation of the indicator can be Besides the exchange of chromosomes, represented as Nature often produce sporadic changes in the Earnings per share = (Net income)/(The number of genetic information, denominated by biologist ordinary shares) (3) mutations. That is the reason why, in the execution Liquidity ratio measures the extent to which a of the Algorithm, this process is introduced and company can quickly liquidate assets to cover short- performs small random modifications in the term liabilities. It is calculated as follows: chromosomes of the individuals resulting from the Liquidity Ratio = (Current Assets)/(Current crossover. Liabilities) ×100% (4) When the above described operative is If the liquidity ratio is too high, company performed correctly within this evolutive process, an performance is not good due to too much cash or initial population will be improved by its successors investment on hand. When the ratio is too low, the and therefore, the best fitting individual of the last company does not have sufficient cash to settle population can be a very appropriate short-term debt. solution for the problem. 2103 | P a g e
  • 5. P.Divya, P. Ramesh Kumar / International Journal of Engineering Research and Applications (IJERA) ISSN: 2248-9622 www.ijera.com Vol. 2, Issue 5, September- October 2012, pp.2100-2105 When the input variables are determined, we can use point in using GA, which determines what a GA GA to distinguish and identify the quality of each should optimize. Since the output is some estimated investment, as illustrated in Fig. 1. The detailed investment ranking of designated testing companies, procedure is illustrated some actual investment ranking should be defined in as follows. advance for designing fitness function. Here we use annual price return (APR) to rank the listed investment and the APR is represented as where APRn is the annual price return for year n, ASPn is the annual investment price for year n. Usually, the investments with a high annual price return are regarded as good investments. With the value of APR evaluated for each of the N trading investments, they will be assigned for a ranking r ranged from 1 and N, where 1 is the highest value of the APR while N is the lowest. For convenience of comparison, the investment’s rank r should be mapped linearly into investment ranking ranged from 0 to 7 with the following equation: Fig. 1. Investment selection with genetic algorithm First of all, a population, which consists of a given number of chromosomes, is initially created Thus, the fitness function can be designed by randomly assigning “1” and “0” to all genes. In to minimize the root mean square error (RMSE) of the case of investment ranking, a gene contains only the difference between the financial indicator a single bit string for the status of input variable. derived ranking and the next year’s actual ranking The top right part of Figure 1 shows a population of all the listed companies for a particular with four chromosomes, each chromosome includes chromosome, representing by different genes. In this study, the initial population of the GA is generated by encoding four input variables. For the testing case of ROCE, we design 8 statuses representing different qualities in terms of different interval, varying from 0 (Extremely poor) After evolving the fitness of the population, the to 7 (very good). An example of encoding ROCE is best chromosomes with the highest fitness value are shown in Table 1. Other input variables are encoded selected by means of the roulette wheel. Thereby, by the same principle. That is, the binary string of a the chromosomes are allocated space on a roulette gene consists of three single bits, as illustrated by wheel proportional to their fitness and thus the Fig. 1. fittest chromosomes are more likely selected. In the Table 1. An example of encoding ROCE following crossover step, offspring chromosomes ROCE value Status Encoding are created by some crossover techniques. A so- (-∞, -30%] 0 000 called one-point crossover technique is employed, (-30%, -20%] 1 001 which randomly selects a crossover point within the (-20%,-10%] 2 010 chromosome. Then two parent chromosomes are (-10%,0%] 3 011 interchanged at this point to produce two new (0%, 10%] 4 100 offspring. After that, the chromosomes are mutated (10%, 20%] 5 101 with a probability of 0.005 per gene by randomly (20%, 30%] 6 110 changing genes from “0” to “1” and vice versa. The (30%,+∞) 7 111 mutation prevents the GA from converging too Note that 3-digit encoding is used for quickly in a small area of the search space. Finally, simplicity in this study. Of course, 4-digit encoding the final generation will be judged. If yes, then the is also adopted, but the computations will be rather optimized results are obtained. If no, then the complexity. evaluation and reproduction steps are repeated until The subsequent work is to evaluate the a certain number of generations, until a defined chromosomes generated by previous operation by a fitness or until a convergence criterion of the so-called fitness function, while the design of the population are reached. In the ideal case, all fitness function is a crucial chromosomes of the last generation have the same genes representing the optimal solution. 2104 | P a g e
  • 6. P.Divya, P. Ramesh Kumar / International Journal of Engineering Research and Applications (IJERA) ISSN: 2248-9622 www.ijera.com Vol. 2, Issue 5, September- October 2012, pp.2100-2105 Through the process of fuzzy logic and GA Fuzzy Sets and Systems, vol. 159, no. 23, optimization, the investments are ranked according pp. 3183-3200, 2008. to the fundamental financial information and price [6] HERRERA, F. and VERDEGAY, J.L. return. Investors can select the top n investments to (1996): “Genetic Algorithms and Soft construct a portfolio. Computing”, Physica-Verlag. [7] Chu, T.C. Tsao, C.T. Shiue, Y.R.: I CONCLUSION Application of Fuzzy Multiple Attribute The solutions obtained with this Fuzzy Decision Making on Company Analysis for logic and Genetic Model of portfolio selection are Stock Selection. Proceedings of Soft more correct, in our opinion, because it tries to Computing in Intelligent Systems and considerate the reality of the financial market Information Processing (1996) 509-514 without transforming it or reducing its high [8] Chen, S.H. Genetic Algorithms and complexity. Genetic Programming in Computational The fuzzy treatment of the information Finance. Kluwer Academic Publishers, allows the representation of the expected Dordrecht (2002) profitability of the assets including the risk that their [9] Holland, J. H.: Genetic Algorithms. selection bears as well as the higher yield that can Scientific American 267 (1992) 66-72 be obtained within the best situation. [10] Goldberg, D.E.: Genetic Algorithm in Also, the use of a Fuzzy logic and Genetic Search, Optimization, and Machine Algorithm allows us to include the relations between Learning. Addison-Wesley, Reading, MA the assets and the resulting modifications that such (1989) relations originate in profitabilities and expenses [11] J. Lewellen, “Predicting returns with and, therefore, complete and extend the field of financial ratio,” Journal of Financial application of the portfolio selection to the everyday Economics, vol. 74, no. 2, pp. 209-235, reality of the problem INTRODUCING A USEFUL TOOL 2004. FOR CASH MANAGEMENT .Acknowledgements [12] E. F. Fama and K. R. French, “Average An acknowledgement section may be presented returns, B/M, and share issue,” Journal of after the conclusion, if desired. Finance, vol. 63, no. 6, pp. 2971-2995, 2008. REFERENCES [13] E. Hjalmarsson, “Predicting global stock [1] BEETIS , R.A. and MAHAJAN, V. (1985): returns,” Journal of Financial and “Risk/Return Performance of Quantitative Analysis, vol. 45, no. 1, pp. DiversedFirms”, Management Science, 49-80, 2010. July, pp. 136-167. [14] M. Omran, “Linear versus non-linear [2] DAVIS, L. (1991): “Handbook of Genetic relationships between financial ratios and Algorithms”, Van Nostrand Reinhold, New stock returns: empirical evidence from York. Egyptian firms,” Review of Accounting and [3] GOLDBERG, D.E. (1989): “Genetic Finance, vol. 3, no. 2, pp. 84-102, 2004. Algorithms in Search, Optimation & [15] R. Bauer, N. Guenster, and R. Otten, Machine Learning”, Addison-Wesley, “Empirical evidence on corporate Massachusetts. governance in Europe: the effect on stock [4] B. R. Chang, “Applying nonlinear returns, firm value and performance,” generalized autoregressive conditional Journal of Asset Management, vol. 5, no. 2, heteroscedasticity to compensate ANFIS pp. 91-104, 2004. outputs tuned by adaptive support vector [16] B. A. Sensoy, “Performance evaluation regression,” Fuzzy Sets and Systems, vol. and self-designated benchmark indexes in 157, no. 13, pp. 1832-1850, 2006. the mutual fund industry,” Journal of [5] B. R. Chang, “Resolving the forecasting Financial Economics, vol. 92, no. 1, pp. problems of overshoot and volatility 25-39, 2009. clustering using ANFIS coupling nonlinear heteroscedasticity with quantum tuning,” ` 2105 | P a g e