

Recomendados
Mais conteúdo relacionado
Mais procurados
Mais procurados (20)
Semelhante a Demand analysis
Semelhante a Demand analysis (20)
Mais de Daksh Bapna
Mais de Daksh Bapna (20)
Último
Último (20)
Demand analysis
- 2. Introduction • A market economy functions through: » Demand » Supply. • Market is an arrangement by which buyers and sellers contact each other to make any transaction. • People demand goods because they satisfy their wants. • The amount of satisfaction which a person derives from consuming a commodity is called as Utility. • The greater the utility he expects from the commodity, the greater his desire for that commodity
- 3. Definition of Demand “ Quantities of a good or services that people are ready to buy at various prices within some given time period, other factors besides price held constant.” it Implies: • The consumers have a desire to purchase • Ability to pay for the goods and services. • Sometimes the quantity demanded is not necessarily equal to quantity bought by the consumer. • It is flow concept i.e- its measured by the amount the consumers wish to buy per unit of time.
- 4. The Law of Demand The Law of Demand “It expresses the functional relationship between price and quantity demanded.” • There is an inverse relationship between price and quantity demanded, If the other things being equal Other things – Taste or preferences Income Price of related goods.
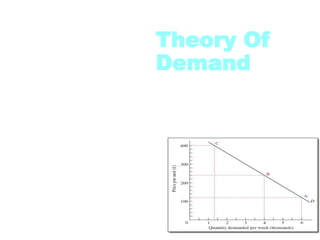
- 5. Demand Curve Demand Curve: It is graphic statement or presentation of quantities demanded by the consumer at various possible prices in a period of time. (Demand curve does not tell us the price of the product) 6 Y D PRICE & DEMAND (Rs) Quantity Demanded (Units) 5 4 2 3 5 4 PRICE Price 3 2 1 3 4 0 2 6 1 10 2 3 4 QUANTITY 6 10
- 6. Market Demand Market Demand: It is sum total of demands of all consumers in the market for a commodity at various prices. Price QD1 QD2 QD3 MD 1 16 11 15 42 2 11 7 12 30 3 7 5 10 22 4 4 4 7 15 5 2 3 5 10 6 1 2 2 5 P O a1 b1 c1 Q
- 7. Reason for the Law of Demand Why does the demand curve slope downwards? Income Effect: – With the fall in price of commodity the consumer can buy more of the commodity with his given income. – Fall in prices leads to consumers purchasing power to increase. Substitution Effect: – When the price of commodity falls it becomes relatively cheaper than other commodities. – So consumer substitute the commodity and the quantity demanded rises. No of consumer Increases: – Fall in prices leads more number of consumer to demand the commodity and hence rise in quantity demanded.
- 8. Exception to The Law of Demand 1. Veblen Effect: Conspicuous Consumption » Goods having prestige value » Some consumers measure the utility of a commodity by its price i.e greater the price , greater the utility. 2. The Giffen Case: » When the price of essential goods increases, it demands also increases. » A fall in its price, quantity demanded decreases. 3. Speculative Market » Rise in prices is followed by larger purchases and fall in price by smaller purchases.
- 9. Factors determining Demand 1. Tastes and Preferences of the consumers: Goods for which the tastes and preferences are greater , the demand would be large and demand curve will lie at a higher level. Consumers tastes keeps on changing and as result there is a change in demand for them. 2. Income of the people: Greater the income greater the demand (purchasing power) • Change in income also lead to change in demand curve for Normal and Inferior Goods
- 10. Normal and Inferior Goods D D’ D D’ P P D’ D D O Q Q’ Effect of Increase in Income on Demand for a Normal Good D’ Q’ Q Effect of Increase in Income on Demand for a Inferior Good
- 11. Factors determining Demand 3. Changes in the prices of the related Goods Demand for goods also changes with the change in prices of “other” goods a) Substitute Goods – Different goods that, at least partly, satisfy the same needs of the consumers and, therefore, can be used to replace one another. – The rise in prices causes the increase in demand of another goods – Good A is a substitute of Good B if a rise / fall in the price of good B causes increase / decrease in the demand for good A respectively.
- 12. Substitute Goods D D’ D’ D P P D D’ D O Q Q’ D’ O Q’ Q Quantity Demanded Quantity Demanded Rightward Shift with rise in price of Substitute goods Leftward Shift with fall in price of Substitute goods
- 13. Factors determining Demand b) Complementary Goods – Goods whose use is interrelated with the use of an associated or paired good such that a demand for one (tyres) generates demand for the other (gasoline). – The change in prices causes the change in demand of another goods – Good A is complement of Good B if a rise / fall in the price of good B causes decrease / increase respectively in the demand for good A
- 14. Complementary Goods D D’ D’ D P P D D’ D O Q Q’ D’ O Q’ Q Quantity Demanded Quantity Demanded Rightward ShiftFall in price of complementary goods Leftward ShiftRise in price of complementary goods
- 15. Factors determining Demand 4. The Number of Consumers in the Market. 5. Consumer Expectations 6. Greater the number of consumers of a good, greater the market demand Increase in consumers is dependent upon growth in population and exploration of new markets Demand is dependent upon what is the consumer expectation about the future. If buyers are expecting the price to increase in future, the current demand increases. Income Distribution Distribution of income in the society also effects demand If distribution is equal, the propensity to consume of the society would be high, so demand would be high.
- 16. Movement along Demand curve Extension or Contraction in Demand: • When the quantity demanded rises/ falls as a result of changes in price and we move along a given demand curve. • The other determinants remain constant. (Demand curve remain the same) • Extension : When quantity demanded rise due to fall in price. • Contraction: When quantity demanded fall due to rise in prices.
- 17. Movement along Demand curve Contraction P” Expansion P P’ O L M N As a result of changes in price of a good the consumers move along the given demand curve. The demand curve remains the same and does not change its position. A shift in demand curve happen by change in factors other than in its own price.
- 18. Shifts in Demand Shift in Demand curve: When the demand changes due to the factor other than price. a) Increase in Demand: With the other factor increasing say income, it will cause a shift in demand curve. The consumers demand more of the commodity than before D’ D P3 P2 P1 D Q1 Q2 Q3 D’
- 19. Shifts in Demand B) Decrease in Demand: It there are adverse changes in the factors It will cause a shift in demand curve to the left The consumers demand less of the commodity than before D’ D P3 P2 P1 D D’ Q3 Q2 Q1
- 20. Demand Function Qd = f ( Px, I, Pr, T, A) Where Px = Own price of the commodity X I = Income of the Individual Pr = Prices of related commodities T = Tastes and preferences of the individual consumer A = Advertising expenditure made by the producers of the product Keeping other factor as constant Qd = f (Px) It implies that quantity demanded of good X is function of its own price. Other determinants remaining constant
- 21. Demand Function • The level / position of demand curve depends on the other factors • To show how much quantity demanded changes with a unit change in price Qd = a- bPx where a= Constant intercept term on the X- axis b = Co-efficient showing the slope of the demand curve Px = Independent Variable Qd = Dependent variable
- 22. Theory Of Supply
- 23. SUPPLY • Supply refers to the schedule of the quantities of a good that the firms are able and willing to offer a various prices. How much of a commodity the firms are able to produce depends on: – The resources available – Technology they employ – Profits they expect to make
- 24. Definition of Supply “ Quantities of a good or services that people are ready to sell at various prices within some given time period, other factors besides price held constant.” • Sometimes the quantity supplied is not necessarily equal to quantity actually sold by the consumer. • It is flow concept i.e- its measured by the amount of a commodity that the firm produces and offer for sale in the market per period of time.
- 25. Supply Function Qs = S ( Px, F1, Pr, W,E ) Where Px = Own price of the commodity X F1= Price of Inputs Pr = Prices of other products related in production W = Weather, strikes and other short –run forces E = Firms expectation about future prospects for prices, cost, sales and state of economy Keeping other factor as constant Qs = f (Px)
- 26. Supply Function • The level / position of supply curve depends on the other factors • To show how much quantity supply changes with a unit change in price Qs = a + bPx where a= Constant intercept term on the X- axis b = Co-efficient showing the slope of the supply curve
- 27. The Law of Supply The Law of Supply – “It expresses the functional relationship between price and quantity demanded.” There is an direct relationship between price and quantity supplied, If the other things being equal
- 28. Supply Curve Supply Curve: It is graphic statement or presentation of quantities supplied by the firm at various possible prices in a period of time. Y 560 Price & Supply PRICE 510 500 490 480 470 100 150 200 225 QUANTITY 250 275 150 200 530 520 100 520 530 Quantity Supplied (Units) 510 540 Price (Rs) 500 550 225 540 275
- 29. Reason for the Law of Supply Why does the Supply curve slope Upwards? • Firms are driven by profit motive – Higher the price of the product, more profitable to produce them. – Greater the incentives of the firm to produce – It also depends upon possibilities of substitution – More production also leads to more profits
- 30. Factors determining Supply 1. Production Technology 2. Price of Inputs 3. Prices of Related products 4. Number of producers (or firms) 5. Future price expectations 6. Taxes and Subsidies
- 31. Shifts in Supply Shift in Supply curve: When the Supply changes due to the factor other than price. a) Increase in Supply: With the increase in other factor The producers supply more of the commodity S P3 P2 P1 Q1 Q2 Q3 S’
- 32. Shifts in Supply B) Decrease in Supply : It there are adverse changes in the factors It will cause a shift in Supply curve to the left The producers supply less of the commodity S’ S P3 P2 P1 Q1 Q2 Q3
- 33. Market Equilibrium P Surplus S P1 Shortage D Q1 Q Equilibrium Price: The price that Qd = Qs Equilibrium Quantity: The amount that people are willing to buy and seller are willing to offer. Shortage: Qd > Qs Surplus: Qd < Qs