Web & Social Media Analytics Previous Year Question Paper.pdf
Matrix-calibrated species-area model
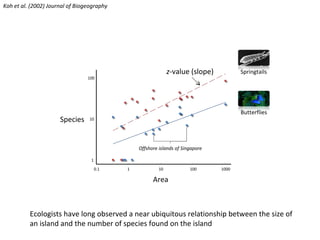
1. 0.1 1 10 100 1000 1 10 100 Area Species Offshore islands of Singapore z -value (slope) Ecologists have long observed a near ubiquitous relationship between the size of an island and the number of species found on the island Koh et al. (2002) Journal of Biogeography Springtails Butterflies
2. - Arrhenius (1920) S=cA z Area Species z This so-called species-area relationship can be described by a power model
3. Because land-use change on a mainland often creates landscapes that look like islands of forests in an ocean of other land uses…
4. S=cA z S original = c z S new A new A original ( ) ...the species-area model is often used by conservation biologists to predict biodiversity loss based upon forest loss
5. However, there are 2 problems with this approach... #1: it assumes that land uses intervening forest fragments, are completely inhospitable to any species #2: it discounts the deleterious effects on a forest fragment mediated by biophysical interactions near the interface between forest and matrix Problem #2: Edge effects Problem #1: Matrix effects
6. ( ) S=cA z S original = c z S new A new A original ( ) Koh & Ghazoul (2010) Conservation Biology Koh et al. (2010) Journal of Applied Ecology The improved model accounts for how species respond to changes in composition & quality of the matrix. It also accounts for effects of forest edges. These improvements allow for predictions of extinction risks that are specific to the landscape and the taxon of interest. Correction for forest edge effects Calibrating the slope to account for taxon-specific responses to individual components of the landscape matrix
8. When pitted against four other variants of SAMs, the MC SAM is about 13.5 times more strongly supported by the data than the next best model in our analysis--the conventional SAM.
9. A prototype of an interactive online tool developed to illustrate how the new MC model (including correction for edge-effects) could be used to predict effects of land-use change in the wider landscape. (This slide is interactive.)
10. The MC SAM has been implemented in recent studies
Notas do Editor
IMPORTANT INFORMATION ABOUT XCELSIUS CONTENT EMBEDDED INTO THIS SLIDE - PLEASE READ ON IF YOU ARE EXPERIENCING DIFFICULTIES! This PowerPoint slide has Xcelsius content embedded into it and certain restrictions apply: 1). Information message shown when you open this slide deck: "Some controls on this presentation can’t be activated. They might not be registered on this computer". You need the latest Adobe Flash Player on your machine to view the embedded Xcelsius content: a). Close PowerPoint - make sure you DO NOT SAVE this slide deck. b). Using Internet Explorer install the latest Adobe Flash Player from adobe.com c). Open this PowerPoint slide deck again. 2). A design-time thumbnail is not shown for the Xcelsius content when you open this slide deck until you enter and exit Slide Show mode. 3). Office 2007 files (.pptx) do not support Xcelsius embedded content - save as an Office 2003 file (.ppt) instead. For more information refer to the Export to Microsoft Word 2007 and PowerPoint 2007 section in the Xcelsius release notes. 4). The Xcelsius visualization shows error code messages (#2048, etc). Flash security restrictions have prevented the embedded Xcelsius content from accessing external data. To allow the Xcelsius embedded content to access external data refer to the Adobe Flash Player - Security Issues section in the Xcelsius release notes. Note: To allow embedded Xcelsius content in a PowerPoint slide you have to add POWERPNT.EXE as a trusted Adobe Flash application: Office 2003 path example - C:\\Program Files\\Microsoft Office\\OFFICE11\\POWERPNT.EXE Office 2007 path example - C:\\Program Files\\Microsoft Office\\Office12\\POWERPNT.EXE