SlideShare uma empresa Scribd logo
1 de 25
Baixar para ler offline
RSGroup LLC RSDeltabook
Overview (Getting Started)................................................................................................. 1
How to Load your Option Positions Into Deltabook .......................................................... 2
Load Position from a CSV File: (from a non network drive only)................................. 3
Loading Positions from the Clipboard............................................................................ 4
Loading Positions from a Position Input Grid................................................................ 4
Menu Structure (Horizontal Menu Bars).......................................................................... 5
Menu Structure (Vertical Menu Bars) ............................................................................... 6
Simulate Positions ( Adjust parameters in the input boxes below) .................................. 7
Option Detail................................................................................................................... 8
Risk Monitoring and P&L Changes for Portfolios and Underlyers.................................... 9
Shock Portfolio ............................................................................................................... 9
Shock Underlyer ........................................................................................................... 10
VolaTkr............................................................................................................................. 11
Hedging Capabilities......................................................................................................... 12
AcctWin (Trade Analysis)........................................................................................... 12
Intraday Hedging and Monitoring .................................................................................... 16
PremWindow (Options Portfolios and Underliers Window)....................................... 16
ShockWin...................................................................................................................... 18
Volatility Analysis and Volatility Studies ........................................................................ 20
What If Scenarios Window........................................................................................... 22
Option and Spread Pricing................................................................................................ 23
Option Worksheet......................................................................................................... 23
Glossary of Terms............................................................................................................. 24
Overview (Getting Started)
RSGroup LLC RSDeltabook
Deltabook calculates the aggregate and detailed risk of multi asset portfolios using different
display Windows along with tools to analyze volatility based trades.
Each Window has a Pop Up Menu that gives access to different functions, such as Detail,
Simulation and Shock. This application is easy to use once you understand the horizontal and
vertical pull down menus. The deltabook launch page is the first page you will see and where
you can load positions, access online help or various functions.
How to Load your Option Positions Into Deltabook
Loading positions into Deltabook is done by using the ClipBoard to Copy/Paste data from
Excel, reading from a CSV file or by using the Position Input Grid.
Deltabook is restricted from opening files located in a network directory or from opening files
that are already opened in Excel, while Copy/Paste can be used to input positions from any open
file.
RSGroup LLC RSDeltabook
The Load Position choices are as follows.
Load Position from CSV file
Load Position from Clipboard
Load Sample Position
Positon Input Grid
Load Position from a CSV File: (from a non network drive only)
Typically a csv file that was generated by the clearing broker. Note Bloomberg does not allow
the user to load files from a network drive. If you are using a network drive you should Load
Position from Clipboard.
When loading positions from a CSV file, the data columns must be labeled (not case sensitive)
using the labels:. SpotTkr Strike ExpDate Type OptTkr if option data is provided by
spot, strike, expiration and type or OptTkr if the option ticker is known.
Examples of acceptable formats
Copying Positions from the Clipboard
When copying data from the ClipBoard, the data does not have to be labeled and can be
Copy/Pasted directly into the Position Input Grid.
SpotTkr Strike ExpDate Type Symbol
SPY 200 9/11/15 C SPY 9/11/15 200C
SpotTkr Symbol
SPY SPY 9/11/15 200C
RSGroup LLC RSDeltabook
Loading Positions from the Clipboard
In order to load positions from the clipboard, the first step is to copy the positions from an Excel
file to the clipboard. Select the region of the excel file where the position data is located or else
hit Ctrl-A to highlight the entire page then Ctrl-C in order to copy contents of file to the
clipboard.
Then using the deltabook menu above, select Load Position from the Clipboard.
This method will typically be the fastest, as new broker files are generated during the day
reflecting changes to the position.
When loading positions from a CSV file or the ClipBoard, the columns containing your position
data must be labeled, but when copying from the Clipboard, the data columns do not have to be
labeled, since in this case you are pasting the data into the correct Input Grid Columns.
When your data is not labeled, the easiest way to import your data is via the InputGrid using
Copy/Paste from Excel into the Grid.
Loading Positions from a Position Input Grid
(c) Positions may be entered directly into a Position Input Grid by using copy Ctrl-C
(Copy) from an Excel or Csv File and then Paste, or by typing the data into the grid
The Position Input Grid has 6 input Fields. Positions are entered by either supplying Symbol
or by supplying for options Spot,Strike, ExpDate,Type along with the quantity traded
(contracts for options and shares for stocks). Option Symbols can be entered in various
formats:
When Pasting Positions into Deltabook from Excel, it is convenient if your spreadsheet has 2
adjacent columns with the Symbol in the left column and the quantity in the right column because
those two columns can be selected using Copy, and then Paste the Symbol,Quantity pair directly
into the Input Grid.
Spot (Tkr) Strike ExpDate Type Symbol TrShares
SPY 200 9/11/15 C SPY 9/11/15 200C 10
GOOG-03/18/2016-C645 Standard format dash
XME 10162015 P 22 net 360 format
SPY150930C00190000 finance.yahoo.com format
AMZN1502J535 CALL AMZN 535.00 EXP 10-02-15 Merryl Lynch format
SPY 10/2/15 190C Standard space Strike,Type
SPY 10/2/15 C190 Standard space Type,Strike
RSGroup LLC RSDeltabook
A spot position is entered by supplying the SpotTkr or Symbol and TrShares with a short
position entered as a negative number.
Once the grid has been populated, the positions are created by clicking on the Accept button on
top or by the right clicking in a cell to bring up the PopUp Menu choice Accept. Each way brings
up 2 choices
1. NewPositionFromGrid removes any existing positions that have already been loaded
into RS Deltabook and enters new positions from each populated row in the grid.
2. Additional TradesFromGrid adds the new positions without deleting existing positions
which provides a way to enter new trades without having to load an entirely new position
file.
Menu Structure (Horizontal Menu Bars)
TradeAnalysisMenuBar (ActWin)
Quit Help QuoteWin Option HedgeType SimPos Font
Spot Positions UseImpliedSkew
Option WorkSheet UseMySkew
VolaWindow UseHedgeVol
Expiring
InTheMoney
ShockMatrixMenuBar (Thisisanimpact inpositionP&Lmatrixfor parrallel shiftsinpricesandvolatility)
Quit Help QuoteWin Option Shock_matrix Font
Spot WorkSheet
Option VolaWindow
Expiring
InTheMoney
What If Scenarios
Quit Help SimPos Font
NOTE:
Thisresultant sheet isbasedonparalell price/ volatilityshifts
acrossassets
OptionPortfoliosandUnderliers
Quit Help QuoteWin Option SimPos Font
Spot WorkSheet
Option VolaWindow
Expiring
InTheMoney
VolatilityStudies (VolaWin)
Quit Help VolaStudy Font
OptionTesting
Quit Help QuoteWin Option SimPos Font
Spot WorkSheet
Option VolaWindow
Expiring
InTheMoney
RSGroup LLC RSDeltabook
The horizontal menus above provide a navigational map to the various windows
the application provides. Each selection will load a different window.
Menu Structure (Vertical Menu Bars)
Simulate_Position Simulate positon by adusting PrcPct, VolPct and DaysFwd
parameters Hit SimPos to recalculate
Option_Detail This provides detailed breakdown of a all the options for
an underlying ticker
Refresh_Action Refresh all prices
Shock_Position This is the same as the Shock Matrix Window and Shocks
the entire portfolio in paralell shifts
Shock_Underlyer This is the same as the Shock Matrix Window except
that it only shocks one particular underlyer
Vola_Tkr Price and volatility chart for a given ticker
Acct_Window Same as Acct_Win (Trade Analysis Window) showing all
positions in the portfolio with inputs
WorkSheet Creates Options and Spreads in a Worksheet
Rate_Curve Rate Curve
PasteSkew Paste User defined skew from the clipboard
UseImpliedSkew Options are priced off the implied skew as determined by
market prices
UseMySkew User can set his own skew. Note user can copy and store
many skews into a spreadsheet
UseHedgeVol Use hedge vols to price options as defined by user in the
Vola Win Table
Quote Window Price Quote window for all underlying tickers in the portfolio
SaveGridToFile This allows user to save grid highlighted on the window
to a spreadsheet
DivWin Contains all underlyer dividends
CopyCells Once a range of cells have been highlighted they can be copied
using copy cells and pasted into a spreadsheet or csv file
Help Help FAQ
RSGroup LLC RSDeltabook
Simulate Positions ( Adjust parameters in the input boxes below)
SimPos------ Simulate the position by adjusting any of the parameters
PrcPct VolPct and DaysFwd
PrcPct: the position will be adjusted by changing each spot ticker by the given percentage
change in spot price.
VolPct:: Adjust option volatilities by this percentage. eg VolPct set to 10% will change an
option with theoretical volatility of 20% to 22%
RSGroup LLC RSDeltabook
DaysFwd: Moves the position forward in time for a positive value and backwards (for a
negative value) the given number of days (which can be set to be a fraction). Set DaysFwd to 1,
to see your risk one day in the future. On Expiration day, DaysFwd might be set to 0.5 by the
middle of the trading day. Every option has a parameter which is the number of volatility days
until expiration. Days Fwd adjusts this parameter. When the number of volatility days is -1.0
(corresponding to the day after expiration the option value is calculated as intrinsic price, with the
corresponding delta being 1, 0 or -1 and all other risk parameters are 0.
When volatility days are more than one day negative, (corresponding to an expired option then
all option parameters are set to 0. By moving DaysFwd past an expiration date you can determine
your remaining net position after accounting for all expiring options.
Option Detail (Example of all the options under the ticker BIDU for a given
portfolio)
RSGroup LLC RSDeltabook
Risk Monitoring and P&L Changes for Portfolios and
Underlyers
Shock Portfolio Shock the entire portfolio by the same percentage shift for each spot
ticker using the parameters in the input boxes.
This creates a parallel shift for all tickers of the portfolio. PrcLimit% and VolLimit%
specifies maximum move up or down in price and volatility (eg 10% means 10% up and
10% down) and this grid of theoretical P&Ls are used to create the Shock Matrix.
RSGroup LLC RSDeltabook
Shock Underlyer Shock a single spot Ticker by percentage price and volatility
changes. The input boxes determine the maximum range.
RSGroup LLC RSDeltabook
VolaTkr Generate a Graph of Price and Rolling Historical Volatility
RSGroup LLC RSDeltabook
Hedging Capabilities
AcctWin (Trade Analysis)
AcctWin displays every position in a given portfolio and P&L marks. (PriorMark is the closing
mark from the previous trading day). For options, the grid will show each input used for option
evaluation such as VolaTkr (hedge volatility), dividend rate to expiration, finance rate used to
calculate forward price.
AcctWin Menu Bar consists of:
Quit Help QuoteWin Option HedgeType SimPos Font
Spot Positions UseImpliedSkew
Option WorkSheet UseMySkew
VolaWindow UseHedgeVol
Expiring
InTheMoney
RSGroup LLC RSDeltabook
In the account window we can use three types of volatility skews:
1. A single hedge volatility,
2. Implied skews using implied volatility generated by market prices,
3. User defined skews.
The user can store many skews in a spreadsheet or csv file and access a particular skew
as follows.
Step 1 Highlight Stored Skews in the spreadsheet that you want to use and press CTRL-
C this copies the cells to the clipboard.
Step 2 In Acctwin , select PasteSkew from the Vertical pull down menu which copies the
user defined skew from the ClipBoard and re-prices all the options accordingly.
Step 1
RSGroup LLC RSDeltabook
To copy a skew from Account Window to a spreadsheet.
Step 1 Highlight Ticker and SkewVols in Account Window that you want to use and
select the highlighted range will turn blue
Step 2 Select CopyCells from the vertical menu and use Paste or PasteSpecial to copy to
an Excel Workbook, Save to Store.
RSGroup LLC RSDeltabook
Earnings report dates are typically important, in that volatility tends to increase prior to
a earnings date to reflect the resultant change in the spot price after an earnings report is
released.
ExDividend dates are important, because the cost or profit of hedging will be adjusted
by the dividend of the underlying shares in the portfolio.
Deltabook allows you to see when earnings are reported or when spot tickers go
ExDividend and to filter your position or quoted securities by earnings or dividends that
fall within a number of days. The Dividend Window (DivWin) will show you Earnings
Dates, Implied Earning Movement, ExDividend dates, dividend amounts.
Changing the DaysToEarning and DaysToDividend will filter the Dividend Window to
display only those securities, having earning days or ex dividend dates that fall within
the chosen number of days.
RSGroup LLC RSDeltabook
Intraday Hedging and Monitoring
PremWindow (Options Portfolios and Underliers Window)
PremWin displays the aggregate risk of the portfolio priced at the spot levels shown.
PremWin Menu Bar consists of the following items
Option Portfolios and Underliers
Quit Help QuoteWin Option SimPos Font
Spot WorkSheet
Option VolaWindow
Expiring
InTheMoney
RSGroup LLC RSDeltabook
Note by pointing to a particular ticker in the left hand column and highlighting launches the
vertical menu as shown.
QuoteWin ----- [Spot Option]
Choosing Spot displays the spot tickers for each position in the portfolio. Tickers can
also be Copied and Paste into Deltabook from Excel allowing the user to see market quotes,
earnings dates and estimates along with ExDividend Dates and Dividend amounts.
Choosing Option displays the option tickers for all positions in the portfolio.
To view a current quote on a new security that is not already shown, you can do so by
typing its symbol into the Symbol field.
Option----[WorkSheet VolaWindow]
Worksheet allows for the creation of options useful in the analysis
of option spreads. (this will be discussed further down).
Options are entered by either supplying the OptTkr or by supplying values for the 4 fields
Spot, ExpDate, Strike, Type
AMZN 08/21/2015 530 C
MU 10/16/2015 24 C
RSGroup LLC RSDeltabook
Once an option is identified, the other Worksheet fields will be calculated.
Deltabook will request new security prices every 2 minutes, and all risk parameters are
recalculated whenever prices change. The menu item RefreshPrice will retrieve the current
market prices for every security in the portfolio and in the QuoteWin List.
SimPos-------- Allows position to be Simulated by adjusting parameters
ShockWin (Shock)
ShockMatrixMenuBar (ThisisanimpactinpositionP&Lmatrixforparrallelshiftsinpricesandvolatility)
Quit Help QuoteWin Option Shock_matrix Font
Spot WorkSheet
Option VolaWindow
Expiring
InTheMoney
RSGroup LLC RSDeltabook
In order to shock the entire portfolio over a range of Price and Volatility changes, adjust PrcPct
and VolLimit . The Columns box is used to set the granularity of the price percentage change
eg Cols=10 divides a 10% Up and Down Price change simulation into columns with 5 negative
price changes and 5 columns of positive price change.
Choosing Shock_Matrix refreshes the shock grid with the calculated P&Ls for the associated
shifts.
Note all other MenuBar buttons are the same as in PremWin
RSGroup LLC RSDeltabook
Volatility Analysis and Volatility Studies (Price and Rolling
Historical Vol Study)
Quit Help VolaStudy Font 
User Enters Hedge volatilities in the table below.
To perform a volatility study adjust the parameters
VolaTkr, Sample Size, Begin Date and End Date.
In the example below we calculate volatility of Tkr SPY based on rolling 20 trading day
windows beginning on 10/01/2015 and ending on 9/30/2016. Hit the VolaStudy on the
menu bar to re-calculate.
A VolaStudy consists of a graph of price and volatility and a frequency histogram.
RSGroup LLC RSDeltabook
The Grid Matrix above is used to enter option input parameters. Note that Vola is a
column of historical vols. The Implied Volatilities are calculated based on the option
market values.
RSGroup LLC RSDeltabook
Risk Monitoring and P&L Changes over Time
What If Scenarios Window
Quit Help SimPos Font
NOTE:
This resultant sheet is based on paralell price/ volatility shifts
across assets
Change PrcPct Vol Pct and DaysFwd parameters and hit SimPos (simulate position)
Evaluates the portfolio in accordance with parallel shifts in PrcPct (price percentage) and
VolPct (volatility percentage)
DaysFwd adjust the option volaility days to a lower value (into the future) or backwards (by
increasing the value)
RSGroup LLC RSDeltabook
Option and Spread Pricing (Create Option for analysis of option
spreads)
Quit Help QuoteWin Option SimPos Font
Spot WorkSheet
Option VolaWindow
Expiring
InTheMoney
Worksheet allows for the creation of options useful in the analyzing of spreads
Option Worksheet
Options are entered by supplying either OptTkr or by supplying values for
TKR MM/DD/YY Strike Type
Spread analysis is simplified by
grouping the option legs together in
this spreadsheet.
The spreadsheet then populates the other columns automatically so the spread can be examined.
SPY 09/18/2015 195 Call
SPY 09/18/2015 195 Put
RSGroup LLC RSDeltabook
Glossary of Terms
The Qtime column displays the time that the security was last priced.
Spot Spot Ticker
SpotPrc Price of Spot Ticker
TrShares Quantity of shares for each position.
The number of shares can be changed by typing in a new number of
shares.
NetShares Calculated as TrShares - Qdelta
Columns starting with the letter ""Q"" all relate to option Quantities.
Qdelta the total delta resulting from aggregating the individual option deltas for a
given spot.
Qgamma aggregate gamma,
Qvega aggregate vega.
QTheta aggregate theta.
$Gamma1% $change in the position for a 1% move in underlyer. (ie the $Net will
change by approx $Gamma1% if the spot price changes by 1%)
P&L P&L of the position calculated as the number of shares x (Mark -
PriorMark).
FairP&L P&L of the position calculated as the number of shares x (Prem- Mark)
and correponds to the theoretical edge of your portfolio. The theoretical
edge, is the P&L you presume to realize if the position trades at your
hedge volatilities.
Deltabook supports 3 different hedging methods for assigning volatility to individual
options:
1. Each underlyer can have a single theoretical hedge volatility.
2. Each option can have its own hedge volatility (user skew)
3. Each option can be hedged at is implied volatility (implied skew)
RSGroup LLC RSDeltabook
ShockWin calculates changes to portfolio or SpotTkr P&L over a range of percent
changes in price and volatility so that you can quickly see where your risk is the largest
and smallest. Shock can be run for either a portfolio or for an individual underlyer.
Vola_tkr MenuItem displays a graph of price and volatility for the underlyer in the
current row. It also calculates a frequency histogram indicating the distribution of
historical volatilities.
OptionDetail MenuItem displays the individual option position for the current underlyer.
RateCurve displays the financing curve that is used to calculate forward prices. It is
initialized on startup to the financing rates implied by the values of certain
Fed Funds future contracts.
Applying the ReCalc button in the rate curve grid will cause all options to
reevaluate using the updated values from the rate curve.

Mais conteúdo relacionado

Destaque (6)

2okviveiro 140417211852-phpapp02
2okviveiro 140417211852-phpapp022okviveiro 140417211852-phpapp02
2okviveiro 140417211852-phpapp02
 
Consierge(draft)
Consierge(draft)Consierge(draft)
Consierge(draft)
 
Procesos cognitivos
Procesos cognitivosProcesos cognitivos
Procesos cognitivos
 
Prolocomico
ProlocomicoProlocomico
Prolocomico
 
Palestra
PalestraPalestra
Palestra
 
Consolidacion final aprendizaje
Consolidacion final aprendizajeConsolidacion final aprendizaje
Consolidacion final aprendizaje
 

Semelhante a BloombergAppHelp2015

Training Storyboard
Training StoryboardTraining Storyboard
Training Storyboardhaven832
 
14 mass data engineering v1.00_en
14 mass data engineering v1.00_en14 mass data engineering v1.00_en
14 mass data engineering v1.00_enconfidencial
 
Simplifying SQL with CTE's and windowing functions
Simplifying SQL with CTE's and windowing functionsSimplifying SQL with CTE's and windowing functions
Simplifying SQL with CTE's and windowing functionsClayton Groom
 
Bis 345-final-exam-guide-set-1-new
Bis 345-final-exam-guide-set-1-newBis 345-final-exam-guide-set-1-new
Bis 345-final-exam-guide-set-1-newassignmentcloud85
 
Topo Planner for AutoCAD
Topo Planner for AutoCADTopo Planner for AutoCAD
Topo Planner for AutoCADNovatronix
 
Web Developer make the most out of your Database !
Web Developer make the most out of your Database !Web Developer make the most out of your Database !
Web Developer make the most out of your Database !Jean-Marc Desvaux
 
Maryna Popova "Deep dive AWS Redshift"
Maryna Popova "Deep dive AWS Redshift"Maryna Popova "Deep dive AWS Redshift"
Maryna Popova "Deep dive AWS Redshift"Lviv Startup Club
 
The ultimate-guide-to-sql
The ultimate-guide-to-sqlThe ultimate-guide-to-sql
The ultimate-guide-to-sqlMcNamaraChiwaye
 
Coord transform 082014
Coord transform 082014Coord transform 082014
Coord transform 082014PramodPandit9
 
Workshop10 creep-jop
Workshop10 creep-jopWorkshop10 creep-jop
Workshop10 creep-jopmmd110
 
Triggers
TriggersTriggers
Triggerswork
 
M|18 Ingesting Data with the New Bulk Data Adapters
M|18 Ingesting Data with the New Bulk Data AdaptersM|18 Ingesting Data with the New Bulk Data Adapters
M|18 Ingesting Data with the New Bulk Data AdaptersMariaDB plc
 
Concrete bent with_nonprismatic_cap_beam
Concrete bent with_nonprismatic_cap_beamConcrete bent with_nonprismatic_cap_beam
Concrete bent with_nonprismatic_cap_beamubaidinfo
 

Semelhante a BloombergAppHelp2015 (20)

Training Storyboard
Training StoryboardTraining Storyboard
Training Storyboard
 
14 mass data engineering v1.00_en
14 mass data engineering v1.00_en14 mass data engineering v1.00_en
14 mass data engineering v1.00_en
 
SAS Proc SQL
SAS Proc SQLSAS Proc SQL
SAS Proc SQL
 
Simulink
SimulinkSimulink
Simulink
 
Simplifying SQL with CTE's and windowing functions
Simplifying SQL with CTE's and windowing functionsSimplifying SQL with CTE's and windowing functions
Simplifying SQL with CTE's and windowing functions
 
Bis 345-final-exam-guide-set-1-new
Bis 345-final-exam-guide-set-1-newBis 345-final-exam-guide-set-1-new
Bis 345-final-exam-guide-set-1-new
 
Topo Planner for AutoCAD
Topo Planner for AutoCADTopo Planner for AutoCAD
Topo Planner for AutoCAD
 
Axis vm stepbystep
Axis vm stepbystepAxis vm stepbystep
Axis vm stepbystep
 
AUTOCAD RAHUL
AUTOCAD  RAHULAUTOCAD  RAHUL
AUTOCAD RAHUL
 
Web Developer make the most out of your Database !
Web Developer make the most out of your Database !Web Developer make the most out of your Database !
Web Developer make the most out of your Database !
 
Maryna Popova "Deep dive AWS Redshift"
Maryna Popova "Deep dive AWS Redshift"Maryna Popova "Deep dive AWS Redshift"
Maryna Popova "Deep dive AWS Redshift"
 
The ultimate-guide-to-sql
The ultimate-guide-to-sqlThe ultimate-guide-to-sql
The ultimate-guide-to-sql
 
Basic Analysis using Python
Basic Analysis using PythonBasic Analysis using Python
Basic Analysis using Python
 
Coord transform 082014
Coord transform 082014Coord transform 082014
Coord transform 082014
 
Workshop10 creep-jop
Workshop10 creep-jopWorkshop10 creep-jop
Workshop10 creep-jop
 
Triggers
TriggersTriggers
Triggers
 
M|18 Ingesting Data with the New Bulk Data Adapters
M|18 Ingesting Data with the New Bulk Data AdaptersM|18 Ingesting Data with the New Bulk Data Adapters
M|18 Ingesting Data with the New Bulk Data Adapters
 
DMAP Tutorial
DMAP TutorialDMAP Tutorial
DMAP Tutorial
 
Concrete bent with_nonprismatic_cap_beam
Concrete bent with_nonprismatic_cap_beamConcrete bent with_nonprismatic_cap_beam
Concrete bent with_nonprismatic_cap_beam
 
Using matlab simulink
Using matlab simulinkUsing matlab simulink
Using matlab simulink
 

Mais de Brian Crone

Technical Flowchart Client X
Technical Flowchart Client XTechnical Flowchart Client X
Technical Flowchart Client XBrian Crone
 
RSdeltabookexamples
RSdeltabookexamplesRSdeltabookexamples
RSdeltabookexamplesBrian Crone
 
RSDeltabookforthecloud
RSDeltabookforthecloudRSDeltabookforthecloud
RSDeltabookforthecloudBrian Crone
 
Axcellerator spreadsheet (2)
Axcellerator spreadsheet (2)Axcellerator spreadsheet (2)
Axcellerator spreadsheet (2)Brian Crone
 
Etf alpha modelsjune2013summary
Etf alpha modelsjune2013summaryEtf alpha modelsjune2013summary
Etf alpha modelsjune2013summaryBrian Crone
 
Strategy presentationmar2012
Strategy presentationmar2012Strategy presentationmar2012
Strategy presentationmar2012Brian Crone
 
Strategy presentationmar2012
Strategy presentationmar2012Strategy presentationmar2012
Strategy presentationmar2012Brian Crone
 
Strategy presentationmar2012
Strategy presentationmar2012Strategy presentationmar2012
Strategy presentationmar2012Brian Crone
 
Strategy Presentation
Strategy PresentationStrategy Presentation
Strategy PresentationBrian Crone
 

Mais de Brian Crone (10)

Technical Flowchart Client X
Technical Flowchart Client XTechnical Flowchart Client X
Technical Flowchart Client X
 
RSdeltabookexamples
RSdeltabookexamplesRSdeltabookexamples
RSdeltabookexamples
 
RSDeltabookforthecloud
RSDeltabookforthecloudRSDeltabookforthecloud
RSDeltabookforthecloud
 
Trade mind
Trade mindTrade mind
Trade mind
 
Axcellerator spreadsheet (2)
Axcellerator spreadsheet (2)Axcellerator spreadsheet (2)
Axcellerator spreadsheet (2)
 
Etf alpha modelsjune2013summary
Etf alpha modelsjune2013summaryEtf alpha modelsjune2013summary
Etf alpha modelsjune2013summary
 
Strategy presentationmar2012
Strategy presentationmar2012Strategy presentationmar2012
Strategy presentationmar2012
 
Strategy presentationmar2012
Strategy presentationmar2012Strategy presentationmar2012
Strategy presentationmar2012
 
Strategy presentationmar2012
Strategy presentationmar2012Strategy presentationmar2012
Strategy presentationmar2012
 
Strategy Presentation
Strategy PresentationStrategy Presentation
Strategy Presentation
 

BloombergAppHelp2015

  • 1. RSGroup LLC RSDeltabook Overview (Getting Started)................................................................................................. 1 How to Load your Option Positions Into Deltabook .......................................................... 2 Load Position from a CSV File: (from a non network drive only)................................. 3 Loading Positions from the Clipboard............................................................................ 4 Loading Positions from a Position Input Grid................................................................ 4 Menu Structure (Horizontal Menu Bars).......................................................................... 5 Menu Structure (Vertical Menu Bars) ............................................................................... 6 Simulate Positions ( Adjust parameters in the input boxes below) .................................. 7 Option Detail................................................................................................................... 8 Risk Monitoring and P&L Changes for Portfolios and Underlyers.................................... 9 Shock Portfolio ............................................................................................................... 9 Shock Underlyer ........................................................................................................... 10 VolaTkr............................................................................................................................. 11 Hedging Capabilities......................................................................................................... 12 AcctWin (Trade Analysis)........................................................................................... 12 Intraday Hedging and Monitoring .................................................................................... 16 PremWindow (Options Portfolios and Underliers Window)....................................... 16 ShockWin...................................................................................................................... 18 Volatility Analysis and Volatility Studies ........................................................................ 20 What If Scenarios Window........................................................................................... 22 Option and Spread Pricing................................................................................................ 23 Option Worksheet......................................................................................................... 23 Glossary of Terms............................................................................................................. 24 Overview (Getting Started)
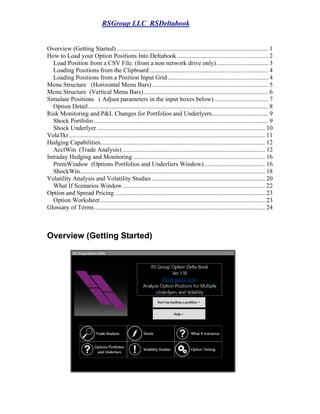
  • 2. RSGroup LLC RSDeltabook Deltabook calculates the aggregate and detailed risk of multi asset portfolios using different display Windows along with tools to analyze volatility based trades. Each Window has a Pop Up Menu that gives access to different functions, such as Detail, Simulation and Shock. This application is easy to use once you understand the horizontal and vertical pull down menus. The deltabook launch page is the first page you will see and where you can load positions, access online help or various functions. How to Load your Option Positions Into Deltabook Loading positions into Deltabook is done by using the ClipBoard to Copy/Paste data from Excel, reading from a CSV file or by using the Position Input Grid. Deltabook is restricted from opening files located in a network directory or from opening files that are already opened in Excel, while Copy/Paste can be used to input positions from any open file.
  • 3. RSGroup LLC RSDeltabook The Load Position choices are as follows. Load Position from CSV file Load Position from Clipboard Load Sample Position Positon Input Grid Load Position from a CSV File: (from a non network drive only) Typically a csv file that was generated by the clearing broker. Note Bloomberg does not allow the user to load files from a network drive. If you are using a network drive you should Load Position from Clipboard. When loading positions from a CSV file, the data columns must be labeled (not case sensitive) using the labels:. SpotTkr Strike ExpDate Type OptTkr if option data is provided by spot, strike, expiration and type or OptTkr if the option ticker is known. Examples of acceptable formats Copying Positions from the Clipboard When copying data from the ClipBoard, the data does not have to be labeled and can be Copy/Pasted directly into the Position Input Grid. SpotTkr Strike ExpDate Type Symbol SPY 200 9/11/15 C SPY 9/11/15 200C SpotTkr Symbol SPY SPY 9/11/15 200C
  • 4. RSGroup LLC RSDeltabook Loading Positions from the Clipboard In order to load positions from the clipboard, the first step is to copy the positions from an Excel file to the clipboard. Select the region of the excel file where the position data is located or else hit Ctrl-A to highlight the entire page then Ctrl-C in order to copy contents of file to the clipboard. Then using the deltabook menu above, select Load Position from the Clipboard. This method will typically be the fastest, as new broker files are generated during the day reflecting changes to the position. When loading positions from a CSV file or the ClipBoard, the columns containing your position data must be labeled, but when copying from the Clipboard, the data columns do not have to be labeled, since in this case you are pasting the data into the correct Input Grid Columns. When your data is not labeled, the easiest way to import your data is via the InputGrid using Copy/Paste from Excel into the Grid. Loading Positions from a Position Input Grid (c) Positions may be entered directly into a Position Input Grid by using copy Ctrl-C (Copy) from an Excel or Csv File and then Paste, or by typing the data into the grid The Position Input Grid has 6 input Fields. Positions are entered by either supplying Symbol or by supplying for options Spot,Strike, ExpDate,Type along with the quantity traded (contracts for options and shares for stocks). Option Symbols can be entered in various formats: When Pasting Positions into Deltabook from Excel, it is convenient if your spreadsheet has 2 adjacent columns with the Symbol in the left column and the quantity in the right column because those two columns can be selected using Copy, and then Paste the Symbol,Quantity pair directly into the Input Grid. Spot (Tkr) Strike ExpDate Type Symbol TrShares SPY 200 9/11/15 C SPY 9/11/15 200C 10 GOOG-03/18/2016-C645 Standard format dash XME 10162015 P 22 net 360 format SPY150930C00190000 finance.yahoo.com format AMZN1502J535 CALL AMZN 535.00 EXP 10-02-15 Merryl Lynch format SPY 10/2/15 190C Standard space Strike,Type SPY 10/2/15 C190 Standard space Type,Strike
  • 5. RSGroup LLC RSDeltabook A spot position is entered by supplying the SpotTkr or Symbol and TrShares with a short position entered as a negative number. Once the grid has been populated, the positions are created by clicking on the Accept button on top or by the right clicking in a cell to bring up the PopUp Menu choice Accept. Each way brings up 2 choices 1. NewPositionFromGrid removes any existing positions that have already been loaded into RS Deltabook and enters new positions from each populated row in the grid. 2. Additional TradesFromGrid adds the new positions without deleting existing positions which provides a way to enter new trades without having to load an entirely new position file. Menu Structure (Horizontal Menu Bars) TradeAnalysisMenuBar (ActWin) Quit Help QuoteWin Option HedgeType SimPos Font Spot Positions UseImpliedSkew Option WorkSheet UseMySkew VolaWindow UseHedgeVol Expiring InTheMoney ShockMatrixMenuBar (Thisisanimpact inpositionP&Lmatrixfor parrallel shiftsinpricesandvolatility) Quit Help QuoteWin Option Shock_matrix Font Spot WorkSheet Option VolaWindow Expiring InTheMoney What If Scenarios Quit Help SimPos Font NOTE: Thisresultant sheet isbasedonparalell price/ volatilityshifts acrossassets OptionPortfoliosandUnderliers Quit Help QuoteWin Option SimPos Font Spot WorkSheet Option VolaWindow Expiring InTheMoney VolatilityStudies (VolaWin) Quit Help VolaStudy Font OptionTesting Quit Help QuoteWin Option SimPos Font Spot WorkSheet Option VolaWindow Expiring InTheMoney
  • 6. RSGroup LLC RSDeltabook The horizontal menus above provide a navigational map to the various windows the application provides. Each selection will load a different window. Menu Structure (Vertical Menu Bars) Simulate_Position Simulate positon by adusting PrcPct, VolPct and DaysFwd parameters Hit SimPos to recalculate Option_Detail This provides detailed breakdown of a all the options for an underlying ticker Refresh_Action Refresh all prices Shock_Position This is the same as the Shock Matrix Window and Shocks the entire portfolio in paralell shifts Shock_Underlyer This is the same as the Shock Matrix Window except that it only shocks one particular underlyer Vola_Tkr Price and volatility chart for a given ticker Acct_Window Same as Acct_Win (Trade Analysis Window) showing all positions in the portfolio with inputs WorkSheet Creates Options and Spreads in a Worksheet Rate_Curve Rate Curve PasteSkew Paste User defined skew from the clipboard UseImpliedSkew Options are priced off the implied skew as determined by market prices UseMySkew User can set his own skew. Note user can copy and store many skews into a spreadsheet UseHedgeVol Use hedge vols to price options as defined by user in the Vola Win Table Quote Window Price Quote window for all underlying tickers in the portfolio SaveGridToFile This allows user to save grid highlighted on the window to a spreadsheet DivWin Contains all underlyer dividends CopyCells Once a range of cells have been highlighted they can be copied using copy cells and pasted into a spreadsheet or csv file Help Help FAQ
  • 7. RSGroup LLC RSDeltabook Simulate Positions ( Adjust parameters in the input boxes below) SimPos------ Simulate the position by adjusting any of the parameters PrcPct VolPct and DaysFwd PrcPct: the position will be adjusted by changing each spot ticker by the given percentage change in spot price. VolPct:: Adjust option volatilities by this percentage. eg VolPct set to 10% will change an option with theoretical volatility of 20% to 22%
  • 8. RSGroup LLC RSDeltabook DaysFwd: Moves the position forward in time for a positive value and backwards (for a negative value) the given number of days (which can be set to be a fraction). Set DaysFwd to 1, to see your risk one day in the future. On Expiration day, DaysFwd might be set to 0.5 by the middle of the trading day. Every option has a parameter which is the number of volatility days until expiration. Days Fwd adjusts this parameter. When the number of volatility days is -1.0 (corresponding to the day after expiration the option value is calculated as intrinsic price, with the corresponding delta being 1, 0 or -1 and all other risk parameters are 0. When volatility days are more than one day negative, (corresponding to an expired option then all option parameters are set to 0. By moving DaysFwd past an expiration date you can determine your remaining net position after accounting for all expiring options. Option Detail (Example of all the options under the ticker BIDU for a given portfolio)
  • 9. RSGroup LLC RSDeltabook Risk Monitoring and P&L Changes for Portfolios and Underlyers Shock Portfolio Shock the entire portfolio by the same percentage shift for each spot ticker using the parameters in the input boxes. This creates a parallel shift for all tickers of the portfolio. PrcLimit% and VolLimit% specifies maximum move up or down in price and volatility (eg 10% means 10% up and 10% down) and this grid of theoretical P&Ls are used to create the Shock Matrix.
  • 10. RSGroup LLC RSDeltabook Shock Underlyer Shock a single spot Ticker by percentage price and volatility changes. The input boxes determine the maximum range.
  • 11. RSGroup LLC RSDeltabook VolaTkr Generate a Graph of Price and Rolling Historical Volatility
  • 12. RSGroup LLC RSDeltabook Hedging Capabilities AcctWin (Trade Analysis) AcctWin displays every position in a given portfolio and P&L marks. (PriorMark is the closing mark from the previous trading day). For options, the grid will show each input used for option evaluation such as VolaTkr (hedge volatility), dividend rate to expiration, finance rate used to calculate forward price. AcctWin Menu Bar consists of: Quit Help QuoteWin Option HedgeType SimPos Font Spot Positions UseImpliedSkew Option WorkSheet UseMySkew VolaWindow UseHedgeVol Expiring InTheMoney
  • 13. RSGroup LLC RSDeltabook In the account window we can use three types of volatility skews: 1. A single hedge volatility, 2. Implied skews using implied volatility generated by market prices, 3. User defined skews. The user can store many skews in a spreadsheet or csv file and access a particular skew as follows. Step 1 Highlight Stored Skews in the spreadsheet that you want to use and press CTRL- C this copies the cells to the clipboard. Step 2 In Acctwin , select PasteSkew from the Vertical pull down menu which copies the user defined skew from the ClipBoard and re-prices all the options accordingly. Step 1
  • 14. RSGroup LLC RSDeltabook To copy a skew from Account Window to a spreadsheet. Step 1 Highlight Ticker and SkewVols in Account Window that you want to use and select the highlighted range will turn blue Step 2 Select CopyCells from the vertical menu and use Paste or PasteSpecial to copy to an Excel Workbook, Save to Store.
  • 15. RSGroup LLC RSDeltabook Earnings report dates are typically important, in that volatility tends to increase prior to a earnings date to reflect the resultant change in the spot price after an earnings report is released. ExDividend dates are important, because the cost or profit of hedging will be adjusted by the dividend of the underlying shares in the portfolio. Deltabook allows you to see when earnings are reported or when spot tickers go ExDividend and to filter your position or quoted securities by earnings or dividends that fall within a number of days. The Dividend Window (DivWin) will show you Earnings Dates, Implied Earning Movement, ExDividend dates, dividend amounts. Changing the DaysToEarning and DaysToDividend will filter the Dividend Window to display only those securities, having earning days or ex dividend dates that fall within the chosen number of days.
  • 16. RSGroup LLC RSDeltabook Intraday Hedging and Monitoring PremWindow (Options Portfolios and Underliers Window) PremWin displays the aggregate risk of the portfolio priced at the spot levels shown. PremWin Menu Bar consists of the following items Option Portfolios and Underliers Quit Help QuoteWin Option SimPos Font Spot WorkSheet Option VolaWindow Expiring InTheMoney
  • 17. RSGroup LLC RSDeltabook Note by pointing to a particular ticker in the left hand column and highlighting launches the vertical menu as shown. QuoteWin ----- [Spot Option] Choosing Spot displays the spot tickers for each position in the portfolio. Tickers can also be Copied and Paste into Deltabook from Excel allowing the user to see market quotes, earnings dates and estimates along with ExDividend Dates and Dividend amounts. Choosing Option displays the option tickers for all positions in the portfolio. To view a current quote on a new security that is not already shown, you can do so by typing its symbol into the Symbol field. Option----[WorkSheet VolaWindow] Worksheet allows for the creation of options useful in the analysis of option spreads. (this will be discussed further down). Options are entered by either supplying the OptTkr or by supplying values for the 4 fields Spot, ExpDate, Strike, Type AMZN 08/21/2015 530 C MU 10/16/2015 24 C
  • 18. RSGroup LLC RSDeltabook Once an option is identified, the other Worksheet fields will be calculated. Deltabook will request new security prices every 2 minutes, and all risk parameters are recalculated whenever prices change. The menu item RefreshPrice will retrieve the current market prices for every security in the portfolio and in the QuoteWin List. SimPos-------- Allows position to be Simulated by adjusting parameters ShockWin (Shock) ShockMatrixMenuBar (ThisisanimpactinpositionP&Lmatrixforparrallelshiftsinpricesandvolatility) Quit Help QuoteWin Option Shock_matrix Font Spot WorkSheet Option VolaWindow Expiring InTheMoney
  • 19. RSGroup LLC RSDeltabook In order to shock the entire portfolio over a range of Price and Volatility changes, adjust PrcPct and VolLimit . The Columns box is used to set the granularity of the price percentage change eg Cols=10 divides a 10% Up and Down Price change simulation into columns with 5 negative price changes and 5 columns of positive price change. Choosing Shock_Matrix refreshes the shock grid with the calculated P&Ls for the associated shifts. Note all other MenuBar buttons are the same as in PremWin
  • 20. RSGroup LLC RSDeltabook Volatility Analysis and Volatility Studies (Price and Rolling Historical Vol Study) Quit Help VolaStudy Font User Enters Hedge volatilities in the table below. To perform a volatility study adjust the parameters VolaTkr, Sample Size, Begin Date and End Date. In the example below we calculate volatility of Tkr SPY based on rolling 20 trading day windows beginning on 10/01/2015 and ending on 9/30/2016. Hit the VolaStudy on the menu bar to re-calculate. A VolaStudy consists of a graph of price and volatility and a frequency histogram.
  • 21. RSGroup LLC RSDeltabook The Grid Matrix above is used to enter option input parameters. Note that Vola is a column of historical vols. The Implied Volatilities are calculated based on the option market values.
  • 22. RSGroup LLC RSDeltabook Risk Monitoring and P&L Changes over Time What If Scenarios Window Quit Help SimPos Font NOTE: This resultant sheet is based on paralell price/ volatility shifts across assets Change PrcPct Vol Pct and DaysFwd parameters and hit SimPos (simulate position) Evaluates the portfolio in accordance with parallel shifts in PrcPct (price percentage) and VolPct (volatility percentage) DaysFwd adjust the option volaility days to a lower value (into the future) or backwards (by increasing the value)
  • 23. RSGroup LLC RSDeltabook Option and Spread Pricing (Create Option for analysis of option spreads) Quit Help QuoteWin Option SimPos Font Spot WorkSheet Option VolaWindow Expiring InTheMoney Worksheet allows for the creation of options useful in the analyzing of spreads Option Worksheet Options are entered by supplying either OptTkr or by supplying values for TKR MM/DD/YY Strike Type Spread analysis is simplified by grouping the option legs together in this spreadsheet. The spreadsheet then populates the other columns automatically so the spread can be examined. SPY 09/18/2015 195 Call SPY 09/18/2015 195 Put
  • 24. RSGroup LLC RSDeltabook Glossary of Terms The Qtime column displays the time that the security was last priced. Spot Spot Ticker SpotPrc Price of Spot Ticker TrShares Quantity of shares for each position. The number of shares can be changed by typing in a new number of shares. NetShares Calculated as TrShares - Qdelta Columns starting with the letter ""Q"" all relate to option Quantities. Qdelta the total delta resulting from aggregating the individual option deltas for a given spot. Qgamma aggregate gamma, Qvega aggregate vega. QTheta aggregate theta. $Gamma1% $change in the position for a 1% move in underlyer. (ie the $Net will change by approx $Gamma1% if the spot price changes by 1%) P&L P&L of the position calculated as the number of shares x (Mark - PriorMark). FairP&L P&L of the position calculated as the number of shares x (Prem- Mark) and correponds to the theoretical edge of your portfolio. The theoretical edge, is the P&L you presume to realize if the position trades at your hedge volatilities. Deltabook supports 3 different hedging methods for assigning volatility to individual options: 1. Each underlyer can have a single theoretical hedge volatility. 2. Each option can have its own hedge volatility (user skew) 3. Each option can be hedged at is implied volatility (implied skew)
  • 25. RSGroup LLC RSDeltabook ShockWin calculates changes to portfolio or SpotTkr P&L over a range of percent changes in price and volatility so that you can quickly see where your risk is the largest and smallest. Shock can be run for either a portfolio or for an individual underlyer. Vola_tkr MenuItem displays a graph of price and volatility for the underlyer in the current row. It also calculates a frequency histogram indicating the distribution of historical volatilities. OptionDetail MenuItem displays the individual option position for the current underlyer. RateCurve displays the financing curve that is used to calculate forward prices. It is initialized on startup to the financing rates implied by the values of certain Fed Funds future contracts. Applying the ReCalc button in the rate curve grid will cause all options to reevaluate using the updated values from the rate curve.