SlideShare uma empresa Scribd logo
1 de 10
Baixar para ler offline
1
One of the difficulties facing new immigrants coming to the United States is their familiarity with the English language. While some
newcomers arrive from countries where English is the primary language,the vast majority of recent immigrants to the United States have
come from LatinAmerica andAsia; regions of the world where English is not the primary language.This presents a number of challenges
for both foreign-born residents and community leaders in any city with a significant immigrant population.
Of course, familiarity with English is a critical part of most everyday interactions in the United States. Additionally, English language
proficiency is an essential skill for full participation and mobility in the labor market.With immigrants expected to take on an important
role in filling critical job vacancies created by the retirement of the Baby Boomer generation, English language skills of foreign-born
residents are not only of importance to the worker, but also to the long term economic health of the region.
There are a number of different types of programs and services aimed at helping immigrants improve their English speaking skills.
The most well-known set of programs are English for Speakers of Other Languages (ESOL) courses. Of the State-Administered Adult
Education programs, English as a Second Language (ESL1
) courses are among the most popular. According to the U.S. Department of
Education2
, approximately 44% of participants in State-AdministeredAdult Education programs in the United States during 2004-2005
were enrolled in an ESL course3
.The proportion was even higher in Massachusetts, as 56% of participants in State-Administered Adult
Education programs were enrolled in an ESL course4
.
English language courses for non-native speakers are a very large and important part of adult education courses in the United States
and, in particular, Massachusetts.That said, waitlists for ESOL classes in the Commonwealth and the city are quite large. Currently, there
are over 13,000 students enrolled in ESOL courses in Massachusetts, but close to 15,000 individuals on DOE waitlists.The proportions
are similar for Boston. There are close to 3,400 students enrolled in ESOL courses in Boston, with over 4,000 on DOE waitlists5
. While
there are a lot of people serviced by these programs, the capacity of the system clearly does not meet the demand. As the data show,
more than half of the people interested in ESOL courses are forced on to waiting lists6
.
The Commonwealth of Massachusetts and the City of Boston both have a complicated network of state funded and non-state funded
ESOL programs, including a growing number of “for profit” ESOL providers like the Harvest Institute and ESL Wizard. In addition, there
are a number of organizations that provide English language assistance but are not specifically ESOL programs7
.The most well-known
and significant funder of ESOL in the Commonwealth is the Massachusetts Department of Education (DOE). ESOL courses sponsored by
the DOE are part of the largerAdult Basic Education (ABE) program.These services are all funded out of the DOE’sAdult and Community
Learning Services (ACLS) division. However, there are a significant number of non-DOE funded ESOL providers, making it difficult to get
a complete sketch of all the different ESOL outlets available to immigrants arriving to the region. Moreover, information on funding,
enrollments, student progress, and program performance are not completely standardized across all the different ESOL providers in the
Commonwealth. In short, due to the disconnected network of state funded and non-state funded ESOL programs, as well as the lack
Briefing Book: English to Speakers of Other Languages (ESOL) Programs in Boston
1
The terms ESOL and ESL are frequently used interchangeably in the literature regarding English language courses for non-native speakers. In this document, we will be using the term ESOL, except in cases when
organizations specifically define their programs as ESL. In any event, both of these programs service the same community of interest.
2
Data from the Office of Vocational and Adult Education (OVAE). For more details, please see http://www.ed.gov/about/offices/list/ovae/pi/AdultEd/aedatatables.html
3
Compared to 39% in Adult Basic Education (ABE) courses and 16% in Adult Secondary Education (ASE) courses.
4 Compared to 34% in ABE courses and 10% in ASE courses.
5 Massachusetts Department of Education, Fiscal Year 2009.
6 Due to the fact that there are a number of ESOL providers that are not funded by the DOE, the actual population of ESOL students and waitlists in the Commonwealth and city of Boston would be larger than
these numbers.
7 These ESOL programs can range from language classes offered as part of larger social service organizations or very small community organizations that offer language classes as part of holistic assistance.An
example would be a nonprofit organization helping immigrants with job training, finding housing, and language classes.These organizations may not show up on the ESOL “radar”, but do offer help to those who
are unfamiliar with English.
2
8
For this analysis, we focused on Boston’s foreign-born residents who are 19 years of age or older. Over 99.99% of ESOL students in DOE funded programs in Boston are 19 years of age and older.While Adult Basic
Education programs (which includes ESOL) serve people 16 years of age and older, in practice people under the age of 19 are likely to still be enrolled in public schools and participating in English Language Learner
(ELL) programs as a part of their school curriculum rather than state funded ESOL programs.
9 All data regarding ESOL students in DOE funded programs in Boston were provided by the Massachusetts Department of Education,Adult and Community Learning Services.
of oversight for non-state funded and community-based social service organizations that provide language courses to immigrants, it
is impossible to know precisely the total number of ESOL students in the Bay State, the length of waitlists, how ESOL programs and
students are performing, and what the typical outcomes of ESOL courses are.
The most accessible and reliable data on ESOL programs are collected by the DOE. The DOE requires all programs receiving
funding to report into the System for Managing Accountability and Results through Technology (SMARTT). SMARTT serves as the
Commonwealth’s online data source for all DOE funded ABE programs, including ESOL. Included in the data collected by the DOE
in the SMARTT system are demographics, assessments of student performance, and various measures of learner gains. While DOE
data do not include ESOL students from non- DOE funded and community-based social service organizations that provide language
courses to immigrants, it does capture the majority of ESOL students in the Commonwealth. These data can give us a sense of
what the ESOL population looks like in the City of Boston, as well as see how well ESOL students and providers in Boston meet
performance benchmarks established by the DOE.
Demographics of ESOL in Boston
Gender and ESOL in Boston
Overall, we see some significant demographic differences between the population of ESOL students in DOE funded programs and the
population of foreign-born residents in the City of Boston8
. There were nearly 3,400 students enrolled in DOE funded ESOL classes
in Boston during Fiscal Year 20099
.As Figure 1 indicates, the vast majority of ESOL students in Boston are female (nearly 70%). In
contrast, women make up only about 50% of the immigrant population in the city. Given that women make up a slight majority of
the population at large, it is not surprising to see more women in ESOL courses. However, the proportion of women in
Briefing Book: English to
Speakers of Other Languages
(ESOL) Programs in Boston
Figure 1:
ce: Department of Education, Fiscal Year 2009; American Community Survey 2005-2007; BRA Research Division Analysisce: Department of Education, Fiscal Year 2009; American Community Survey 2005-2007; BRA Research Division Analysisce: Department of Education, Fiscal Year 2009; American Community Survey 2005-2007; BRA Research Division Analysisce: Department of Education, Fiscal Year 2009; American Community Survey 2005-2007; BRA Research Division Analysisce: Department of Education, Fiscal Year 2009; American Community Survey 2005-2007; BRA Research Division Analysis
68.8%
31.2%
!"#$ %$&"#$
50.5%
!"#$ %$&"#$
Gender Breakdown
Source: Department of Education, Fiscal Year 2009;American Community Survey 2005-2007; BRA Research Division Analysis
Europe Asia Africa North
America
Latin America
1860-1900 !"##$%&$&#'' !"!!'()''!#& !"!!*)($+)%( !"%*%((&!*'' !"!!%(%%#$(#
,-./-0120-34/56.1
789:18;</-.;= >50-?@.A250.>50-?@.A250.
B3C- +*"%D B3C- ')"&D
>-E3C- $("(D >-E3C- &!"&D
Source: Department of Education, Fiscal Year 2009; American Community Survey 2005-2007; BRA Research Division AnalysisSource: Department of Education, Fiscal Year 2009; American Community Survey 2005-2007; BRA Research Division AnalysisSource: Department of Education, Fiscal Year 2009; American Community Survey 2005-2007; BRA Research Division AnalysisSource: Department of Education, Fiscal Year 2009; American Community Survey 2005-2007; BRA Research Division AnalysisSource: Department of Education, Fiscal Year 2009; American Community Survey 2005-2007; BRA Research Division Analysis
68.8%
31.2%
!"#$ %$&"#$
50.5% 49.5%
!"#$ %$&"#$
Gender Breakdown
Gender Breakdown
310
See Guarnizo, Portest, and Haller 2003,Assimilation and Transnationalism: Determinants of Transnational Political Action among Contemporary Migrants.
Briefing Book: English to
Speakers of Other Languages
(ESOL) Programs in Boston
DOE funded ESOL courses is approaching three out of every four students. This raises the question as to exactly why women
are enrolling in ESOL courses at a rate far beyond that of men. One possibility suggested by previous research is that female
immigrants tend to have more positive views towards their receiving countries than their male counterparts. Some argue that this
is due to the fact male immigrants typically experience downward mobility in the labor market, whereas female immigrants tend
to experience upward mobility, some of which are earning wages for the first time10
.
Age and ESOL in Boston
The age breakdown of Boston’s ESOL students in DOE funded courses is also different from the age breakdown of the foreign-born
population in the city. As Figure 2 shows, the 25-44 and the 45-60 age groups are the largest segments for both populations.
While 25-60 year olds make up the majority of people in both groups, the proportion is larger in DOE funded ESOL programs as
compared to the population of foreign-born residents at large (84% to 71%, respectively). These results are not surprising given
that two of the most typically cited reasons for a person enrolling in ESOL programs is to enhance their labor market mobility and to
improve communication with their children and their children’s teachers. Individuals in the 25-44 and 45-60 age groups would be
the most active participants in the labor market and the ones most likely to have school aged children (particularly the 25-44 group).
As a result, there is a great deal of motivation for individuals in these age groups to seek out English language classes.
Figure 2:
F@-120-34/56.F@-120-34/56.
789:18;</-.;=789:18;</-.;= >50-?@.A250.>50-?@.A250.
*)1A1%' $D *)1A1%' 12%
%&1A1'' &+D %&1A1'' 47%
'&1A1$! +*D '&1A1$! 24%
FG5H-1$! **D FG5H-1$! 17%
Source: Department of Education, Fiscal Year 2009; American Community Survey 2005-2007; BRA Research Division AnalysisSource: Department of Education, Fiscal Year 2009; American Community Survey 2005-2007; BRA Research Division AnalysisSource: Department of Education, Fiscal Year 2009; American Community Survey 2005-2007; BRA Research Division AnalysisSource: Department of Education, Fiscal Year 2009; American Community Survey 2005-2007; BRA Research Division AnalysisSource: Department of Education, Fiscal Year 2009; American Community Survey 2005-2007; BRA Research Division Analysis
**D
+*D
&+D
$D
19 - 24 25 - 44 45 - 60 Above 60
*#D
%'D
'#D
*%D
>50-?@.A250.789:18;</-.;=
F@-120-34/56.F@-120-34/56.
789:18;</-.;=789:18;</-.;= >50-?@.A250.>50-?@.A250.
*)1A1%' $D *)1A1%' 12%
%&1A1'' &+D %&1A1'' 47%
'&1A1$! +*D '&1A1$! 24%
FG5H-1$! **D FG5H-1$! 17%
Source: Department of Education, Fiscal Year 2009; American Community Survey 2005-2007; BRA Research Division AnalysisSource: Department of Education, Fiscal Year 2009; American Community Survey 2005-2007; BRA Research Division AnalysisSource: Department of Education, Fiscal Year 2009; American Community Survey 2005-2007; BRA Research Division AnalysisSource: Department of Education, Fiscal Year 2009; American Community Survey 2005-2007; BRA Research Division AnalysisSource: Department of Education, Fiscal Year 2009; American Community Survey 2005-2007; BRA Research Division Analysis
**D
+*D
&+D
$D
19 - 24 25 - 44 45 - 60 Above 60
*#D
%'D
'#D
*%D
19 - 24
25 - 44
45 - 60
Above 60
>50-?@.A250.789:18;</-.;=
Age Breakdown
Source: Department of Education, Fiscal Year 2009;American Community Survey 2005-2007; BRA Research Division Analysis
I3J?3C120-34/56.
789:18;</-.;= >50-?@.A250.
KL?;- *%D KL?;- 23%
2C3J4MFN0?J3.AFE-0?J3. %%D 2C3J4MFN0?J3.AFE-0?J3. 23%
O?=P3.?J '+D O?=P3.?J 26%
F=?3.MQ3J?N?J1R=C3./-0 %'D F=?3.MQ3J?N?J1R=C3./-0 %*D
85E-15;L-0103J- &D
B<C;?A03J?3C *D
Source: Department of Education, Fiscal Year 2009; American Community Survey 2005-2007; BRA Research Division AnalysisSource: Department of Education, Fiscal Year 2009; American Community Survey 2005-2007; BRA Research Division AnalysisSource: Department of Education, Fiscal Year 2009; American Community Survey 2005-2007; BRA Research Division AnalysisSource: Department of Education, Fiscal Year 2009; American Community Survey 2005-2007; BRA Research Division Analysis
*D
&D
%*D
%$D
%+D
%+D
White Black/African-American Hispanic Asian/Pacific Islander
%'D
'
>50-?@.A250.
4
Briefing Book: English to
Speakers of Other Languages
(ESOL) Programs in Boston
Race and ESOL in Boston
We noticed substantial differences in the racial and ethnic makeup of Boston’s ESOL students in DOE funded courses as compared
to the population of foreign-born residents in Boston at large. As Figure 3 shows, Hispanic/Latinos and Asians make up a larger
proportion of the ESOL students in DOE funded courses than in the overall population of foreign-born residents in the city.
As noted in the Demographics briefing, changes in federal immigration policy in the 1960s lead to large increases in the number of
immigrants locally and nationally, as well as significant changes in the regions of the globe newcomers were migrating from.With the
bulk of recent immigration coming from Latin American and Asian countries, one would expect to see individuals from these racial
and ethnic backgrounds making up the majority of ESOL students.
Figure 3:
I3J?3C120-34/56.
789:18;</-.;= >50-?@.A250.
KL?;- *%D KL?;- 23%
2C3J4MFN0?J3.AFE-0?J3. %%D 2C3J4MFN0?J3.AFE-0?J3. 23%
O?=P3.?J '+D O?=P3.?J 26%
F=?3.MQ3J?N?J1R=C3./-0 %'D F=?3.MQ3J?N?J1R=C3./-0 %*D
85E-15;L-0103J- &D
B<C;?A03J?3C *D
Source: Department of Education, Fiscal Year 2009; American Community Survey 2005-2007; BRA Research Division AnalysisSource: Department of Education, Fiscal Year 2009; American Community Survey 2005-2007; BRA Research Division AnalysisSource: Department of Education, Fiscal Year 2009; American Community Survey 2005-2007; BRA Research Division AnalysisSource: Department of Education, Fiscal Year 2009; American Community Survey 2005-2007; BRA Research Division Analysis
*D
&D
%*D
%$D
%+D
%+D
White Black/African-American Hispanic Asian/Pacific Islander
%'D
'+D
>50-?@.A250. 789
%+D
%+D
Hispanic Asian/Pacific Islander Some other race Multi-racial
%'D
'+D
%%D
*%D
789:18;</-.;=*D
&D
%*D
%$D
%+D
%+D
White Black/African-American Hispanic Asian/Pacific Islander Some other race Multi-racial
%'D
'+D
%%D
*%D
>50-?@.A250. 789:18;</-.;=
Racial Breakdown
Source: Department of Education, Fiscal Year 2009;American Community Survey 2005-2007; BRA Research Division Analysis
5
Countries of Origin and ESOL in Boston
In looking at the countries of origin with the highest representation in Boston’s DOE funded ESOL courses and the population of
foreign-born residents in Boston, we see some slight variations (see Figure 4). The top three countries of origin are the same, but
are in different orders. Each of the top three countries of origin in Boston’s ESOL student population make up a larger proportion
of the ESOL population than they do in the foreign-born population. Other than that, the top ten countries of origin stay fairly
consistent between the population at large and the population of ESOL students. The main difference is that Guatemala and Russia
are in the top ten countries of origin for ESOL students, while Jamaica and Mexico are in the top ten for Boston’s foreign born
population. The fact that Jamaica falls out of the top ten is not surprising given that English is spoken in both countries, making it
unlikely that people originating from Jamaica would be enrolling in ESOL courses11
.
In short, we see that when compared to the population of foreign-born residents in the City of Boston, the population of ESOL
students in DOE funded programs is quite different. Females are overrepresented in DOE funded ESOL programs in the city. The
population of ESOL students is centered more in the 25-60 age group than in the population of foreign-born residents at large.
Lastly, people from Latin America and Asia make up a larger proportion of ESOL students than they do in the population of
foreign-born residents.
Figure 4:
Top 10 Countries of Origin
Source: Department of Education, Fiscal Year 2009;American Community Survey 2005-2007; BRA Research Division Analysis12
.
Haiti Dominican
Republic
China Vietnam El Salvador Cape Verde Brazil Jamaica Colombia Mexico
Top Countries
of Origin for
Boston's
Foreign-Born
Population,
2007 ?= C= R= B= @= >= >= >= >= 9=
China Haiti Dominican
Republic
El Salvador Brazil Colombia Guatemala Cape Verde Vietnam H1224(
Top Countries
of Origin for
Boston's
Foreign-Born
Population,
2007 :B;DD= :>;DD= :9;DD= B;DD= @;DD= >;DD= >;DD= 9;DD= 9;DD= <=
-*1%I"X&W"O(%0A"#0&*M&,$1I(04*#Y&342I(8&Z"(%&<DD?[&EA"%4I(#&T*AA1#40&-1%G"&<DD@6<DDR[&'HE&H"2"(%IK&W4G424*#&E#(8242-*1%I"X&W"O(%0A"#0&*M&,$1I(04*#Y&342I(8&Z"(%&<DD?[&EA"%4I(#&T*AA1#40&-1%G"&<DD@6<DDR[&'HE&H"2"(%IK&W4G424*#&E#(8242-*1%I"X&W"O(%0A"#0&*M&,$1I(04*#Y&342I(8&Z"(%&<DD?[&EA"%4I(#&T*AA1#40&-1%G"&<DD@6<DDR[&'HE&H"2"(%IK&W4G424*#&E#(8242-*1%I"X&W"O(%0A"#0&*M&,$1I(04*#Y&342I(8&Z"(%&<DD?[&EA"%4I(#&T*AA1#40&-1%G"&<DD@6<DDR[&'HE&H"2"(%IK&W4G424*#&E#(8242-*1%I"X&W"O(%0A"#0&*M&,$1I(04*#Y&342I(8&Z"(%&<DD?[&EA"%4I(#&T*AA1#40&-1%G"&<DD@6<DDR[&'HE&H"2"(%IK&W4G424*#&E#(8242-*1%I"X&W"O(%0A"#0&*M&,$1I(04*#Y&342I(8&Z"(%&<DD?[&EA"%4I(#&T*AA1#40&-1%G"&<DD@6<DDR[&'HE&H"2"(%IK&W4G424*#&E#(8242-*1%I"X&W"O(%0A"#0&*M&,$1I(04*#Y&342I(8&Z"(%&<DD?[&EA"%4I(#&T*AA1#40&-1%G"&<DD@6<DDR[&'HE&H"2"(%IK&W4G424*#&E#(8242-*1%I"X&W"O(%0A"#0&*M&,$1I(04*#Y&342I(8&Z"(%&<DD?[&EA"%4I(#&T*AA1#40&-1%G"&<DD@6<DDR[&'HE&H"2"(%IK&W4G424*#&E#(8242
3ZQ&0K42&2*1%I"&K(2&(&M**0#*0"&(00(IK"$&0*&40&4#&0K"&0"]03ZQ&0K42&2*1%I"&K(2&(&M**0#*0"&(00(IK"$&0*&40&4#&0K"&0"]03ZQ&0K42&2*1%I"&K(2&(&M**0#*0"&(00(IK"$&0*&40&4#&0K"&0"]0
NKEE;)
/$ .$
China
Haiti
Dominican Republic
El Salvador
Brazil
Colombia
Guatemala
Cape Verde
Vietnam
Russia
0% 5% 10% 15% 20%
ESOL Students
China
Haiti
Dominican Republic
El Salvador
Brazil
Colombia
Guatemala
Cape Verde
Vietnam
Russia
Haiti
Dominican Republic
China
Vietnam
El Salvador
Cape Verde
Brazil
Jamaica
Colombia
Mexico
0% 2% 5% 7%
Foreign-Born
aiti Dominican
Republic
China Vietnam El Salvador Cape Verde Brazil Jamaica Colombia Mexico
?= C= R= B= @= >= >= >= >= 9=
ina Haiti Dominican
Republic
El Salvador Brazil Colombia Guatemala Cape Verde Vietnam H1224(
:B;DD= :>;DD= :9;DD= B;DD= @;DD= >;DD= >;DD= 9;DD= 9;DD= <=
&,$1I(04*#Y&342I(8&Z"(%&<DD?[&EA"%4I(#&T*AA1#40&-1%G"&<DD@6<DDR[&'HE&H"2"(%IK&W4G424*#&E#(8242&,$1I(04*#Y&342I(8&Z"(%&<DD?[&EA"%4I(#&T*AA1#40&-1%G"&<DD@6<DDR[&'HE&H"2"(%IK&W4G424*#&E#(8242&,$1I(04*#Y&342I(8&Z"(%&<DD?[&EA"%4I(#&T*AA1#40&-1%G"&<DD@6<DDR[&'HE&H"2"(%IK&W4G424*#&E#(8242&,$1I(04*#Y&342I(8&Z"(%&<DD?[&EA"%4I(#&T*AA1#40&-1%G"&<DD@6<DDR[&'HE&H"2"(%IK&W4G424*#&E#(8242&,$1I(04*#Y&342I(8&Z"(%&<DD?[&EA"%4I(#&T*AA1#40&-1%G"&<DD@6<DDR[&'HE&H"2"(%IK&W4G424*#&E#(8242&,$1I(04*#Y&342I(8&Z"(%&<DD?[&EA"%4I(#&T*AA1#40&-1%G"&<DD@6<DDR[&'HE&H"2"(%IK&W4G424*#&E#(8242&,$1I(04*#Y&342I(8&Z"(%&<DD?[&EA"%4I(#&T*AA1#40&-1%G"&<DD@6<DDR[&'HE&H"2"(%IK&W4G424*#&E#(8242&,$1I(04*#Y&342I(8&Z"(%&<DD?[&EA"%4I(#&T*AA1#40&-1%G"&<DD@6<DDR[&'HE&H"2"(%IK&W4G424*#&E#(8242
*0#*0"&(00(IK"$&0*&40&4#&0K"&0"]0*0#*0"&(00(IK"$&0*&40&4#&0K"&0"]0*0#*0"&(00(IK"$&0*&40&4#&0K"&0"]0
NKEE;)
/$ .$ &/$ &.$
0% 5% 10% 15% 20%
ESOL Students
China
Haiti
Dominican Republic
El Salvador
Brazil
Colombia
Guatemala
Cape Verde
Vietnam
Russia
Haiti
Dominican Republic
China
Vietnam
El Salvador
Cape Verde
Brazil
Jamaica
Colombia
Mexico
0% 2% 5% 7% 9%
Foreign-Born
Haiti
Dominican Re
China
Vietnam
El Salvador
Cape Verde
Brazil
Jamaica
Colombia
Mexico
11
Puerto Rico is among the top 10 home locations for ESOL students in Boston, but people from Puerto Rico are not “foreign-born”. In order to stay consistent in comparison, they were removed from the top 10
in this analysis.They are still included in the total number of ESOL students, however.
12 Note that the top ten countries of origin among the foreign-born is slightly different from the demographics briefing. Since the DOE population is essentially limited to adults 19 years of age and older, we
focused on the same age group within the foreign-born population for all comparisons between the ESOL population and the foreign-born population.As a result, the order of the top ten is slightly different,
though the countries in the top ten remained the same.
Briefing Book: English to
Speakers of Other Languages
(ESOL) Programs in Boston
6
Performance Measures-ESOL
One of the most important questions that arise when researching ESOL programs is how well are ESOL programs doing in
teaching English to non-native speakers. Simply put—are students in ESOL programs learning English? While on the surface
this question appears to be straight forward, getting reliable data turns out to be a very complicated matter. First, it is difficult
to precisely define what it means to have “improved English language skills”. There are, of course, various components
to language literacy, including reading and writing, speaking, mathematical ability, and familiarity with social and cultural
practices. As a result, when we discuss the evaluation of language learning, it is important to consider what aspects of literacy
are actually being evaluated13
. It would be extremely difficult to develop performance measure that can accurately capture
and evaluate all of these dimensions of language literacy.
The Workforce Investment Act (WIA) of 1998 requires all states to collect and submit data on student performance measures
and outcomes to the National Reporting System (NRS) for adult basic education programs funded by the WIA. This was done
with the goal of establishing accountability for programs receiving federal funding for adult education. However, on a national
scale there is no standardized method for assessing the quality of ESOL program performance and student progress. Each
state has their own procedures in place for evaluating programs and student performance. As Van Duzer and Berdan state in
their overview of assessments used in adult ESOL programs, “The lack of a consistent assessment system across states and
across programs within states had impeded the documentation and reporting of results to state and federal stakeholders”14
.
In short, without federally established standardized methods for assessing program performance it is extremely difficult, if not
impossible, to compare ESOL programs across different states15
.
As mentioned earlier in this chapter, in Massachusetts any program receiving funding from the Department of Education (DOE)
is required to report into the System for Managing Accountability and Results through Technology (SMARTT). Programs that
do not receive funding from the DOE and/or community-based social service organizations that provide language courses
to immigrants are not required to keep this type of data on ESOL student progress and program performance. While some
programs unaffiliated with the DOE keep information on their students, the quality of this data is inconsistent.
The most systematic and reliable data regarding the ESOL system in Massachusetts and Boston is the information collected by
the Massachusetts Department of Education’s Adult and Community Learning Services (ACLS). In particular, the DOE collects
data on ESOL attendance, average attended classroom hours, the percentage of students taking pre and post tests, learner gains
on standardized testing, and students progress through the NRS Educational Functioning Levels. For each of these measures,
the DOE has established benchmarks for determining which programs are performing at the Advanced, Meets Standard, Needs
Improvement, and Remedial Action levels. Using these assessments and benchmarks, we can get a sense of how well students
in Boston’s DOE funded ESOL courses are learning English and how they compare to the state’s averages16
.
13
Carol H.Van Duzer and Robert Berdan. 1999. Review of Adult Learning and Literacy. “Perspectives on Assessment in Adult ESOL Instruction”.
14 Carol H.Van Duzer and Robert Berdan. 1999. Review of Adult Learning and Literacy. “Perspectives on Assessment in Adult ESOL Instruction”.
15 For a detailed discussion on the various standardized assessment used in ESOL programs, please see Carol H.Van Duzer and Robert Berdan. 1999. Review of Adult Learning and Literacy. “Perspectives on
Assessment in Adult ESOL Instruction”.
16 DOE systematically excludes some ESOL students from each performance measure.The reasons vary from measure to measure, but they typically have to do with either how long the student was in the program
or the level of English knowledge they had entering the program. See http://www.doe.mass.edu/acls/pawg/fy09fc340_345_359.pdf for information on exclusions and performance standards for each variable.
Briefing Book: English to
Speakers of Other Languages
(ESOL) Programs in Boston
7
Briefing Book: English to
Speakers of Other Languages
(ESOL) Programs in Boston
In Figures 5 and 6, we see the attendance percentages and average attended hours for DOE funded ESOL programs in
Boston and in Massachusetts. The DOE’s standards for these variables are whether students attending between 66% and
76% of planned hours and whether students attend between 130-159 hours on average during the Fiscal Year.
Overall, during Fiscal Year 2009, both the city and the Commonwealth’s DOE funded ESOL students exceeded the benchmark for
attendance percentage and met the DOE standard for average attended hours. On average, students in Boston attend more planned
hours than is typical at the state level.
Figure 5:
Figure 5
Student Attendance Percent
Boston State
Planned Hours 514,849 514,849
Attended Hours 399,564 1,518,692.49
Attended Percentage 78% 78%
85<0J-X1W-P30;E-.;15N17/<J385<0J-X1W-P30;E-.;15N17/<J385<0J-X1W-P30;E-.;15N17/<J385<0J-X1W-P30;E-.;15N17/<J3
8;</-.;1F;;-./3.J-1Q-0J-.; 25=;5. 8;3;-
QC3..-/1O5<0= &*'Y(') *Y)&%Y!)!"++
F;;-./-/1O5<0= +))Y&$' *Y&*(Y$)%"')
Attended Percentage 78% 78%
Student Attendance Percent
Source: Department of Education, Fiscal Year 2009
Figure 6:
Figure 6
Average Attended Hours for Students
Boston State
Rates Based Hours 422,399.50 1,629,204.55
Non-Rates Based Hours 18,805.25 67,999
Match Hours 24,487.75 37,530.75
Total Hours 465,692.50 1,734,734.30
Avg. Attended Hours 137 133
85<0J-X1W-P30;E85<0J-X1W-P30;E
FH-03@-1F;;-./-/1O5<0=1N5018;</-.;= 25=;5. 8;3;-
I3;-=123=-/1O5<0= '%%Y+))"&! *Y$%)Y%!'"&&
^5.AI3;-=123=-/1O5<0= *(Y(!&"%& $#Y)))
B3;JL1O5<0= %'Y'(#"#& +#Y&+!"#&
S5;3C1O5<0= '$&Y$)%"&! *Y#+'Y#+'"+!
Avg. Attended Hours 137 133
Average Attended Hours for Students
Source: Department of Education, Fiscal Year 2009
8
Briefing Book: English to
Speakers of Other Languages
(ESOL) Programs in Boston
Figure 7 examines the total number of students who are administered pre and post tests in DOE funded ESOL programs. The DOE’s
Adult and Community Learning Services division identifies this variable as important in promoting student retention with the goal
of achieving significant learner gains. The DOE’s established standard for this variable is that between 66% and 76% of eligible
students receive both a pre and post test. In short, the pre and post test variable measures the proportion of students who stayed
in programs long enough to be administrated a post-test.
On average, ESOL students in the city met the benchmark for pre and post testing. Students in the Commonwealth, overall, exceed
the performance benchmark, scoring in the Advanced category during Fiscal Year 2009. While these data are very encouraging, they
do tell us a larger proportion of students in Boston are dropping out of ESOL programs than at the state level.While ESOL providers
in Boston are meeting the state standard in student retention, they are performing significantly below the state average.
Figure 8 explores learner gains in DOE funded ESOL programs. Learner gains examines meaningful or average student progress on
one of five assessments: the Massachusetts Adult Proficiency Test (MAPT), the Testing of Adult Basic Education (TABE) Literacy and
Language exams, the Arlington Education and Employment Program (REEP), and the Basic English Skills Test (BEST) Plus.The DOE’s
established standard for this variable is that between 35% and 49% of eligible students achieved meaningful or average learner
gains on the test used as the student’s primary assessment.
Figure 7:
Figure 7
Percentage of Students Taking Pre and Post Tests
Boston State
Total Students 3,371 12,848
# Pretest Only 925 2854
# Pre and Post 2,446 9,994
Prepost Percentage 73% 78%
85<0J-X1W-P30;E-.;15N17/<J3;?5.Y1>?=J85<0J-X1W-P30;E-.;15N17/<J3;?5.Y1>?=J
Q-0J-.;3@-15N18;</-.;=1S34?.@1Q0-13./1Q5=;1S-=;= 25=;5. 8;3;-
S5;3C18;</-.;= +Y+#* *%Y('(
_1Q0-;-=;19.C )%& %Y(&'
_1Q0-13./1Q5=; %Y''$ )Y))'
Prepost Percentage 73% 78%
Percentage of Students Taking Pre and Post Tests
Source: Department of Education, Fiscal Year 2009
Figure 8:
Figure 8
Percentage of Students Achieving Learner GainsPercentage of Students Achieving Learner GainsPercentage of Students Achieving Learner Gains
298S9^ 8SFS7
S9SF:18S`W7^S8 +Y%(* *%Y&&)
8S`W7^S81KRSO1,FR^ *Y%'! &Y$&%
,FR^1Q7IT7^S +(D '&D
85<0J-X1W-P30;E-.;15N17/<J3;?5.Y1>?=J3C1Z-301%!!)85<0J-X1W-P30;E-.;15N17/<J3;?5.Y1>?=J3C1Z-301%!!)85<0J-X1W-P30;E-.;15N17/<J3;?5.Y1>?=J3C1Z-301%!!)85<0J-X1W-P30;E-.;15N17/<J3;?5.Y1>?=J3C1Z-301%!!)
Q-0J-.;3@-15N18;</-.;=1FJL?-H?.@1:-30.-01,3?.= 25=;5. 8;3;-
S5;3C18;</-.;= +Y%(* *%Y&&)
8;</-.;=1K?;L1,3?. *Y%'! &Y$&%
,3?.1Q-0J-.; %Y''$ )Y))'
Gain Percentage 38% 45%
Percentage of Students Achieving Learner Gains
Source: Department of Education, Fiscal Year 2009
9
Briefing Book: English to
Speakers of Other Languages
(ESOL) Programs in Boston
Again, both the city and Commonwealth met the benchmark established by the DOE. However, the proportion of Boston’s DOE
funded ESOL students that met the standard was closer to the Needs Improvement category line (34%). This is a critical issue
when evaluating ESOL programs in the city and Commonwealth. While there are a number of important educational and social
issues that ESOL providers need to contend with, the acquisition of English language skills is obviously the main objective. The
data show that ESOL providers, in general, are successful in helping students reach language skill gains. That said, there is
obviously room for improvement in this category. Of the 31 DOE funded ESOL programs in Boston reporting data on learner
gains, nine failed to meet the benchmark, including one program where only four of their 45 students made meaningful or
average progress on learner gains.
Lastly, Figure 9 examines DOE funded ESOL student progress on the NRS Educational Functioning Levels (EFL). EFL standards are
negotiated with each state’s DOE and are used to determine program effectiveness. There are eleven EFL levels. While the NRS
collects data on all states, each state selects the tests it will administer. In Massachusetts, 33% of students need to complete at
least one EFL to meet the benchmark.
Both the City of Boston and the Commonwealth of Massachusetts, on average, met the DOE benchmark. The percentage of ESOL
students completing at least one EFL level during Fiscal Year 2009 in Boston was lower than the Commonwealth average. While
Boston’s DOE funded ESOL students met the benchmark overall, the percentage was somewhat close to the cut off line. Thirteen of
the 33 ESOL programs in Boston failed to meet the standard, with another two not having a single student advancing an educational
functioning level.
In summary, when looking at the performance measures maintained by the Massachusetts DOE regarding ESOL student and program
performance, there are reasons for both optimism and caution. First, at both the state and city level, students in DOE funded ESOL
programs met or exceeded performance benchmarks in attendance, average attended hours, pre and post test percentages, learner
gains, and NRS Educational Functioning Level completion. That said, the proportion of students meeting performance standard in
Boston’s DOE funded ESOL programs was typically lower than the state averages.
Figure 9:
Figure 9
Percent of Students Completing an EFL
Boston State
Total Students 10,415 13,198
Number Completed Level 3,582 3,582
Percent 37% 42%
85<0J-X1W-P30;E-.;15N17/<J3;?5.Y1>?=J3C1Z-301%!!)85<0J-X1W-P30;E-.;15N17/<J3;?5.Y1>?=J3C1Z-301%!!)
Q-0J-.;15N18;</-.;=1T5EPC-;?.@13.17>: 25=;5. 8;3;-
S5;3C18;</-.;= +Y'#) *+Y*)(
^<EG-01T5EPC-;-/1:-H-C *Y%#% &Y&%*
Percentage 37% 42%
Percent of Students Completing an EFL
Source: Department of Education, Fiscal Year 2009
10
Conclusions
Newcomers to the United States face a number of critical challenges, but the acquisition of English language skills may be the most
important. Improved English language skills can be the key to a greater level of social integration, as well as serve as a gateway
for pursuing more education, obtaining better employment, and being a stronger part of the region’s economic growth. With the
impending retirement of the Baby Boomer generation, immigrants are expected to take on an increasingly important role in the
region’s economic future. With this, the availability of ESOL programs is important to both newcomers, as well as the overall health
of the local economy.
That said,locally the supply of ESOL courses does not come close to meeting the demand. More than half of the individuals interested
in DOE funded ESOL courses in the Commonwealth and the City of Boston are on waitlists. In reality, both of these numbers are
higher too, as DOE data do include program counts and waitlists for non-DOE funded ESOL providers or community-based social
service organizations that provide language courses for immigrants 17 18
.
We also looked at the performance benchmarks established by the DOE for ESOL courses and compared how well programs in the
City of Boston did at meeting these standards, as well as how well they did comparative to the state averages. Overall, both the
City of Boston and the Commonwealth as a whole did well on the DOE established benchmarks for ESOL students and program
performance. At both the state and city level, students in DOE funded ESOL programs met or exceeded performance benchmark
standards in attendance, average attended hours, pre and post test percentages, learner gains, and NRS Educational Functioning
Level completion.
While this is encouraging information and should be a source of pride for the DOE’s Adult and Community Learning Services, there
are some areas of concern. The proportion of students meeting performance standards in Boston’s DOE funded ESOL programs was
typically lower than the state averages. While overall, ESOL providers in Boston are meeting state standards, they should be alert to
these trends and strive to meet the state averages in such measures as Learner Gains and Pre and Post Testing.
Lastly, further research needs to be done in this topic area to get a full picture of the ESOL system and to understanding the full range
of outcomes related to English language learning. In an ideal world, it would be possible compare across DOE funded, non-DOE
funded, and community-based social service providers to get a sense of how all ESOL students are performing. As the system exists
today, it is impossible to even know how many ESOL students there are in Boston, let alone know how well the system as a whole
is performing in teaching newcomers English, advancing their participation in the labor market, and improving their integration into
American society.
Produced for the Mayor’s Office of New Bostonians
By the Boston Redevelopment Authority’s (BRA) Research Division
Research Team:
Alvaro Lima - Research Director, BRA
Mark Melnik - Deputy Director for Research, BRA
Professor Barry Bluestone, Founding Director, Director, Dukakis Center for Urban and Regional Policy and
Dean of the School of Public Policy and Urban Affairs at Northeastern University
Mayor’s Office of
NEW BOSTONIANS
Agnes Chang
RESOURCE DEVELOPMENT MANAGER
Boston City Hall, Room 803
1 City Hall Square, Boston MA 02201-1165
Phone: 617.635.1960 Fax: 617.635.4540
Email: agnes.chang@cityofboston.gov
www.cityofboston.gov/newbostonians
Mayor’s Office of
NEW BOSTONIANS
Agnes Chang
RESOURCE DEVELOPMENT MANAGER
Boston City Hall, Room 803
1 City Hall Square, Boston MA 02201-1165
Phone: 617.635.1960 Fax: 617.635.4540
Email: agnes.chang@cityofboston.gov
www.cityofboston.gov/newbostonians
17 Estimates of total number of ESOL programs and students in Boston vary.The DOE reports 33DOE funded ESOL programs in the city.The Mayor’s Office of New Bostonians estimates that there are currently 75 ESOL program
providers in the city (DOE funded, non-DOE funded, and community-based organizations). In 2003, Navin Associates conducted research for the Office of Jobs and Community Services and concluded there were over 4,700
ESOL slots in Boston, but conceded the number was “inexact”. In short, while the DOE data do not capture everyone in ESOL, it is the most reliable source of data.
18 There is little coordination between non-DOE funded programs, so it is impossible to get an accurate count of waitlists in non-DOE funded programs.The DOE’s waitlist is an unduplicated count, meaning no one is counted
twice.This is not necessarily the practice at non-DOE funded program. For example, a person may put themselves on waitlists in multiple places, hence artificially driving up the waitlist.
Briefing Book: English to
Speakers of Other Languages
(ESOL) Programs in Boston

Mais conteúdo relacionado

Destaque

Transnational Communities - Not Your Grandfather's Diaspora
Transnational Communities - Not Your Grandfather's DiasporaTransnational Communities - Not Your Grandfather's Diaspora
Transnational Communities - Not Your Grandfather's DiasporaInstituto Diáspora Brasil (IDB)
 
The "New Pilgrams" - Key to the State's Economy - Are Already Here
The "New Pilgrams" - Key to the State's Economy - Are Already HereThe "New Pilgrams" - Key to the State's Economy - Are Already Here
The "New Pilgrams" - Key to the State's Economy - Are Already HereInstituto Diáspora Brasil (IDB)
 
Transnational Communities - Not Your Grandfather's Diaspora
Transnational Communities - Not Your Grandfather's DiasporaTransnational Communities - Not Your Grandfather's Diaspora
Transnational Communities - Not Your Grandfather's DiasporaInstituto Diáspora Brasil (IDB)
 
Ukr markus kiev gi aug 2011
Ukr markus kiev gi aug 2011Ukr markus kiev gi aug 2011
Ukr markus kiev gi aug 2011Heifer-Ukraine
 
Gutell 074.jmb.2000.304.0335
Gutell 074.jmb.2000.304.0335Gutell 074.jmb.2000.304.0335
Gutell 074.jmb.2000.304.0335Robin Gutell
 
Установка и настройка CMS Plone. Грегер С.Э. 06.04.2010
Установка и настройка CMS Plone. Грегер С.Э. 06.04.2010Установка и настройка CMS Plone. Грегер С.Э. 06.04.2010
Установка и настройка CMS Plone. Грегер С.Э. 06.04.2010Сообщество eLearning PRO
 
Global entrepreneurship 2011 world economic forum + stanford university
Global entrepreneurship 2011 world economic forum + stanford universityGlobal entrepreneurship 2011 world economic forum + stanford university
Global entrepreneurship 2011 world economic forum + stanford universityPaul Xavier McCarthy
 
Буклет комании EBG
Буклет комании EBGБуклет комании EBG
Буклет комании EBGSashaKarepina
 
Dec 2012 Evening Talk - Managing Complex Project
Dec 2012 Evening Talk - Managing Complex ProjectDec 2012 Evening Talk - Managing Complex Project
Dec 2012 Evening Talk - Managing Complex ProjectZulkefle Idris
 

Destaque (14)

The Many Faces of Boston
The Many Faces of BostonThe Many Faces of Boston
The Many Faces of Boston
 
Transnational Communities - Not Your Grandfather's Diaspora
Transnational Communities - Not Your Grandfather's DiasporaTransnational Communities - Not Your Grandfather's Diaspora
Transnational Communities - Not Your Grandfather's Diaspora
 
The Labor Market and the Workforce
The Labor Market and the Workforce The Labor Market and the Workforce
The Labor Market and the Workforce
 
The "New Pilgrams" - Key to the State's Economy - Are Already Here
The "New Pilgrams" - Key to the State's Economy - Are Already HereThe "New Pilgrams" - Key to the State's Economy - Are Already Here
The "New Pilgrams" - Key to the State's Economy - Are Already Here
 
Transnational Communities - Not Your Grandfather's Diaspora
Transnational Communities - Not Your Grandfather's DiasporaTransnational Communities - Not Your Grandfather's Diaspora
Transnational Communities - Not Your Grandfather's Diaspora
 
New Bostonians 2013-2014
New Bostonians 2013-2014New Bostonians 2013-2014
New Bostonians 2013-2014
 
Особистий кабінет виборця. Можливості, реєстрація, запити
Особистий кабінет виборця. Можливості, реєстрація, запитиОсобистий кабінет виборця. Можливості, реєстрація, запити
Особистий кабінет виборця. Можливості, реєстрація, запити
 
Ukr markus kiev gi aug 2011
Ukr markus kiev gi aug 2011Ukr markus kiev gi aug 2011
Ukr markus kiev gi aug 2011
 
Gutell 074.jmb.2000.304.0335
Gutell 074.jmb.2000.304.0335Gutell 074.jmb.2000.304.0335
Gutell 074.jmb.2000.304.0335
 
Установка и настройка CMS Plone. Грегер С.Э. 06.04.2010
Установка и настройка CMS Plone. Грегер С.Э. 06.04.2010Установка и настройка CMS Plone. Грегер С.Э. 06.04.2010
Установка и настройка CMS Plone. Грегер С.Э. 06.04.2010
 
A New Economic Engine
A New Economic EngineA New Economic Engine
A New Economic Engine
 
Global entrepreneurship 2011 world economic forum + stanford university
Global entrepreneurship 2011 world economic forum + stanford universityGlobal entrepreneurship 2011 world economic forum + stanford university
Global entrepreneurship 2011 world economic forum + stanford university
 
Буклет комании EBG
Буклет комании EBGБуклет комании EBG
Буклет комании EBG
 
Dec 2012 Evening Talk - Managing Complex Project
Dec 2012 Evening Talk - Managing Complex ProjectDec 2012 Evening Talk - Managing Complex Project
Dec 2012 Evening Talk - Managing Complex Project
 

Semelhante a Briefing Book: English to Speakers of Other Languages (ESOL) Programs in Boston

Immigrants In Community Colleges. Immigrants In Community Colleges. Immigrant...
Immigrants In Community Colleges. Immigrants In Community Colleges. Immigrant...Immigrants In Community Colleges. Immigrants In Community Colleges. Immigrant...
Immigrants In Community Colleges. Immigrants In Community Colleges. Immigrant...Veronica Smith
 
Summary of Issues Facing Boston's Foreign-Born - ESOL, Education, Labor Force...
Summary of Issues Facing Boston's Foreign-Born - ESOL, Education, Labor Force...Summary of Issues Facing Boston's Foreign-Born - ESOL, Education, Labor Force...
Summary of Issues Facing Boston's Foreign-Born - ESOL, Education, Labor Force...Instituto Diáspora Brasil (IDB)
 
Correspondence concerning this article should be addressed t
Correspondence concerning this article should be addressed tCorrespondence concerning this article should be addressed t
Correspondence concerning this article should be addressed tAlleneMcclendon878
 
Epsl 0801-250-epru
Epsl 0801-250-epruEpsl 0801-250-epru
Epsl 0801-250-epruHDMcWhorter
 
A Secondary School Career Education Program For ESL Students
A Secondary School Career Education Program For ESL StudentsA Secondary School Career Education Program For ESL Students
A Secondary School Career Education Program For ESL StudentsEmma Burke
 
New York City Public School Demographics
New York City Public School DemographicsNew York City Public School Demographics
New York City Public School DemographicsLuis Taveras EMBA, MS
 
SummaryIn this chapter, we discussed the changing context of sch.docx
SummaryIn this chapter, we discussed the changing context of sch.docxSummaryIn this chapter, we discussed the changing context of sch.docx
SummaryIn this chapter, we discussed the changing context of sch.docxfredr6
 
Where are we? Latinos in NYC High Schools
Where are we? Latinos in NYC High SchoolsWhere are we? Latinos in NYC High Schools
Where are we? Latinos in NYC High Schoolsnelflores
 
The History of the Limited English Proficiency Program in American Public Sch...
The History of the Limited English Proficiency Program in American Public Sch...The History of the Limited English Proficiency Program in American Public Sch...
The History of the Limited English Proficiency Program in American Public Sch...AJHSSR Journal
 
Taking Stock of ESSA’s Potential Impact on Immigrant .docx
Taking Stock of ESSA’s Potential Impact on Immigrant .docxTaking Stock of ESSA’s Potential Impact on Immigrant .docx
Taking Stock of ESSA’s Potential Impact on Immigrant .docxAASTHA76
 
Dr. William Allan Kritsonis, Editor-in-Chief, NATIONAL FORUM JOURNALS - www.n...
Dr. William Allan Kritsonis, Editor-in-Chief, NATIONAL FORUM JOURNALS - www.n...Dr. William Allan Kritsonis, Editor-in-Chief, NATIONAL FORUM JOURNALS - www.n...
Dr. William Allan Kritsonis, Editor-in-Chief, NATIONAL FORUM JOURNALS - www.n...William Kritsonis
 
Colorin Colorado_ TESOL 2010
Colorin Colorado_ TESOL 2010 Colorin Colorado_ TESOL 2010
Colorin Colorado_ TESOL 2010 Lydia Breiseth
 
The State of Low-Income Students in Polk County
The State of Low-Income Students in Polk CountyThe State of Low-Income Students in Polk County
The State of Low-Income Students in Polk CountyLauren R. Johnson
 
Running head EDUCATION IN THE U.S. AND FINLAND .docx
Running head EDUCATION IN THE U.S. AND FINLAND               .docxRunning head EDUCATION IN THE U.S. AND FINLAND               .docx
Running head EDUCATION IN THE U.S. AND FINLAND .docxcharisellington63520
 
ENGLISH AS A SECOND LANGUAGE
ENGLISH AS A SECOND LANGUAGEENGLISH AS A SECOND LANGUAGE
ENGLISH AS A SECOND LANGUAGEMuskanGarg66
 
Research Proposal on Educating Hispanic Immigrants
Research Proposal on Educating Hispanic ImmigrantsResearch Proposal on Educating Hispanic Immigrants
Research Proposal on Educating Hispanic ImmigrantsRaul Bustamante
 
Creating intentional communities
Creating intentional communitiesCreating intentional communities
Creating intentional communitiesaqyn75
 
United South End Settlements Environmental Scan 2014
United South End Settlements Environmental Scan 2014United South End Settlements Environmental Scan 2014
United South End Settlements Environmental Scan 2014Kimberly Dinehart
 

Semelhante a Briefing Book: English to Speakers of Other Languages (ESOL) Programs in Boston (20)

Immigrants In Community Colleges. Immigrants In Community Colleges. Immigrant...
Immigrants In Community Colleges. Immigrants In Community Colleges. Immigrant...Immigrants In Community Colleges. Immigrants In Community Colleges. Immigrant...
Immigrants In Community Colleges. Immigrants In Community Colleges. Immigrant...
 
Summary of Issues Facing Boston's Foreign-Born - ESOL, Education, Labor Force...
Summary of Issues Facing Boston's Foreign-Born - ESOL, Education, Labor Force...Summary of Issues Facing Boston's Foreign-Born - ESOL, Education, Labor Force...
Summary of Issues Facing Boston's Foreign-Born - ESOL, Education, Labor Force...
 
Correspondence concerning this article should be addressed t
Correspondence concerning this article should be addressed tCorrespondence concerning this article should be addressed t
Correspondence concerning this article should be addressed t
 
Diversity white paper
Diversity white paperDiversity white paper
Diversity white paper
 
Epsl 0801-250-epru
Epsl 0801-250-epruEpsl 0801-250-epru
Epsl 0801-250-epru
 
A Secondary School Career Education Program For ESL Students
A Secondary School Career Education Program For ESL StudentsA Secondary School Career Education Program For ESL Students
A Secondary School Career Education Program For ESL Students
 
New York City Public School Demographics
New York City Public School DemographicsNew York City Public School Demographics
New York City Public School Demographics
 
SummaryIn this chapter, we discussed the changing context of sch.docx
SummaryIn this chapter, we discussed the changing context of sch.docxSummaryIn this chapter, we discussed the changing context of sch.docx
SummaryIn this chapter, we discussed the changing context of sch.docx
 
Where are we? Latinos in NYC High Schools
Where are we? Latinos in NYC High SchoolsWhere are we? Latinos in NYC High Schools
Where are we? Latinos in NYC High Schools
 
The History of the Limited English Proficiency Program in American Public Sch...
The History of the Limited English Proficiency Program in American Public Sch...The History of the Limited English Proficiency Program in American Public Sch...
The History of the Limited English Proficiency Program in American Public Sch...
 
Taking Stock of ESSA’s Potential Impact on Immigrant .docx
Taking Stock of ESSA’s Potential Impact on Immigrant .docxTaking Stock of ESSA’s Potential Impact on Immigrant .docx
Taking Stock of ESSA’s Potential Impact on Immigrant .docx
 
Dr. William Allan Kritsonis, Editor-in-Chief, NATIONAL FORUM JOURNALS - www.n...
Dr. William Allan Kritsonis, Editor-in-Chief, NATIONAL FORUM JOURNALS - www.n...Dr. William Allan Kritsonis, Editor-in-Chief, NATIONAL FORUM JOURNALS - www.n...
Dr. William Allan Kritsonis, Editor-in-Chief, NATIONAL FORUM JOURNALS - www.n...
 
Colorin Colorado_ TESOL 2010
Colorin Colorado_ TESOL 2010 Colorin Colorado_ TESOL 2010
Colorin Colorado_ TESOL 2010
 
The State of Low-Income Students in Polk County
The State of Low-Income Students in Polk CountyThe State of Low-Income Students in Polk County
The State of Low-Income Students in Polk County
 
Running head EDUCATION IN THE U.S. AND FINLAND .docx
Running head EDUCATION IN THE U.S. AND FINLAND               .docxRunning head EDUCATION IN THE U.S. AND FINLAND               .docx
Running head EDUCATION IN THE U.S. AND FINLAND .docx
 
ENGLISH AS A SECOND LANGUAGE
ENGLISH AS A SECOND LANGUAGEENGLISH AS A SECOND LANGUAGE
ENGLISH AS A SECOND LANGUAGE
 
Research Proposal on Educating Hispanic Immigrants
Research Proposal on Educating Hispanic ImmigrantsResearch Proposal on Educating Hispanic Immigrants
Research Proposal on Educating Hispanic Immigrants
 
Creating intentional communities
Creating intentional communitiesCreating intentional communities
Creating intentional communities
 
Evolution of The History of Laws and Policy in Field.pdf
Evolution of The History of Laws and Policy in Field.pdfEvolution of The History of Laws and Policy in Field.pdf
Evolution of The History of Laws and Policy in Field.pdf
 
United South End Settlements Environmental Scan 2014
United South End Settlements Environmental Scan 2014United South End Settlements Environmental Scan 2014
United South End Settlements Environmental Scan 2014
 

Mais de Instituto Diáspora Brasil (IDB)

O Voto do Brasileiro no Exterior e a Necessidade de Uma Reforma Eleitoral
O Voto do Brasileiro no Exterior e a Necessidade de Uma Reforma EleitoralO Voto do Brasileiro no Exterior e a Necessidade de Uma Reforma Eleitoral
O Voto do Brasileiro no Exterior e a Necessidade de Uma Reforma EleitoralInstituto Diáspora Brasil (IDB)
 
A Diaspora Brasileira e o Governo Lula: Um Framework Transnacional para Pens...
A Diaspora Brasileira e o  Governo Lula: Um Framework Transnacional para Pens...A Diaspora Brasileira e o  Governo Lula: Um Framework Transnacional para Pens...
A Diaspora Brasileira e o Governo Lula: Um Framework Transnacional para Pens...Instituto Diáspora Brasil (IDB)
 
Brasileiros nos Estados Unidos e em Massachusetts: Um Perfil Demográfico e Ec...
Brasileiros nos Estados Unidos e em Massachusetts: Um Perfil Demográfico e Ec...Brasileiros nos Estados Unidos e em Massachusetts: Um Perfil Demográfico e Ec...
Brasileiros nos Estados Unidos e em Massachusetts: Um Perfil Demográfico e Ec...Instituto Diáspora Brasil (IDB)
 
Do “brain drain” às redes científicas globais.pptx
Do “brain drain” às redes científicas globais.pptxDo “brain drain” às redes científicas globais.pptx
Do “brain drain” às redes científicas globais.pptxInstituto Diáspora Brasil (IDB)
 
The Immigration Debate: A Racial Project 1608 - 2023race cam.pptx
The Immigration Debate: A Racial Project 1608 - 2023race cam.pptxThe Immigration Debate: A Racial Project 1608 - 2023race cam.pptx
The Immigration Debate: A Racial Project 1608 - 2023race cam.pptxInstituto Diáspora Brasil (IDB)
 
Imigração Transnacional: Um Novo Modo de (Re)Integração
Imigração Transnacional: Um Novo Modo de (Re)IntegraçãoImigração Transnacional: Um Novo Modo de (Re)Integração
Imigração Transnacional: Um Novo Modo de (Re)IntegraçãoInstituto Diáspora Brasil (IDB)
 
Anegepe - Apresentação do Lvro Brasileiros nos Estados Unidos
Anegepe - Apresentação do Lvro Brasileiros nos Estados UnidosAnegepe - Apresentação do Lvro Brasileiros nos Estados Unidos
Anegepe - Apresentação do Lvro Brasileiros nos Estados UnidosInstituto Diáspora Brasil (IDB)
 

Mais de Instituto Diáspora Brasil (IDB) (20)

O Voto do Brasileiro no Exterior e a Necessidade de Uma Reforma Eleitoral
O Voto do Brasileiro no Exterior e a Necessidade de Uma Reforma EleitoralO Voto do Brasileiro no Exterior e a Necessidade de Uma Reforma Eleitoral
O Voto do Brasileiro no Exterior e a Necessidade de Uma Reforma Eleitoral
 
A Diaspora Brasileira e o Governo Lula: Um Framework Transnacional para Pens...
A Diaspora Brasileira e o  Governo Lula: Um Framework Transnacional para Pens...A Diaspora Brasileira e o  Governo Lula: Um Framework Transnacional para Pens...
A Diaspora Brasileira e o Governo Lula: Um Framework Transnacional para Pens...
 
Instituto Diaspora Brasil Newsletter - January 2024
Instituto Diaspora Brasil Newsletter - January 2024Instituto Diaspora Brasil Newsletter - January 2024
Instituto Diaspora Brasil Newsletter - January 2024
 
Brasileiros nos Estados Unidos e em Massachusetts: Um Perfil Demográfico e Ec...
Brasileiros nos Estados Unidos e em Massachusetts: Um Perfil Demográfico e Ec...Brasileiros nos Estados Unidos e em Massachusetts: Um Perfil Demográfico e Ec...
Brasileiros nos Estados Unidos e em Massachusetts: Um Perfil Demográfico e Ec...
 
Do “brain drain” às redes científicas globais.pptx
Do “brain drain” às redes científicas globais.pptxDo “brain drain” às redes científicas globais.pptx
Do “brain drain” às redes científicas globais.pptx
 
The Immigration Debate: A Racial Project 1608 - 2023race cam.pptx
The Immigration Debate: A Racial Project 1608 - 2023race cam.pptxThe Immigration Debate: A Racial Project 1608 - 2023race cam.pptx
The Immigration Debate: A Racial Project 1608 - 2023race cam.pptx
 
As Políticasde Vinculação do Brasil
As Políticasde Vinculação do BrasilAs Políticasde Vinculação do Brasil
As Políticasde Vinculação do Brasil
 
Imigração Transnacional: Um Novo Modo de (Re)Integração
Imigração Transnacional: Um Novo Modo de (Re)IntegraçãoImigração Transnacional: Um Novo Modo de (Re)Integração
Imigração Transnacional: Um Novo Modo de (Re)Integração
 
Transnational social protection Setting the agenda
Transnational social protection Setting the agendaTransnational social protection Setting the agenda
Transnational social protection Setting the agenda
 
Transnational Social Protection
Transnational Social ProtectionTransnational Social Protection
Transnational Social Protection
 
Anegepe - Apresentação do Lvro Brasileiros nos Estados Unidos
Anegepe - Apresentação do Lvro Brasileiros nos Estados UnidosAnegepe - Apresentação do Lvro Brasileiros nos Estados Unidos
Anegepe - Apresentação do Lvro Brasileiros nos Estados Unidos
 
Anegepe - Apresentação do Livro Brasileiros
Anegepe - Apresentação do Livro Brasileiros Anegepe - Apresentação do Livro Brasileiros
Anegepe - Apresentação do Livro Brasileiros
 
Boston by the Numbers
Boston by the NumbersBoston by the Numbers
Boston by the Numbers
 
Immigrant Integration
Immigrant IntegrationImmigrant Integration
Immigrant Integration
 
Brasileiros em Portugal: De Volta as Raízes Lusitanas
Brasileiros em Portugal: De Volta as Raízes LusitanasBrasileiros em Portugal: De Volta as Raízes Lusitanas
Brasileiros em Portugal: De Volta as Raízes Lusitanas
 
Perfil Migratório do Brasil - 2009
Perfil Migratório do Brasil - 2009Perfil Migratório do Brasil - 2009
Perfil Migratório do Brasil - 2009
 
A prosperous Boston for All - Vietnamese
A prosperous Boston for All - Vietnamese A prosperous Boston for All - Vietnamese
A prosperous Boston for All - Vietnamese
 
A Prosperous Boston for All - Vietnamese
A Prosperous Boston for All - Vietnamese A Prosperous Boston for All - Vietnamese
A Prosperous Boston for All - Vietnamese
 
The Five Largest Foreign-Born Groups in Massachusetts
The Five Largest Foreign-Born Groups in MassachusettsThe Five Largest Foreign-Born Groups in Massachusetts
The Five Largest Foreign-Born Groups in Massachusetts
 
A Prosperous Boston for All - Haitians
A Prosperous Boston for All - HaitiansA Prosperous Boston for All - Haitians
A Prosperous Boston for All - Haitians
 

Último

history of 1935 philippine constitution.pptx
history of 1935 philippine constitution.pptxhistory of 1935 philippine constitution.pptx
history of 1935 philippine constitution.pptxhellokittymaearciaga
 
call girls in moti bagh DELHI 🔝 >༒9540349809 🔝 genuine Escort Service 🔝✔️✔️
call girls in moti bagh DELHI 🔝 >༒9540349809 🔝 genuine Escort Service 🔝✔️✔️call girls in moti bagh DELHI 🔝 >༒9540349809 🔝 genuine Escort Service 🔝✔️✔️
call girls in moti bagh DELHI 🔝 >༒9540349809 🔝 genuine Escort Service 🔝✔️✔️saminamagar
 
2024: The FAR, Federal Acquisition Regulations - Part 25
2024: The FAR, Federal Acquisition Regulations - Part 252024: The FAR, Federal Acquisition Regulations - Part 25
2024: The FAR, Federal Acquisition Regulations - Part 25JSchaus & Associates
 
(多少钱)Dal毕业证国外本科学位证
(多少钱)Dal毕业证国外本科学位证(多少钱)Dal毕业证国外本科学位证
(多少钱)Dal毕业证国外本科学位证mbetknu
 
Madurai Call Girls 7001305949 WhatsApp Number 24x7 Best Services
Madurai Call Girls 7001305949 WhatsApp Number 24x7 Best ServicesMadurai Call Girls 7001305949 WhatsApp Number 24x7 Best Services
Madurai Call Girls 7001305949 WhatsApp Number 24x7 Best Servicesnajka9823
 
High-Level Thematic Event on Tourism - SUSTAINABILITY WEEK 2024- United Natio...
High-Level Thematic Event on Tourism - SUSTAINABILITY WEEK 2024- United Natio...High-Level Thematic Event on Tourism - SUSTAINABILITY WEEK 2024- United Natio...
High-Level Thematic Event on Tourism - SUSTAINABILITY WEEK 2024- United Natio...Christina Parmionova
 
call girls in DLF Phase 1 gurgaon 🔝 >༒9540349809 🔝 genuine Escort Service 🔝...
call girls in DLF Phase 1  gurgaon  🔝 >༒9540349809 🔝 genuine Escort Service 🔝...call girls in DLF Phase 1  gurgaon  🔝 >༒9540349809 🔝 genuine Escort Service 🔝...
call girls in DLF Phase 1 gurgaon 🔝 >༒9540349809 🔝 genuine Escort Service 🔝...saminamagar
 
Call Girl Benson Town - Phone No 7001305949 For Ultimate Sexual Urges
Call Girl Benson Town - Phone No 7001305949 For Ultimate Sexual UrgesCall Girl Benson Town - Phone No 7001305949 For Ultimate Sexual Urges
Call Girl Benson Town - Phone No 7001305949 For Ultimate Sexual Urgesnarwatsonia7
 
call girls in West Patel Nagar DELHI 🔝 >༒9540349809 🔝 genuine Escort Service ...
call girls in West Patel Nagar DELHI 🔝 >༒9540349809 🔝 genuine Escort Service ...call girls in West Patel Nagar DELHI 🔝 >༒9540349809 🔝 genuine Escort Service ...
call girls in West Patel Nagar DELHI 🔝 >༒9540349809 🔝 genuine Escort Service ...saminamagar
 
call girls in Mayapuri DELHI 🔝 >༒9540349809 🔝 genuine Escort Service 🔝✔️✔️
call girls in Mayapuri DELHI 🔝 >༒9540349809 🔝 genuine Escort Service 🔝✔️✔️call girls in Mayapuri DELHI 🔝 >༒9540349809 🔝 genuine Escort Service 🔝✔️✔️
call girls in Mayapuri DELHI 🔝 >༒9540349809 🔝 genuine Escort Service 🔝✔️✔️saminamagar
 
Earth Day 2024 - AMC "COMMON GROUND'' movie night.
Earth Day 2024 - AMC "COMMON GROUND'' movie night.Earth Day 2024 - AMC "COMMON GROUND'' movie night.
Earth Day 2024 - AMC "COMMON GROUND'' movie night.Christina Parmionova
 
call girls in Mehrauli DELHI 🔝 >༒9540349809 🔝 genuine Escort Service 🔝✔️✔️
call girls in Mehrauli  DELHI 🔝 >༒9540349809 🔝 genuine Escort Service 🔝✔️✔️call girls in Mehrauli  DELHI 🔝 >༒9540349809 🔝 genuine Escort Service 🔝✔️✔️
call girls in Mehrauli DELHI 🔝 >༒9540349809 🔝 genuine Escort Service 🔝✔️✔️saminamagar
 
2023 Ecological Profile of Ilocos Norte.pdf
2023 Ecological Profile of Ilocos Norte.pdf2023 Ecological Profile of Ilocos Norte.pdf
2023 Ecological Profile of Ilocos Norte.pdfilocosnortegovph
 
Russian Call Girl Hebbagodi ! 7001305949 ₹2999 Only and Free Hotel Delivery 2...
Russian Call Girl Hebbagodi ! 7001305949 ₹2999 Only and Free Hotel Delivery 2...Russian Call Girl Hebbagodi ! 7001305949 ₹2999 Only and Free Hotel Delivery 2...
Russian Call Girl Hebbagodi ! 7001305949 ₹2999 Only and Free Hotel Delivery 2...narwatsonia7
 
Club of Rome: Eco-nomics for an Ecological Civilization
Club of Rome: Eco-nomics for an Ecological CivilizationClub of Rome: Eco-nomics for an Ecological Civilization
Club of Rome: Eco-nomics for an Ecological CivilizationEnergy for One World
 
Enhancing Indigenous Peoples' right to self-determination in the context of t...
Enhancing Indigenous Peoples' right to self-determination in the context of t...Enhancing Indigenous Peoples' right to self-determination in the context of t...
Enhancing Indigenous Peoples' right to self-determination in the context of t...Christina Parmionova
 
High Class Call Girls Bangalore Komal 7001305949 Independent Escort Service B...
High Class Call Girls Bangalore Komal 7001305949 Independent Escort Service B...High Class Call Girls Bangalore Komal 7001305949 Independent Escort Service B...
High Class Call Girls Bangalore Komal 7001305949 Independent Escort Service B...narwatsonia7
 
2024: The FAR, Federal Acquisition Regulations - Part 26
2024: The FAR, Federal Acquisition Regulations - Part 262024: The FAR, Federal Acquisition Regulations - Part 26
2024: The FAR, Federal Acquisition Regulations - Part 26JSchaus & Associates
 

Último (20)

history of 1935 philippine constitution.pptx
history of 1935 philippine constitution.pptxhistory of 1935 philippine constitution.pptx
history of 1935 philippine constitution.pptx
 
call girls in moti bagh DELHI 🔝 >༒9540349809 🔝 genuine Escort Service 🔝✔️✔️
call girls in moti bagh DELHI 🔝 >༒9540349809 🔝 genuine Escort Service 🔝✔️✔️call girls in moti bagh DELHI 🔝 >༒9540349809 🔝 genuine Escort Service 🔝✔️✔️
call girls in moti bagh DELHI 🔝 >༒9540349809 🔝 genuine Escort Service 🔝✔️✔️
 
2024: The FAR, Federal Acquisition Regulations - Part 25
2024: The FAR, Federal Acquisition Regulations - Part 252024: The FAR, Federal Acquisition Regulations - Part 25
2024: The FAR, Federal Acquisition Regulations - Part 25
 
(多少钱)Dal毕业证国外本科学位证
(多少钱)Dal毕业证国外本科学位证(多少钱)Dal毕业证国外本科学位证
(多少钱)Dal毕业证国外本科学位证
 
Madurai Call Girls 7001305949 WhatsApp Number 24x7 Best Services
Madurai Call Girls 7001305949 WhatsApp Number 24x7 Best ServicesMadurai Call Girls 7001305949 WhatsApp Number 24x7 Best Services
Madurai Call Girls 7001305949 WhatsApp Number 24x7 Best Services
 
High-Level Thematic Event on Tourism - SUSTAINABILITY WEEK 2024- United Natio...
High-Level Thematic Event on Tourism - SUSTAINABILITY WEEK 2024- United Natio...High-Level Thematic Event on Tourism - SUSTAINABILITY WEEK 2024- United Natio...
High-Level Thematic Event on Tourism - SUSTAINABILITY WEEK 2024- United Natio...
 
call girls in DLF Phase 1 gurgaon 🔝 >༒9540349809 🔝 genuine Escort Service 🔝...
call girls in DLF Phase 1  gurgaon  🔝 >༒9540349809 🔝 genuine Escort Service 🔝...call girls in DLF Phase 1  gurgaon  🔝 >༒9540349809 🔝 genuine Escort Service 🔝...
call girls in DLF Phase 1 gurgaon 🔝 >༒9540349809 🔝 genuine Escort Service 🔝...
 
Call Girl Benson Town - Phone No 7001305949 For Ultimate Sexual Urges
Call Girl Benson Town - Phone No 7001305949 For Ultimate Sexual UrgesCall Girl Benson Town - Phone No 7001305949 For Ultimate Sexual Urges
Call Girl Benson Town - Phone No 7001305949 For Ultimate Sexual Urges
 
call girls in West Patel Nagar DELHI 🔝 >༒9540349809 🔝 genuine Escort Service ...
call girls in West Patel Nagar DELHI 🔝 >༒9540349809 🔝 genuine Escort Service ...call girls in West Patel Nagar DELHI 🔝 >༒9540349809 🔝 genuine Escort Service ...
call girls in West Patel Nagar DELHI 🔝 >༒9540349809 🔝 genuine Escort Service ...
 
9953330565 Low Rate Call Girls In Adarsh Nagar Delhi NCR
9953330565 Low Rate Call Girls In Adarsh Nagar Delhi NCR9953330565 Low Rate Call Girls In Adarsh Nagar Delhi NCR
9953330565 Low Rate Call Girls In Adarsh Nagar Delhi NCR
 
call girls in Mayapuri DELHI 🔝 >༒9540349809 🔝 genuine Escort Service 🔝✔️✔️
call girls in Mayapuri DELHI 🔝 >༒9540349809 🔝 genuine Escort Service 🔝✔️✔️call girls in Mayapuri DELHI 🔝 >༒9540349809 🔝 genuine Escort Service 🔝✔️✔️
call girls in Mayapuri DELHI 🔝 >༒9540349809 🔝 genuine Escort Service 🔝✔️✔️
 
Earth Day 2024 - AMC "COMMON GROUND'' movie night.
Earth Day 2024 - AMC "COMMON GROUND'' movie night.Earth Day 2024 - AMC "COMMON GROUND'' movie night.
Earth Day 2024 - AMC "COMMON GROUND'' movie night.
 
call girls in Mehrauli DELHI 🔝 >༒9540349809 🔝 genuine Escort Service 🔝✔️✔️
call girls in Mehrauli  DELHI 🔝 >༒9540349809 🔝 genuine Escort Service 🔝✔️✔️call girls in Mehrauli  DELHI 🔝 >༒9540349809 🔝 genuine Escort Service 🔝✔️✔️
call girls in Mehrauli DELHI 🔝 >༒9540349809 🔝 genuine Escort Service 🔝✔️✔️
 
2023 Ecological Profile of Ilocos Norte.pdf
2023 Ecological Profile of Ilocos Norte.pdf2023 Ecological Profile of Ilocos Norte.pdf
2023 Ecological Profile of Ilocos Norte.pdf
 
Hot Sexy call girls in Palam Vihar🔝 9953056974 🔝 escort Service
Hot Sexy call girls in Palam Vihar🔝 9953056974 🔝 escort ServiceHot Sexy call girls in Palam Vihar🔝 9953056974 🔝 escort Service
Hot Sexy call girls in Palam Vihar🔝 9953056974 🔝 escort Service
 
Russian Call Girl Hebbagodi ! 7001305949 ₹2999 Only and Free Hotel Delivery 2...
Russian Call Girl Hebbagodi ! 7001305949 ₹2999 Only and Free Hotel Delivery 2...Russian Call Girl Hebbagodi ! 7001305949 ₹2999 Only and Free Hotel Delivery 2...
Russian Call Girl Hebbagodi ! 7001305949 ₹2999 Only and Free Hotel Delivery 2...
 
Club of Rome: Eco-nomics for an Ecological Civilization
Club of Rome: Eco-nomics for an Ecological CivilizationClub of Rome: Eco-nomics for an Ecological Civilization
Club of Rome: Eco-nomics for an Ecological Civilization
 
Enhancing Indigenous Peoples' right to self-determination in the context of t...
Enhancing Indigenous Peoples' right to self-determination in the context of t...Enhancing Indigenous Peoples' right to self-determination in the context of t...
Enhancing Indigenous Peoples' right to self-determination in the context of t...
 
High Class Call Girls Bangalore Komal 7001305949 Independent Escort Service B...
High Class Call Girls Bangalore Komal 7001305949 Independent Escort Service B...High Class Call Girls Bangalore Komal 7001305949 Independent Escort Service B...
High Class Call Girls Bangalore Komal 7001305949 Independent Escort Service B...
 
2024: The FAR, Federal Acquisition Regulations - Part 26
2024: The FAR, Federal Acquisition Regulations - Part 262024: The FAR, Federal Acquisition Regulations - Part 26
2024: The FAR, Federal Acquisition Regulations - Part 26
 

Briefing Book: English to Speakers of Other Languages (ESOL) Programs in Boston

  • 1. 1 One of the difficulties facing new immigrants coming to the United States is their familiarity with the English language. While some newcomers arrive from countries where English is the primary language,the vast majority of recent immigrants to the United States have come from LatinAmerica andAsia; regions of the world where English is not the primary language.This presents a number of challenges for both foreign-born residents and community leaders in any city with a significant immigrant population. Of course, familiarity with English is a critical part of most everyday interactions in the United States. Additionally, English language proficiency is an essential skill for full participation and mobility in the labor market.With immigrants expected to take on an important role in filling critical job vacancies created by the retirement of the Baby Boomer generation, English language skills of foreign-born residents are not only of importance to the worker, but also to the long term economic health of the region. There are a number of different types of programs and services aimed at helping immigrants improve their English speaking skills. The most well-known set of programs are English for Speakers of Other Languages (ESOL) courses. Of the State-Administered Adult Education programs, English as a Second Language (ESL1 ) courses are among the most popular. According to the U.S. Department of Education2 , approximately 44% of participants in State-AdministeredAdult Education programs in the United States during 2004-2005 were enrolled in an ESL course3 .The proportion was even higher in Massachusetts, as 56% of participants in State-Administered Adult Education programs were enrolled in an ESL course4 . English language courses for non-native speakers are a very large and important part of adult education courses in the United States and, in particular, Massachusetts.That said, waitlists for ESOL classes in the Commonwealth and the city are quite large. Currently, there are over 13,000 students enrolled in ESOL courses in Massachusetts, but close to 15,000 individuals on DOE waitlists.The proportions are similar for Boston. There are close to 3,400 students enrolled in ESOL courses in Boston, with over 4,000 on DOE waitlists5 . While there are a lot of people serviced by these programs, the capacity of the system clearly does not meet the demand. As the data show, more than half of the people interested in ESOL courses are forced on to waiting lists6 . The Commonwealth of Massachusetts and the City of Boston both have a complicated network of state funded and non-state funded ESOL programs, including a growing number of “for profit” ESOL providers like the Harvest Institute and ESL Wizard. In addition, there are a number of organizations that provide English language assistance but are not specifically ESOL programs7 .The most well-known and significant funder of ESOL in the Commonwealth is the Massachusetts Department of Education (DOE). ESOL courses sponsored by the DOE are part of the largerAdult Basic Education (ABE) program.These services are all funded out of the DOE’sAdult and Community Learning Services (ACLS) division. However, there are a significant number of non-DOE funded ESOL providers, making it difficult to get a complete sketch of all the different ESOL outlets available to immigrants arriving to the region. Moreover, information on funding, enrollments, student progress, and program performance are not completely standardized across all the different ESOL providers in the Commonwealth. In short, due to the disconnected network of state funded and non-state funded ESOL programs, as well as the lack Briefing Book: English to Speakers of Other Languages (ESOL) Programs in Boston 1 The terms ESOL and ESL are frequently used interchangeably in the literature regarding English language courses for non-native speakers. In this document, we will be using the term ESOL, except in cases when organizations specifically define their programs as ESL. In any event, both of these programs service the same community of interest. 2 Data from the Office of Vocational and Adult Education (OVAE). For more details, please see http://www.ed.gov/about/offices/list/ovae/pi/AdultEd/aedatatables.html 3 Compared to 39% in Adult Basic Education (ABE) courses and 16% in Adult Secondary Education (ASE) courses. 4 Compared to 34% in ABE courses and 10% in ASE courses. 5 Massachusetts Department of Education, Fiscal Year 2009. 6 Due to the fact that there are a number of ESOL providers that are not funded by the DOE, the actual population of ESOL students and waitlists in the Commonwealth and city of Boston would be larger than these numbers. 7 These ESOL programs can range from language classes offered as part of larger social service organizations or very small community organizations that offer language classes as part of holistic assistance.An example would be a nonprofit organization helping immigrants with job training, finding housing, and language classes.These organizations may not show up on the ESOL “radar”, but do offer help to those who are unfamiliar with English.
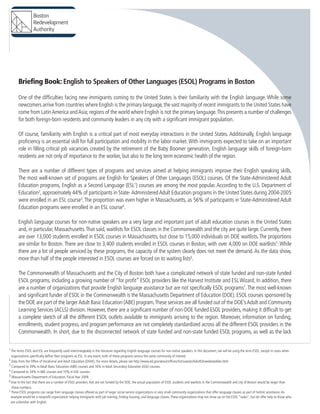
  • 2. 2 8 For this analysis, we focused on Boston’s foreign-born residents who are 19 years of age or older. Over 99.99% of ESOL students in DOE funded programs in Boston are 19 years of age and older.While Adult Basic Education programs (which includes ESOL) serve people 16 years of age and older, in practice people under the age of 19 are likely to still be enrolled in public schools and participating in English Language Learner (ELL) programs as a part of their school curriculum rather than state funded ESOL programs. 9 All data regarding ESOL students in DOE funded programs in Boston were provided by the Massachusetts Department of Education,Adult and Community Learning Services. of oversight for non-state funded and community-based social service organizations that provide language courses to immigrants, it is impossible to know precisely the total number of ESOL students in the Bay State, the length of waitlists, how ESOL programs and students are performing, and what the typical outcomes of ESOL courses are. The most accessible and reliable data on ESOL programs are collected by the DOE. The DOE requires all programs receiving funding to report into the System for Managing Accountability and Results through Technology (SMARTT). SMARTT serves as the Commonwealth’s online data source for all DOE funded ABE programs, including ESOL. Included in the data collected by the DOE in the SMARTT system are demographics, assessments of student performance, and various measures of learner gains. While DOE data do not include ESOL students from non- DOE funded and community-based social service organizations that provide language courses to immigrants, it does capture the majority of ESOL students in the Commonwealth. These data can give us a sense of what the ESOL population looks like in the City of Boston, as well as see how well ESOL students and providers in Boston meet performance benchmarks established by the DOE. Demographics of ESOL in Boston Gender and ESOL in Boston Overall, we see some significant demographic differences between the population of ESOL students in DOE funded programs and the population of foreign-born residents in the City of Boston8 . There were nearly 3,400 students enrolled in DOE funded ESOL classes in Boston during Fiscal Year 20099 .As Figure 1 indicates, the vast majority of ESOL students in Boston are female (nearly 70%). In contrast, women make up only about 50% of the immigrant population in the city. Given that women make up a slight majority of the population at large, it is not surprising to see more women in ESOL courses. However, the proportion of women in Briefing Book: English to Speakers of Other Languages (ESOL) Programs in Boston Figure 1: ce: Department of Education, Fiscal Year 2009; American Community Survey 2005-2007; BRA Research Division Analysisce: Department of Education, Fiscal Year 2009; American Community Survey 2005-2007; BRA Research Division Analysisce: Department of Education, Fiscal Year 2009; American Community Survey 2005-2007; BRA Research Division Analysisce: Department of Education, Fiscal Year 2009; American Community Survey 2005-2007; BRA Research Division Analysisce: Department of Education, Fiscal Year 2009; American Community Survey 2005-2007; BRA Research Division Analysis 68.8% 31.2% !"#$ %$&"#$ 50.5% !"#$ %$&"#$ Gender Breakdown Source: Department of Education, Fiscal Year 2009;American Community Survey 2005-2007; BRA Research Division Analysis Europe Asia Africa North America Latin America 1860-1900 !"##$%&$&#'' !"!!'()''!#& !"!!*)($+)%( !"%*%((&!*'' !"!!%(%%#$(# ,-./-0120-34/56.1 789:18;</-.;= >50-?@.A250.>50-?@.A250. B3C- +*"%D B3C- ')"&D >-E3C- $("(D >-E3C- &!"&D Source: Department of Education, Fiscal Year 2009; American Community Survey 2005-2007; BRA Research Division AnalysisSource: Department of Education, Fiscal Year 2009; American Community Survey 2005-2007; BRA Research Division AnalysisSource: Department of Education, Fiscal Year 2009; American Community Survey 2005-2007; BRA Research Division AnalysisSource: Department of Education, Fiscal Year 2009; American Community Survey 2005-2007; BRA Research Division AnalysisSource: Department of Education, Fiscal Year 2009; American Community Survey 2005-2007; BRA Research Division Analysis 68.8% 31.2% !"#$ %$&"#$ 50.5% 49.5% !"#$ %$&"#$ Gender Breakdown Gender Breakdown
  • 3. 310 See Guarnizo, Portest, and Haller 2003,Assimilation and Transnationalism: Determinants of Transnational Political Action among Contemporary Migrants. Briefing Book: English to Speakers of Other Languages (ESOL) Programs in Boston DOE funded ESOL courses is approaching three out of every four students. This raises the question as to exactly why women are enrolling in ESOL courses at a rate far beyond that of men. One possibility suggested by previous research is that female immigrants tend to have more positive views towards their receiving countries than their male counterparts. Some argue that this is due to the fact male immigrants typically experience downward mobility in the labor market, whereas female immigrants tend to experience upward mobility, some of which are earning wages for the first time10 . Age and ESOL in Boston The age breakdown of Boston’s ESOL students in DOE funded courses is also different from the age breakdown of the foreign-born population in the city. As Figure 2 shows, the 25-44 and the 45-60 age groups are the largest segments for both populations. While 25-60 year olds make up the majority of people in both groups, the proportion is larger in DOE funded ESOL programs as compared to the population of foreign-born residents at large (84% to 71%, respectively). These results are not surprising given that two of the most typically cited reasons for a person enrolling in ESOL programs is to enhance their labor market mobility and to improve communication with their children and their children’s teachers. Individuals in the 25-44 and 45-60 age groups would be the most active participants in the labor market and the ones most likely to have school aged children (particularly the 25-44 group). As a result, there is a great deal of motivation for individuals in these age groups to seek out English language classes. Figure 2: F@-120-34/56.F@-120-34/56. 789:18;</-.;=789:18;</-.;= >50-?@.A250.>50-?@.A250. *)1A1%' $D *)1A1%' 12% %&1A1'' &+D %&1A1'' 47% '&1A1$! +*D '&1A1$! 24% FG5H-1$! **D FG5H-1$! 17% Source: Department of Education, Fiscal Year 2009; American Community Survey 2005-2007; BRA Research Division AnalysisSource: Department of Education, Fiscal Year 2009; American Community Survey 2005-2007; BRA Research Division AnalysisSource: Department of Education, Fiscal Year 2009; American Community Survey 2005-2007; BRA Research Division AnalysisSource: Department of Education, Fiscal Year 2009; American Community Survey 2005-2007; BRA Research Division AnalysisSource: Department of Education, Fiscal Year 2009; American Community Survey 2005-2007; BRA Research Division Analysis **D +*D &+D $D 19 - 24 25 - 44 45 - 60 Above 60 *#D %'D '#D *%D >50-?@.A250.789:18;</-.;= F@-120-34/56.F@-120-34/56. 789:18;</-.;=789:18;</-.;= >50-?@.A250.>50-?@.A250. *)1A1%' $D *)1A1%' 12% %&1A1'' &+D %&1A1'' 47% '&1A1$! +*D '&1A1$! 24% FG5H-1$! **D FG5H-1$! 17% Source: Department of Education, Fiscal Year 2009; American Community Survey 2005-2007; BRA Research Division AnalysisSource: Department of Education, Fiscal Year 2009; American Community Survey 2005-2007; BRA Research Division AnalysisSource: Department of Education, Fiscal Year 2009; American Community Survey 2005-2007; BRA Research Division AnalysisSource: Department of Education, Fiscal Year 2009; American Community Survey 2005-2007; BRA Research Division AnalysisSource: Department of Education, Fiscal Year 2009; American Community Survey 2005-2007; BRA Research Division Analysis **D +*D &+D $D 19 - 24 25 - 44 45 - 60 Above 60 *#D %'D '#D *%D >50-?@.A250.789:18;</-.;= F@-120-34/56.F@-120-34/56. 789:18;</-.;=789:18;</-.;= >50-?@.A250.>50-?@.A250. *)1A1%' $D *)1A1%' 12% %&1A1'' &+D %&1A1'' 47% '&1A1$! +*D '&1A1$! 24% FG5H-1$! **D FG5H-1$! 17% Source: Department of Education, Fiscal Year 2009; American Community Survey 2005-2007; BRA Research Division AnalysisSource: Department of Education, Fiscal Year 2009; American Community Survey 2005-2007; BRA Research Division AnalysisSource: Department of Education, Fiscal Year 2009; American Community Survey 2005-2007; BRA Research Division AnalysisSource: Department of Education, Fiscal Year 2009; American Community Survey 2005-2007; BRA Research Division AnalysisSource: Department of Education, Fiscal Year 2009; American Community Survey 2005-2007; BRA Research Division Analysis **D +*D &+D $D 19 - 24 25 - 44 45 - 60 Above 60 *#D %'D '#D *%D 19 - 24 25 - 44 45 - 60 Above 60 >50-?@.A250.789:18;</-.;= Age Breakdown Source: Department of Education, Fiscal Year 2009;American Community Survey 2005-2007; BRA Research Division Analysis I3J?3C120-34/56. 789:18;</-.;= >50-?@.A250. KL?;- *%D KL?;- 23% 2C3J4MFN0?J3.AFE-0?J3. %%D 2C3J4MFN0?J3.AFE-0?J3. 23% O?=P3.?J '+D O?=P3.?J 26% F=?3.MQ3J?N?J1R=C3./-0 %'D F=?3.MQ3J?N?J1R=C3./-0 %*D 85E-15;L-0103J- &D B<C;?A03J?3C *D Source: Department of Education, Fiscal Year 2009; American Community Survey 2005-2007; BRA Research Division AnalysisSource: Department of Education, Fiscal Year 2009; American Community Survey 2005-2007; BRA Research Division AnalysisSource: Department of Education, Fiscal Year 2009; American Community Survey 2005-2007; BRA Research Division AnalysisSource: Department of Education, Fiscal Year 2009; American Community Survey 2005-2007; BRA Research Division Analysis *D &D %*D %$D %+D %+D White Black/African-American Hispanic Asian/Pacific Islander %'D ' >50-?@.A250.
  • 4. 4 Briefing Book: English to Speakers of Other Languages (ESOL) Programs in Boston Race and ESOL in Boston We noticed substantial differences in the racial and ethnic makeup of Boston’s ESOL students in DOE funded courses as compared to the population of foreign-born residents in Boston at large. As Figure 3 shows, Hispanic/Latinos and Asians make up a larger proportion of the ESOL students in DOE funded courses than in the overall population of foreign-born residents in the city. As noted in the Demographics briefing, changes in federal immigration policy in the 1960s lead to large increases in the number of immigrants locally and nationally, as well as significant changes in the regions of the globe newcomers were migrating from.With the bulk of recent immigration coming from Latin American and Asian countries, one would expect to see individuals from these racial and ethnic backgrounds making up the majority of ESOL students. Figure 3: I3J?3C120-34/56. 789:18;</-.;= >50-?@.A250. KL?;- *%D KL?;- 23% 2C3J4MFN0?J3.AFE-0?J3. %%D 2C3J4MFN0?J3.AFE-0?J3. 23% O?=P3.?J '+D O?=P3.?J 26% F=?3.MQ3J?N?J1R=C3./-0 %'D F=?3.MQ3J?N?J1R=C3./-0 %*D 85E-15;L-0103J- &D B<C;?A03J?3C *D Source: Department of Education, Fiscal Year 2009; American Community Survey 2005-2007; BRA Research Division AnalysisSource: Department of Education, Fiscal Year 2009; American Community Survey 2005-2007; BRA Research Division AnalysisSource: Department of Education, Fiscal Year 2009; American Community Survey 2005-2007; BRA Research Division AnalysisSource: Department of Education, Fiscal Year 2009; American Community Survey 2005-2007; BRA Research Division Analysis *D &D %*D %$D %+D %+D White Black/African-American Hispanic Asian/Pacific Islander %'D '+D >50-?@.A250. 789 I3J?3C120-34/56. 789:18;</-.;= >50-?@.A250. KL?;- *%D KL?;- 23% 2C3J4MFN0?J3.AFE-0?J3. %%D 2C3J4MFN0?J3.AFE-0?J3. 23% O?=P3.?J '+D O?=P3.?J 26% F=?3.MQ3J?N?J1R=C3./-0 %'D F=?3.MQ3J?N?J1R=C3./-0 %*D 85E-15;L-0103J- &D B<C;?A03J?3C *D Source: Department of Education, Fiscal Year 2009; American Community Survey 2005-2007; BRA Research Division AnalysisSource: Department of Education, Fiscal Year 2009; American Community Survey 2005-2007; BRA Research Division AnalysisSource: Department of Education, Fiscal Year 2009; American Community Survey 2005-2007; BRA Research Division AnalysisSource: Department of Education, Fiscal Year 2009; American Community Survey 2005-2007; BRA Research Division Analysis *D &D %*D %$D %+D %+D White Black/African-American Hispanic Asian/Pacific Islander %'D '+D >50-?@.A250. 789 %+D %+D Hispanic Asian/Pacific Islander Some other race Multi-racial %'D '+D %%D *%D 789:18;</-.;=*D &D %*D %$D %+D %+D White Black/African-American Hispanic Asian/Pacific Islander Some other race Multi-racial %'D '+D %%D *%D >50-?@.A250. 789:18;</-.;= Racial Breakdown Source: Department of Education, Fiscal Year 2009;American Community Survey 2005-2007; BRA Research Division Analysis
  • 5. 5 Countries of Origin and ESOL in Boston In looking at the countries of origin with the highest representation in Boston’s DOE funded ESOL courses and the population of foreign-born residents in Boston, we see some slight variations (see Figure 4). The top three countries of origin are the same, but are in different orders. Each of the top three countries of origin in Boston’s ESOL student population make up a larger proportion of the ESOL population than they do in the foreign-born population. Other than that, the top ten countries of origin stay fairly consistent between the population at large and the population of ESOL students. The main difference is that Guatemala and Russia are in the top ten countries of origin for ESOL students, while Jamaica and Mexico are in the top ten for Boston’s foreign born population. The fact that Jamaica falls out of the top ten is not surprising given that English is spoken in both countries, making it unlikely that people originating from Jamaica would be enrolling in ESOL courses11 . In short, we see that when compared to the population of foreign-born residents in the City of Boston, the population of ESOL students in DOE funded programs is quite different. Females are overrepresented in DOE funded ESOL programs in the city. The population of ESOL students is centered more in the 25-60 age group than in the population of foreign-born residents at large. Lastly, people from Latin America and Asia make up a larger proportion of ESOL students than they do in the population of foreign-born residents. Figure 4: Top 10 Countries of Origin Source: Department of Education, Fiscal Year 2009;American Community Survey 2005-2007; BRA Research Division Analysis12 . Haiti Dominican Republic China Vietnam El Salvador Cape Verde Brazil Jamaica Colombia Mexico Top Countries of Origin for Boston's Foreign-Born Population, 2007 ?= C= R= B= @= >= >= >= >= 9= China Haiti Dominican Republic El Salvador Brazil Colombia Guatemala Cape Verde Vietnam H1224( Top Countries of Origin for Boston's Foreign-Born Population, 2007 :B;DD= :>;DD= :9;DD= B;DD= @;DD= >;DD= >;DD= 9;DD= 9;DD= <= -*1%I"X&W"O(%0A"#0&*M&,$1I(04*#Y&342I(8&Z"(%&<DD?[&EA"%4I(#&T*AA1#40&-1%G"&<DD@6<DDR[&'HE&H"2"(%IK&W4G424*#&E#(8242-*1%I"X&W"O(%0A"#0&*M&,$1I(04*#Y&342I(8&Z"(%&<DD?[&EA"%4I(#&T*AA1#40&-1%G"&<DD@6<DDR[&'HE&H"2"(%IK&W4G424*#&E#(8242-*1%I"X&W"O(%0A"#0&*M&,$1I(04*#Y&342I(8&Z"(%&<DD?[&EA"%4I(#&T*AA1#40&-1%G"&<DD@6<DDR[&'HE&H"2"(%IK&W4G424*#&E#(8242-*1%I"X&W"O(%0A"#0&*M&,$1I(04*#Y&342I(8&Z"(%&<DD?[&EA"%4I(#&T*AA1#40&-1%G"&<DD@6<DDR[&'HE&H"2"(%IK&W4G424*#&E#(8242-*1%I"X&W"O(%0A"#0&*M&,$1I(04*#Y&342I(8&Z"(%&<DD?[&EA"%4I(#&T*AA1#40&-1%G"&<DD@6<DDR[&'HE&H"2"(%IK&W4G424*#&E#(8242-*1%I"X&W"O(%0A"#0&*M&,$1I(04*#Y&342I(8&Z"(%&<DD?[&EA"%4I(#&T*AA1#40&-1%G"&<DD@6<DDR[&'HE&H"2"(%IK&W4G424*#&E#(8242-*1%I"X&W"O(%0A"#0&*M&,$1I(04*#Y&342I(8&Z"(%&<DD?[&EA"%4I(#&T*AA1#40&-1%G"&<DD@6<DDR[&'HE&H"2"(%IK&W4G424*#&E#(8242-*1%I"X&W"O(%0A"#0&*M&,$1I(04*#Y&342I(8&Z"(%&<DD?[&EA"%4I(#&T*AA1#40&-1%G"&<DD@6<DDR[&'HE&H"2"(%IK&W4G424*#&E#(8242 3ZQ&0K42&2*1%I"&K(2&(&M**0#*0"&(00(IK"$&0*&40&4#&0K"&0"]03ZQ&0K42&2*1%I"&K(2&(&M**0#*0"&(00(IK"$&0*&40&4#&0K"&0"]03ZQ&0K42&2*1%I"&K(2&(&M**0#*0"&(00(IK"$&0*&40&4#&0K"&0"]0 NKEE;) /$ .$ China Haiti Dominican Republic El Salvador Brazil Colombia Guatemala Cape Verde Vietnam Russia 0% 5% 10% 15% 20% ESOL Students China Haiti Dominican Republic El Salvador Brazil Colombia Guatemala Cape Verde Vietnam Russia Haiti Dominican Republic China Vietnam El Salvador Cape Verde Brazil Jamaica Colombia Mexico 0% 2% 5% 7% Foreign-Born aiti Dominican Republic China Vietnam El Salvador Cape Verde Brazil Jamaica Colombia Mexico ?= C= R= B= @= >= >= >= >= 9= ina Haiti Dominican Republic El Salvador Brazil Colombia Guatemala Cape Verde Vietnam H1224( :B;DD= :>;DD= :9;DD= B;DD= @;DD= >;DD= >;DD= 9;DD= 9;DD= <= &,$1I(04*#Y&342I(8&Z"(%&<DD?[&EA"%4I(#&T*AA1#40&-1%G"&<DD@6<DDR[&'HE&H"2"(%IK&W4G424*#&E#(8242&,$1I(04*#Y&342I(8&Z"(%&<DD?[&EA"%4I(#&T*AA1#40&-1%G"&<DD@6<DDR[&'HE&H"2"(%IK&W4G424*#&E#(8242&,$1I(04*#Y&342I(8&Z"(%&<DD?[&EA"%4I(#&T*AA1#40&-1%G"&<DD@6<DDR[&'HE&H"2"(%IK&W4G424*#&E#(8242&,$1I(04*#Y&342I(8&Z"(%&<DD?[&EA"%4I(#&T*AA1#40&-1%G"&<DD@6<DDR[&'HE&H"2"(%IK&W4G424*#&E#(8242&,$1I(04*#Y&342I(8&Z"(%&<DD?[&EA"%4I(#&T*AA1#40&-1%G"&<DD@6<DDR[&'HE&H"2"(%IK&W4G424*#&E#(8242&,$1I(04*#Y&342I(8&Z"(%&<DD?[&EA"%4I(#&T*AA1#40&-1%G"&<DD@6<DDR[&'HE&H"2"(%IK&W4G424*#&E#(8242&,$1I(04*#Y&342I(8&Z"(%&<DD?[&EA"%4I(#&T*AA1#40&-1%G"&<DD@6<DDR[&'HE&H"2"(%IK&W4G424*#&E#(8242&,$1I(04*#Y&342I(8&Z"(%&<DD?[&EA"%4I(#&T*AA1#40&-1%G"&<DD@6<DDR[&'HE&H"2"(%IK&W4G424*#&E#(8242 *0#*0"&(00(IK"$&0*&40&4#&0K"&0"]0*0#*0"&(00(IK"$&0*&40&4#&0K"&0"]0*0#*0"&(00(IK"$&0*&40&4#&0K"&0"]0 NKEE;) /$ .$ &/$ &.$ 0% 5% 10% 15% 20% ESOL Students China Haiti Dominican Republic El Salvador Brazil Colombia Guatemala Cape Verde Vietnam Russia Haiti Dominican Republic China Vietnam El Salvador Cape Verde Brazil Jamaica Colombia Mexico 0% 2% 5% 7% 9% Foreign-Born Haiti Dominican Re China Vietnam El Salvador Cape Verde Brazil Jamaica Colombia Mexico aiti Dominican Republic China Vietnam El Salvador Cape Verde Brazil Jamaica Colombia Mexico ?= C= R= B= @= >= >= >= >= 9= ina Haiti Dominican Republic El Salvador Brazil Colombia Guatemala Cape Verde Vietnam H1224( :B;DD= :>;DD= :9;DD= B;DD= @;DD= >;DD= >;DD= 9;DD= 9;DD= <= &,$1I(04*#Y&342I(8&Z"(%&<DD?[&EA"%4I(#&T*AA1#40&-1%G"&<DD@6<DDR[&'HE&H"2"(%IK&W4G424*#&E#(8242&,$1I(04*#Y&342I(8&Z"(%&<DD?[&EA"%4I(#&T*AA1#40&-1%G"&<DD@6<DDR[&'HE&H"2"(%IK&W4G424*#&E#(8242&,$1I(04*#Y&342I(8&Z"(%&<DD?[&EA"%4I(#&T*AA1#40&-1%G"&<DD@6<DDR[&'HE&H"2"(%IK&W4G424*#&E#(8242&,$1I(04*#Y&342I(8&Z"(%&<DD?[&EA"%4I(#&T*AA1#40&-1%G"&<DD@6<DDR[&'HE&H"2"(%IK&W4G424*#&E#(8242&,$1I(04*#Y&342I(8&Z"(%&<DD?[&EA"%4I(#&T*AA1#40&-1%G"&<DD@6<DDR[&'HE&H"2"(%IK&W4G424*#&E#(8242&,$1I(04*#Y&342I(8&Z"(%&<DD?[&EA"%4I(#&T*AA1#40&-1%G"&<DD@6<DDR[&'HE&H"2"(%IK&W4G424*#&E#(8242&,$1I(04*#Y&342I(8&Z"(%&<DD?[&EA"%4I(#&T*AA1#40&-1%G"&<DD@6<DDR[&'HE&H"2"(%IK&W4G424*#&E#(8242&,$1I(04*#Y&342I(8&Z"(%&<DD?[&EA"%4I(#&T*AA1#40&-1%G"&<DD@6<DDR[&'HE&H"2"(%IK&W4G424*#&E#(8242 *0#*0"&(00(IK"$&0*&40&4#&0K"&0"]0*0#*0"&(00(IK"$&0*&40&4#&0K"&0"]0*0#*0"&(00(IK"$&0*&40&4#&0K"&0"]0 NKEE;) /$ .$ &/$ &.$ 0% 5% 10% 15% 20% ESOL Students China Haiti Dominican Republic El Salvador Brazil Colombia Guatemala Cape Verde Vietnam Russia Haiti Dominican Republic China Vietnam El Salvador Cape Verde Brazil Jamaica Colombia Mexico 0% 2% 5% 7% 9% Foreign-Born Haiti Dominican Re China Vietnam El Salvador Cape Verde Brazil Jamaica Colombia Mexico 11 Puerto Rico is among the top 10 home locations for ESOL students in Boston, but people from Puerto Rico are not “foreign-born”. In order to stay consistent in comparison, they were removed from the top 10 in this analysis.They are still included in the total number of ESOL students, however. 12 Note that the top ten countries of origin among the foreign-born is slightly different from the demographics briefing. Since the DOE population is essentially limited to adults 19 years of age and older, we focused on the same age group within the foreign-born population for all comparisons between the ESOL population and the foreign-born population.As a result, the order of the top ten is slightly different, though the countries in the top ten remained the same. Briefing Book: English to Speakers of Other Languages (ESOL) Programs in Boston
  • 6. 6 Performance Measures-ESOL One of the most important questions that arise when researching ESOL programs is how well are ESOL programs doing in teaching English to non-native speakers. Simply put—are students in ESOL programs learning English? While on the surface this question appears to be straight forward, getting reliable data turns out to be a very complicated matter. First, it is difficult to precisely define what it means to have “improved English language skills”. There are, of course, various components to language literacy, including reading and writing, speaking, mathematical ability, and familiarity with social and cultural practices. As a result, when we discuss the evaluation of language learning, it is important to consider what aspects of literacy are actually being evaluated13 . It would be extremely difficult to develop performance measure that can accurately capture and evaluate all of these dimensions of language literacy. The Workforce Investment Act (WIA) of 1998 requires all states to collect and submit data on student performance measures and outcomes to the National Reporting System (NRS) for adult basic education programs funded by the WIA. This was done with the goal of establishing accountability for programs receiving federal funding for adult education. However, on a national scale there is no standardized method for assessing the quality of ESOL program performance and student progress. Each state has their own procedures in place for evaluating programs and student performance. As Van Duzer and Berdan state in their overview of assessments used in adult ESOL programs, “The lack of a consistent assessment system across states and across programs within states had impeded the documentation and reporting of results to state and federal stakeholders”14 . In short, without federally established standardized methods for assessing program performance it is extremely difficult, if not impossible, to compare ESOL programs across different states15 . As mentioned earlier in this chapter, in Massachusetts any program receiving funding from the Department of Education (DOE) is required to report into the System for Managing Accountability and Results through Technology (SMARTT). Programs that do not receive funding from the DOE and/or community-based social service organizations that provide language courses to immigrants are not required to keep this type of data on ESOL student progress and program performance. While some programs unaffiliated with the DOE keep information on their students, the quality of this data is inconsistent. The most systematic and reliable data regarding the ESOL system in Massachusetts and Boston is the information collected by the Massachusetts Department of Education’s Adult and Community Learning Services (ACLS). In particular, the DOE collects data on ESOL attendance, average attended classroom hours, the percentage of students taking pre and post tests, learner gains on standardized testing, and students progress through the NRS Educational Functioning Levels. For each of these measures, the DOE has established benchmarks for determining which programs are performing at the Advanced, Meets Standard, Needs Improvement, and Remedial Action levels. Using these assessments and benchmarks, we can get a sense of how well students in Boston’s DOE funded ESOL courses are learning English and how they compare to the state’s averages16 . 13 Carol H.Van Duzer and Robert Berdan. 1999. Review of Adult Learning and Literacy. “Perspectives on Assessment in Adult ESOL Instruction”. 14 Carol H.Van Duzer and Robert Berdan. 1999. Review of Adult Learning and Literacy. “Perspectives on Assessment in Adult ESOL Instruction”. 15 For a detailed discussion on the various standardized assessment used in ESOL programs, please see Carol H.Van Duzer and Robert Berdan. 1999. Review of Adult Learning and Literacy. “Perspectives on Assessment in Adult ESOL Instruction”. 16 DOE systematically excludes some ESOL students from each performance measure.The reasons vary from measure to measure, but they typically have to do with either how long the student was in the program or the level of English knowledge they had entering the program. See http://www.doe.mass.edu/acls/pawg/fy09fc340_345_359.pdf for information on exclusions and performance standards for each variable. Briefing Book: English to Speakers of Other Languages (ESOL) Programs in Boston
  • 7. 7 Briefing Book: English to Speakers of Other Languages (ESOL) Programs in Boston In Figures 5 and 6, we see the attendance percentages and average attended hours for DOE funded ESOL programs in Boston and in Massachusetts. The DOE’s standards for these variables are whether students attending between 66% and 76% of planned hours and whether students attend between 130-159 hours on average during the Fiscal Year. Overall, during Fiscal Year 2009, both the city and the Commonwealth’s DOE funded ESOL students exceeded the benchmark for attendance percentage and met the DOE standard for average attended hours. On average, students in Boston attend more planned hours than is typical at the state level. Figure 5: Figure 5 Student Attendance Percent Boston State Planned Hours 514,849 514,849 Attended Hours 399,564 1,518,692.49 Attended Percentage 78% 78% 85<0J-X1W-P30;E-.;15N17/<J385<0J-X1W-P30;E-.;15N17/<J385<0J-X1W-P30;E-.;15N17/<J385<0J-X1W-P30;E-.;15N17/<J3 8;</-.;1F;;-./3.J-1Q-0J-.; 25=;5. 8;3;- QC3..-/1O5<0= &*'Y(') *Y)&%Y!)!"++ F;;-./-/1O5<0= +))Y&$' *Y&*(Y$)%"') Attended Percentage 78% 78% Student Attendance Percent Source: Department of Education, Fiscal Year 2009 Figure 6: Figure 6 Average Attended Hours for Students Boston State Rates Based Hours 422,399.50 1,629,204.55 Non-Rates Based Hours 18,805.25 67,999 Match Hours 24,487.75 37,530.75 Total Hours 465,692.50 1,734,734.30 Avg. Attended Hours 137 133 85<0J-X1W-P30;E85<0J-X1W-P30;E FH-03@-1F;;-./-/1O5<0=1N5018;</-.;= 25=;5. 8;3;- I3;-=123=-/1O5<0= '%%Y+))"&! *Y$%)Y%!'"&& ^5.AI3;-=123=-/1O5<0= *(Y(!&"%& $#Y))) B3;JL1O5<0= %'Y'(#"#& +#Y&+!"#& S5;3C1O5<0= '$&Y$)%"&! *Y#+'Y#+'"+! Avg. Attended Hours 137 133 Average Attended Hours for Students Source: Department of Education, Fiscal Year 2009
  • 8. 8 Briefing Book: English to Speakers of Other Languages (ESOL) Programs in Boston Figure 7 examines the total number of students who are administered pre and post tests in DOE funded ESOL programs. The DOE’s Adult and Community Learning Services division identifies this variable as important in promoting student retention with the goal of achieving significant learner gains. The DOE’s established standard for this variable is that between 66% and 76% of eligible students receive both a pre and post test. In short, the pre and post test variable measures the proportion of students who stayed in programs long enough to be administrated a post-test. On average, ESOL students in the city met the benchmark for pre and post testing. Students in the Commonwealth, overall, exceed the performance benchmark, scoring in the Advanced category during Fiscal Year 2009. While these data are very encouraging, they do tell us a larger proportion of students in Boston are dropping out of ESOL programs than at the state level.While ESOL providers in Boston are meeting the state standard in student retention, they are performing significantly below the state average. Figure 8 explores learner gains in DOE funded ESOL programs. Learner gains examines meaningful or average student progress on one of five assessments: the Massachusetts Adult Proficiency Test (MAPT), the Testing of Adult Basic Education (TABE) Literacy and Language exams, the Arlington Education and Employment Program (REEP), and the Basic English Skills Test (BEST) Plus.The DOE’s established standard for this variable is that between 35% and 49% of eligible students achieved meaningful or average learner gains on the test used as the student’s primary assessment. Figure 7: Figure 7 Percentage of Students Taking Pre and Post Tests Boston State Total Students 3,371 12,848 # Pretest Only 925 2854 # Pre and Post 2,446 9,994 Prepost Percentage 73% 78% 85<0J-X1W-P30;E-.;15N17/<J3;?5.Y1>?=J85<0J-X1W-P30;E-.;15N17/<J3;?5.Y1>?=J Q-0J-.;3@-15N18;</-.;=1S34?.@1Q0-13./1Q5=;1S-=;= 25=;5. 8;3;- S5;3C18;</-.;= +Y+#* *%Y('( _1Q0-;-=;19.C )%& %Y(&' _1Q0-13./1Q5=; %Y''$ )Y))' Prepost Percentage 73% 78% Percentage of Students Taking Pre and Post Tests Source: Department of Education, Fiscal Year 2009 Figure 8: Figure 8 Percentage of Students Achieving Learner GainsPercentage of Students Achieving Learner GainsPercentage of Students Achieving Learner Gains 298S9^ 8SFS7 S9SF:18S`W7^S8 +Y%(* *%Y&&) 8S`W7^S81KRSO1,FR^ *Y%'! &Y$&% ,FR^1Q7IT7^S +(D '&D 85<0J-X1W-P30;E-.;15N17/<J3;?5.Y1>?=J3C1Z-301%!!)85<0J-X1W-P30;E-.;15N17/<J3;?5.Y1>?=J3C1Z-301%!!)85<0J-X1W-P30;E-.;15N17/<J3;?5.Y1>?=J3C1Z-301%!!)85<0J-X1W-P30;E-.;15N17/<J3;?5.Y1>?=J3C1Z-301%!!) Q-0J-.;3@-15N18;</-.;=1FJL?-H?.@1:-30.-01,3?.= 25=;5. 8;3;- S5;3C18;</-.;= +Y%(* *%Y&&) 8;</-.;=1K?;L1,3?. *Y%'! &Y$&% ,3?.1Q-0J-.; %Y''$ )Y))' Gain Percentage 38% 45% Percentage of Students Achieving Learner Gains Source: Department of Education, Fiscal Year 2009
  • 9. 9 Briefing Book: English to Speakers of Other Languages (ESOL) Programs in Boston Again, both the city and Commonwealth met the benchmark established by the DOE. However, the proportion of Boston’s DOE funded ESOL students that met the standard was closer to the Needs Improvement category line (34%). This is a critical issue when evaluating ESOL programs in the city and Commonwealth. While there are a number of important educational and social issues that ESOL providers need to contend with, the acquisition of English language skills is obviously the main objective. The data show that ESOL providers, in general, are successful in helping students reach language skill gains. That said, there is obviously room for improvement in this category. Of the 31 DOE funded ESOL programs in Boston reporting data on learner gains, nine failed to meet the benchmark, including one program where only four of their 45 students made meaningful or average progress on learner gains. Lastly, Figure 9 examines DOE funded ESOL student progress on the NRS Educational Functioning Levels (EFL). EFL standards are negotiated with each state’s DOE and are used to determine program effectiveness. There are eleven EFL levels. While the NRS collects data on all states, each state selects the tests it will administer. In Massachusetts, 33% of students need to complete at least one EFL to meet the benchmark. Both the City of Boston and the Commonwealth of Massachusetts, on average, met the DOE benchmark. The percentage of ESOL students completing at least one EFL level during Fiscal Year 2009 in Boston was lower than the Commonwealth average. While Boston’s DOE funded ESOL students met the benchmark overall, the percentage was somewhat close to the cut off line. Thirteen of the 33 ESOL programs in Boston failed to meet the standard, with another two not having a single student advancing an educational functioning level. In summary, when looking at the performance measures maintained by the Massachusetts DOE regarding ESOL student and program performance, there are reasons for both optimism and caution. First, at both the state and city level, students in DOE funded ESOL programs met or exceeded performance benchmarks in attendance, average attended hours, pre and post test percentages, learner gains, and NRS Educational Functioning Level completion. That said, the proportion of students meeting performance standard in Boston’s DOE funded ESOL programs was typically lower than the state averages. Figure 9: Figure 9 Percent of Students Completing an EFL Boston State Total Students 10,415 13,198 Number Completed Level 3,582 3,582 Percent 37% 42% 85<0J-X1W-P30;E-.;15N17/<J3;?5.Y1>?=J3C1Z-301%!!)85<0J-X1W-P30;E-.;15N17/<J3;?5.Y1>?=J3C1Z-301%!!) Q-0J-.;15N18;</-.;=1T5EPC-;?.@13.17>: 25=;5. 8;3;- S5;3C18;</-.;= +Y'#) *+Y*)( ^<EG-01T5EPC-;-/1:-H-C *Y%#% &Y&%* Percentage 37% 42% Percent of Students Completing an EFL Source: Department of Education, Fiscal Year 2009
  • 10. 10 Conclusions Newcomers to the United States face a number of critical challenges, but the acquisition of English language skills may be the most important. Improved English language skills can be the key to a greater level of social integration, as well as serve as a gateway for pursuing more education, obtaining better employment, and being a stronger part of the region’s economic growth. With the impending retirement of the Baby Boomer generation, immigrants are expected to take on an increasingly important role in the region’s economic future. With this, the availability of ESOL programs is important to both newcomers, as well as the overall health of the local economy. That said,locally the supply of ESOL courses does not come close to meeting the demand. More than half of the individuals interested in DOE funded ESOL courses in the Commonwealth and the City of Boston are on waitlists. In reality, both of these numbers are higher too, as DOE data do include program counts and waitlists for non-DOE funded ESOL providers or community-based social service organizations that provide language courses for immigrants 17 18 . We also looked at the performance benchmarks established by the DOE for ESOL courses and compared how well programs in the City of Boston did at meeting these standards, as well as how well they did comparative to the state averages. Overall, both the City of Boston and the Commonwealth as a whole did well on the DOE established benchmarks for ESOL students and program performance. At both the state and city level, students in DOE funded ESOL programs met or exceeded performance benchmark standards in attendance, average attended hours, pre and post test percentages, learner gains, and NRS Educational Functioning Level completion. While this is encouraging information and should be a source of pride for the DOE’s Adult and Community Learning Services, there are some areas of concern. The proportion of students meeting performance standards in Boston’s DOE funded ESOL programs was typically lower than the state averages. While overall, ESOL providers in Boston are meeting state standards, they should be alert to these trends and strive to meet the state averages in such measures as Learner Gains and Pre and Post Testing. Lastly, further research needs to be done in this topic area to get a full picture of the ESOL system and to understanding the full range of outcomes related to English language learning. In an ideal world, it would be possible compare across DOE funded, non-DOE funded, and community-based social service providers to get a sense of how all ESOL students are performing. As the system exists today, it is impossible to even know how many ESOL students there are in Boston, let alone know how well the system as a whole is performing in teaching newcomers English, advancing their participation in the labor market, and improving their integration into American society. Produced for the Mayor’s Office of New Bostonians By the Boston Redevelopment Authority’s (BRA) Research Division Research Team: Alvaro Lima - Research Director, BRA Mark Melnik - Deputy Director for Research, BRA Professor Barry Bluestone, Founding Director, Director, Dukakis Center for Urban and Regional Policy and Dean of the School of Public Policy and Urban Affairs at Northeastern University Mayor’s Office of NEW BOSTONIANS Agnes Chang RESOURCE DEVELOPMENT MANAGER Boston City Hall, Room 803 1 City Hall Square, Boston MA 02201-1165 Phone: 617.635.1960 Fax: 617.635.4540 Email: agnes.chang@cityofboston.gov www.cityofboston.gov/newbostonians Mayor’s Office of NEW BOSTONIANS Agnes Chang RESOURCE DEVELOPMENT MANAGER Boston City Hall, Room 803 1 City Hall Square, Boston MA 02201-1165 Phone: 617.635.1960 Fax: 617.635.4540 Email: agnes.chang@cityofboston.gov www.cityofboston.gov/newbostonians 17 Estimates of total number of ESOL programs and students in Boston vary.The DOE reports 33DOE funded ESOL programs in the city.The Mayor’s Office of New Bostonians estimates that there are currently 75 ESOL program providers in the city (DOE funded, non-DOE funded, and community-based organizations). In 2003, Navin Associates conducted research for the Office of Jobs and Community Services and concluded there were over 4,700 ESOL slots in Boston, but conceded the number was “inexact”. In short, while the DOE data do not capture everyone in ESOL, it is the most reliable source of data. 18 There is little coordination between non-DOE funded programs, so it is impossible to get an accurate count of waitlists in non-DOE funded programs.The DOE’s waitlist is an unduplicated count, meaning no one is counted twice.This is not necessarily the practice at non-DOE funded program. For example, a person may put themselves on waitlists in multiple places, hence artificially driving up the waitlist. Briefing Book: English to Speakers of Other Languages (ESOL) Programs in Boston