SlideShare uma empresa Scribd logo
1 de 38
Baixar para ler offline
1
Decide
what to
test
Design
the test
Conduct
the test
Write-up
Test
findings
1
2
3
4
Steps to Complete : Usability Test
STEP 1:
DECIDE WHAT TO TEST
Option 1
Test usability of two
communication
products and
compare outcomes.
Option 2
Test usability of one
website.
OR
Test usability of two
websites and compare
outcomes.
2
The next few slides will give you some ideas for what to test
based on each option. You may use any of these ideas or
come up with your own.
3
Option 1: Ideas (compare 2)
Word Processing
Microsoft Word, Open
Office, Google Docs
Image Editing
Gimp, Adobe Photoshop,
Pixelmator
Website Creators
Wix, Weebly, JIMDO
3-D Modeling
AutoCad, OpenScaD,
SolidWorks, FreeCAD
MOBILE APPLICATIONS
You may test two apps.
These may be the mobile versions of
software or stand-alone Apps.
Just be certain any stand-alone apps are
complex enough to test USABILITY. Ask
me if you are uncertain.
The two Products:
• Need to be comparable.
4
xThey don’t need to have the exact same features.
But they need to be the same type of product.
Example: AutoCad does not have the same features as
SolidWorks but both are 3-D modeling tools, and Pixelmator
does not have the same features as Adobe Photoshop but
both are image creators/editors.
5
Option 2: Ideas
US Internal Revenue Service
Idaho Department of Fish and Game
Idaho Department of Labor
University of Idaho
These are just a few ideas. Many other possibilities exist.
6
Option 2: Test one or Tw0?
• You may choose to test one website or compare two websites
that are similar such as two department of fish and game sites
or two university sites. The key is to choose a website that has
complexity, where users need to find and/or do stuff.
• I provide the option of choosing just one website because
often it is not possible to compare two sites if what you want to
test is not accessible to you.
• For example, you culd not compare how to enroll in classes at
the University of Idaho compared to Boise State because you
would not have access to both of these.
If you Test Two Websites:
• They need to be comparable.
7
They don’t need to have the exact same features.
But they need to be the same type of product.
Example: Some states have fish and game websites with more
features than others, but both are the same type of website.
You may also compare two university sites from the viewpoint
of a user who is not enrolled in either: a prospective student.
x
Step 2: Designing the Test
2.1 Identify users and and level of knowledge.
2.2 Decide test tasks.
2.3 Design test metrics.
2.4 Create data collection form
2.5 Decide test environment and equipment.
8
2.1: Identify Users
9
• Identify typical users of the product or website and
decide their level of knowledge/background.
For example, engineering students who have never used
AutoCad or SolidWorks would bring a level of knowledge
when using the products that others outside of
engineering would not possess.
A hunter using the Idaho Department of Fish and Game
website would bring a level of knowledge to the site that
a non-hunter would not possess.
2.2: Decide Test Tasks
10
• If testing two communication products or two websites, you
will need to test approximately 10 specific tasks. Avoid tasks
that are too basic to evaluate usability. Example: testing how
to save a document file.
• If you are testing one website, you will need approximately
20 specific tasks (refer to slide 6 in this slidedoc if you are
confused about why I offer the option of testing just one
website).
• If you have no idea what type of tasks can be done with a
product, then consult the product’s HelpCenter only to
determine what types of things the product or website will let
users do.
2.2: Decide Test Tasks continued
11
Example: Here is a screenshot of
Weebly’s Help Center.
Do not spend time trying to learn
how to do a task because you will
be testing learnability as one
component of your test.
Simply use the help page menus to
derive a list of the tasks.
2.3: Design Test Metrics
12
Metrics are the means by which you will evaluate the
following five components that define usability.
1. Effective: were you able to complete the task? Also means
achieving goals.
2. Efficient: how long (or number of clicks) did it take you to
perform a task and is that amount of time reasonable?
3. Engaging: Did the product’s style and appearance enhance
your user experience?
4. Error Tolerant: How many times did you attempt an action that
did not work? when you made an error or a false start, did the
product give you feedback where needed?
5. Easy to Learn: how easy was it to learn how to do a task?
2.3: Design Test Metrics continued
13
Your test metrics will need to include the following:
– Qualitative Data: five criteria statements aimed at
evaluating the five components that define usability.
You must write STATEMENTS and not questions.
– Quantitative Data: a fixed-response Likert Scale that
allows you to measure your level of agreement or
disagreement with each criteria statement.
• Example: the following statement would measure learning
ability (component 5).
• I was able to complete the task without consulting the
product’s HelpCenter.
14
Strongly
Agree
Strongly
Disagree
5 4 3 2 15
2.3: Design Test Metrics Continued
15
In 1932, Rensis Likert invented a means
of measuring responses to a survey.
He showed how asking respondents to
place themselves on a scale of
favor/disfavor with a neutral midpoint
worked better than other means of
measuring responses.
The Likert scale has since been adopted
throughout the world.
2.3: Design Test Metrics Continued
About Likert Scales
The neutral midpoint of
Likert’s five-point scale is
a matter of considerable
debate.
16
2.3: Design Test Metrics Continued
The debate about the midpoint.
17
Although Likert advocated for the use of a 5-point
scale, researchers have since argued for more points
to increase the reliability and validity of the scale.
Their arguments are based on findings from studies
about how respondents choose items on the scale.
2.3: Design Test Metrics Continued
What research has shown about why respondents chose the
mid-point:
• Respondents may be unmotivated to make an effort to
choose anything else.
• Respondents may be ambivalent.
• Respondents may be reluctant to voice a socially undesirable
response.
18
Based on these findings, some researchers advocate
eliminating the midpoint or adding more items to the scale.
2.3: Design Test Metrics Continued
19
2.3: Design Test Metrics Continued
• The debate among researchers also includes how the scales should
be labeled.
Here are two ways to avoid the mid point problem.
1. Eliminate all but the end labels.
2. Add a sixth response choice.
Labeling end points only or labeling all points
is also a matter of debate.
20
There seems to be a
pattern here.
What does the
research show?
What research has shown about labeling.
• Labeling End Points Only: respondents are more attracted to
labeled points, so just labeling the end points may result in a
bias towards extreme answers.
• Labeling All Points: respondents are more attracted to
intermediate options, so it can lower extremeness of
responses, which is good.
But, it may also increase levels of positivity bias, the
tendency to respond with a positive answer, which is not
good.
21
Even the direction of labels/numbers is debated.
Should 1 start the scale or should the last number
and how many items 5, 6, 7 more??
22
Good grief.
Maybe they should
seek counseling.
23
Hey Karen, thanks for
that, but we are now
thoroughly confused.
Which scale do you
want us to use?
• In 1956, a researcher named
George Miller conducted some
experiments on short-term memory.
• He published the results in a paper:
The Magical Number Seven, Plus or
Minus Two: Some Limits on Our
Capacity for Processing Information.
• His experiments lead him to
conclude we can only retain 5 to 9
items in our short term memory.
24
It’s your choice, but here are some
things to think about.
His paper is cited as the reason why Bell Telephone
chose to issue only seven digit phone numbers.
25
Call me back.
My number is
1234567
Tip #1: Keep it Simple
26
Do you really want to deal with interpreting the
nuances of these scales? Just sayin.....
Those are just
plain scary.
Tip #2: Be consistent
27
• Use the same scale for all criteria statements.
• Don’t switch from a five-point to a seven-point and then
to a four-point.
• Keep the positions of the value labels the same.
• If you start with negative type value labels on the left of
the scale (levels of disagree) and positive on the right
(levels of agree), don’t change the positions.
• Example of inconsistent value labels:
Tip #3: Use Numbers
28
• A Likert Scale is not a Likert Scale unless it has
numbers.
• That’s the whole point of using it.
• You want to connect qualitative criteria
statements to a quantitative measure.
Tip #4: Compose criteria statements.
29
• A criteria statement has to be written in a way that a
respondent (in this project the respondent is you) can
answer by rating the level of agreement with that
statement.
• Ease of use.
• I was able to complete the task without consulting the
product’s HelpSection.
• You will need a means of collecting the data for
each task you do.
• You may create a data collection form for this
purpose or use a spreadsheet.
• Your form or spreadsheet will need to list each
tasks with the five criteria statements plus the
Likert Scale and a place to take notes.
30
2.4: Create Data collection Form
31
2.4: Example
You will need 10 pages using a form like this. One for each of the ten tasks.
32
2.4: Data Collection Option
If you know how to use a spreadsheet, that is another option for
collecting the data.
2.5: Choose Test Environment
and Equipment
33
• In the white paper write-up of test findings, you will need to
describe the test environment (where you conducted the
test) and the equipment you used (PC? Mac? Operating
system? Etc.).
• The test environment should be a quiet place where you
can work without interruption.
• If you do the test in more than one setting, be consistent
with the environment and equipment you use.
Step 3: Conduct the Test
3.1 Become the user.
3.2 Do each task, take notes, score usability.
3.3 Take screenshots.
34
3.1: Become the User
35
• To do the test, you need to set aside what you
may already know about how to use the
products or website(s) because the test is about
you playing the role of a new user.
3.2: Do each Task
36
• Pay close attention to what happens when you do a task
in the five component areas that define usability.
• Score your level of agreement or disagreement with the
criteria statements in the data collection form or
spreadsheet.
AND
• Take notes to help you describe what happened as you
did the task and to offer any recommendations about
how to improve the product or website.
3.3: Take Screenshots
37
• Take screenshots as you take notes.
• The number of screenshots you take should work to
support the descriptions you will write.
• You will need to size these to be appropriate to the page
layout in your white paper.
• Often screenshots are difficult to wrap text around. That’s
fine, but do keep the screenshot close to the textual
information it is supporting. Remember to label, caption,
and refer t screenshots in the text.
Write-Up Test Results
38
• You will be writing-up the test results (findings) in a technical
white paper.
• What white papers are and how to write your is covered in
another lecture.

Mais conteúdo relacionado

Mais procurados

DIY market segmentation 20170125
DIY market segmentation 20170125DIY market segmentation 20170125
DIY market segmentation 20170125Displayr
 
Introduction to Usability Testing for Survey Research
Introduction to Usability Testing for Survey ResearchIntroduction to Usability Testing for Survey Research
Introduction to Usability Testing for Survey ResearchCaroline Jarrett
 
Digital QA Summit - Karen N. Johnson - Testing Explained
Digital QA Summit - Karen N. Johnson - Testing ExplainedDigital QA Summit - Karen N. Johnson - Testing Explained
Digital QA Summit - Karen N. Johnson - Testing ExplainedKaren N. Johnson
 
Quick sheet google forms
Quick sheet google formsQuick sheet google forms
Quick sheet google formsKen Zimmerman
 

Mais procurados (6)

DIY market segmentation 20170125
DIY market segmentation 20170125DIY market segmentation 20170125
DIY market segmentation 20170125
 
Cognitive Walkthrough
Cognitive WalkthroughCognitive Walkthrough
Cognitive Walkthrough
 
Introduction to Usability Testing for Survey Research
Introduction to Usability Testing for Survey ResearchIntroduction to Usability Testing for Survey Research
Introduction to Usability Testing for Survey Research
 
Digital QA Summit - Karen N. Johnson - Testing Explained
Digital QA Summit - Karen N. Johnson - Testing ExplainedDigital QA Summit - Karen N. Johnson - Testing Explained
Digital QA Summit - Karen N. Johnson - Testing Explained
 
Usability testing
Usability testing  Usability testing
Usability testing
 
Quick sheet google forms
Quick sheet google formsQuick sheet google forms
Quick sheet google forms
 

Semelhante a Engl317 project4 slidedoc2_stepsto_designux_test

Ddoocp assignment qp spring winter 2021 final
Ddoocp assignment qp spring   winter 2021 finalDdoocp assignment qp spring   winter 2021 final
Ddoocp assignment qp spring winter 2021 finalBoitumeloSelelo
 
Surveys that work: using questionnaires to gather useful data, November 2010
Surveys that work: using questionnaires to gather useful data, November 2010Surveys that work: using questionnaires to gather useful data, November 2010
Surveys that work: using questionnaires to gather useful data, November 2010Caroline Jarrett
 
Resource and technology design process
Resource and technology  design processResource and technology  design process
Resource and technology design processRobby Jackson
 
Surveys in practice and theory
Surveys in practice and theorySurveys in practice and theory
Surveys in practice and theoryCaroline Jarrett
 
Experimentation Excellence: Mastering the basics
Experimentation Excellence: Mastering the basicsExperimentation Excellence: Mastering the basics
Experimentation Excellence: Mastering the basicsOptimizely
 
Uxpin guide to_usability_testing
Uxpin guide to_usability_testingUxpin guide to_usability_testing
Uxpin guide to_usability_testingimdurgesh
 
Mindmaps and heuristics tester's best friends - lalit bhamare
Mindmaps and heuristics  tester's best friends - lalit bhamareMindmaps and heuristics  tester's best friends - lalit bhamare
Mindmaps and heuristics tester's best friends - lalit bhamareLalit Bhamare
 
Creating Rubrics
Creating RubricsCreating Rubrics
Creating Rubricschedisky
 
Usability Testing On A Digital Product
Usability Testing On A Digital ProductUsability Testing On A Digital Product
Usability Testing On A Digital ProductKyle Soucy
 
Writing Research Comparison White Papers
Writing Research Comparison White PapersWriting Research Comparison White Papers
Writing Research Comparison White PapersJodie Nicotra
 
Survey Design Disaster Avoidance, Part 2 | SoGoSurvey
Survey Design Disaster Avoidance, Part 2 | SoGoSurveySurvey Design Disaster Avoidance, Part 2 | SoGoSurvey
Survey Design Disaster Avoidance, Part 2 | SoGoSurveySogolytics
 
Usability Testing and User-Centered Design
Usability Testing and User-Centered DesignUsability Testing and User-Centered Design
Usability Testing and User-Centered DesignJodie Nicotra
 
Usability Testing
Usability TestingUsability Testing
Usability Testingmbrosset
 
Usability Primer - for Alberta Municipal Webmasters Working Group
Usability Primer - for Alberta Municipal Webmasters Working GroupUsability Primer - for Alberta Municipal Webmasters Working Group
Usability Primer - for Alberta Municipal Webmasters Working GroupNormanMendoza
 
Master the Essentials of Conversion Optimization
Master the Essentials of Conversion Optimization Master the Essentials of Conversion Optimization
Master the Essentials of Conversion Optimization Kyle Curnow
 
Conversion Optimization Willa Fogarty
Conversion Optimization Willa FogartyConversion Optimization Willa Fogarty
Conversion Optimization Willa FogartyWilla Fogarty
 

Semelhante a Engl317 project4 slidedoc2_stepsto_designux_test (20)

Ddoocp assignment qp spring winter 2021 final
Ddoocp assignment qp spring   winter 2021 finalDdoocp assignment qp spring   winter 2021 final
Ddoocp assignment qp spring winter 2021 final
 
Level up your customer research
Level up your customer researchLevel up your customer research
Level up your customer research
 
Surveys that work: using questionnaires to gather useful data, November 2010
Surveys that work: using questionnaires to gather useful data, November 2010Surveys that work: using questionnaires to gather useful data, November 2010
Surveys that work: using questionnaires to gather useful data, November 2010
 
Resource and technology design process
Resource and technology  design processResource and technology  design process
Resource and technology design process
 
Surveys in practice and theory
Surveys in practice and theorySurveys in practice and theory
Surveys in practice and theory
 
Experimentation Excellence: Mastering the basics
Experimentation Excellence: Mastering the basicsExperimentation Excellence: Mastering the basics
Experimentation Excellence: Mastering the basics
 
Uxpin guide to_usability_testing
Uxpin guide to_usability_testingUxpin guide to_usability_testing
Uxpin guide to_usability_testing
 
Mindmaps and heuristics tester's best friends - lalit bhamare
Mindmaps and heuristics  tester's best friends - lalit bhamareMindmaps and heuristics  tester's best friends - lalit bhamare
Mindmaps and heuristics tester's best friends - lalit bhamare
 
Creating Rubrics
Creating RubricsCreating Rubrics
Creating Rubrics
 
Usability Testing On A Digital Product
Usability Testing On A Digital ProductUsability Testing On A Digital Product
Usability Testing On A Digital Product
 
1.2.3.4.5.6.7.8..docx
1.2.3.4.5.6.7.8..docx1.2.3.4.5.6.7.8..docx
1.2.3.4.5.6.7.8..docx
 
Writing Research Comparison White Papers
Writing Research Comparison White PapersWriting Research Comparison White Papers
Writing Research Comparison White Papers
 
Survey Design Disaster Avoidance, Part 2 | SoGoSurvey
Survey Design Disaster Avoidance, Part 2 | SoGoSurveySurvey Design Disaster Avoidance, Part 2 | SoGoSurvey
Survey Design Disaster Avoidance, Part 2 | SoGoSurvey
 
Notes on usability testing
Notes on usability testingNotes on usability testing
Notes on usability testing
 
Usability Testing and User-Centered Design
Usability Testing and User-Centered DesignUsability Testing and User-Centered Design
Usability Testing and User-Centered Design
 
Usability Testing
Usability TestingUsability Testing
Usability Testing
 
Usability Primer - for Alberta Municipal Webmasters Working Group
Usability Primer - for Alberta Municipal Webmasters Working GroupUsability Primer - for Alberta Municipal Webmasters Working Group
Usability Primer - for Alberta Municipal Webmasters Working Group
 
Master the Essentials of Conversion Optimization
Master the Essentials of Conversion Optimization Master the Essentials of Conversion Optimization
Master the Essentials of Conversion Optimization
 
Conversion Optimization Willa Fogarty
Conversion Optimization Willa FogartyConversion Optimization Willa Fogarty
Conversion Optimization Willa Fogarty
 
Assignment 6
Assignment 6Assignment 6
Assignment 6
 

Mais de Zachary Williamson

Engl 208 03 self-documentary assignment sheet
Engl 208 03 self-documentary assignment sheetEngl 208 03 self-documentary assignment sheet
Engl 208 03 self-documentary assignment sheetZachary Williamson
 
Engl 208 03 essay ala bluets assignment sheet
Engl 208 03 essay ala bluets assignment sheetEngl 208 03 essay ala bluets assignment sheet
Engl 208 03 essay ala bluets assignment sheetZachary Williamson
 
Engl317 assignment sheet_project4
Engl317 assignment sheet_project4Engl317 assignment sheet_project4
Engl317 assignment sheet_project4Zachary Williamson
 
Engl317 project4 slidedoc1_about_usabilitytesting
Engl317 project4 slidedoc1_about_usabilitytestingEngl317 project4 slidedoc1_about_usabilitytesting
Engl317 project4 slidedoc1_about_usabilitytestingZachary Williamson
 
Engl317 project4 slidedoc3_technical_whitepaper
Engl317 project4 slidedoc3_technical_whitepaperEngl317 project4 slidedoc3_technical_whitepaper
Engl317 project4 slidedoc3_technical_whitepaperZachary Williamson
 
Engl317 project4 slidedoc4_screencasting_usability_testfinding
Engl317 project4 slidedoc4_screencasting_usability_testfindingEngl317 project4 slidedoc4_screencasting_usability_testfinding
Engl317 project4 slidedoc4_screencasting_usability_testfindingZachary Williamson
 
Engl317 project3 slidedoc1_graphic_designprinciplesfornondesigners
Engl317 project3 slidedoc1_graphic_designprinciplesfornondesignersEngl317 project3 slidedoc1_graphic_designprinciplesfornondesigners
Engl317 project3 slidedoc1_graphic_designprinciplesfornondesignersZachary Williamson
 
Engl317 project3 slidedoc2_howto_createyourinfographic
Engl317 project3 slidedoc2_howto_createyourinfographicEngl317 project3 slidedoc2_howto_createyourinfographic
Engl317 project3 slidedoc2_howto_createyourinfographicZachary Williamson
 
Engl317 project3 slidedoc3_screencasting_design_justification_
Engl317 project3 slidedoc3_screencasting_design_justification_Engl317 project3 slidedoc3_screencasting_design_justification_
Engl317 project3 slidedoc3_screencasting_design_justification_Zachary Williamson
 
Engl317 project2 slidedoc1_about_technical_definitions_and_descriptions
Engl317 project2 slidedoc1_about_technical_definitions_and_descriptionsEngl317 project2 slidedoc1_about_technical_definitions_and_descriptions
Engl317 project2 slidedoc1_about_technical_definitions_and_descriptionsZachary Williamson
 
Engl317 project2 slidedoc3_how_to_create_the_slidecast
Engl317 project2 slidedoc3_how_to_create_the_slidecastEngl317 project2 slidedoc3_how_to_create_the_slidecast
Engl317 project2 slidedoc3_how_to_create_the_slidecastZachary Williamson
 
Engl317 project2 slidedoc2_how_to_write_the_technical_documentation
Engl317 project2 slidedoc2_how_to_write_the_technical_documentationEngl317 project2 slidedoc2_how_to_write_the_technical_documentation
Engl317 project2 slidedoc2_how_to_write_the_technical_documentationZachary Williamson
 
Engl317 project2 slidedoc4_optional_metaphors_similiesanalogies
Engl317 project2 slidedoc4_optional_metaphors_similiesanalogiesEngl317 project2 slidedoc4_optional_metaphors_similiesanalogies
Engl317 project2 slidedoc4_optional_metaphors_similiesanalogiesZachary Williamson
 
F2 f project2_schedule_engl317_spring2019
F2 f project2_schedule_engl317_spring2019F2 f project2_schedule_engl317_spring2019
F2 f project2_schedule_engl317_spring2019Zachary Williamson
 
F2 f project3_schedule_engl317_spring2019
F2 f project3_schedule_engl317_spring2019F2 f project3_schedule_engl317_spring2019
F2 f project3_schedule_engl317_spring2019Zachary Williamson
 
F2 f project4_schedule_engl317_spring2019
F2 f project4_schedule_engl317_spring2019F2 f project4_schedule_engl317_spring2019
F2 f project4_schedule_engl317_spring2019Zachary Williamson
 
F2 f project5_schedule_engl317_spring2019
F2 f project5_schedule_engl317_spring2019F2 f project5_schedule_engl317_spring2019
F2 f project5_schedule_engl317_spring2019Zachary Williamson
 
F2 f project1_schedule_engl317_spring2019
F2 f project1_schedule_engl317_spring2019F2 f project1_schedule_engl317_spring2019
F2 f project1_schedule_engl317_spring2019Zachary Williamson
 
Engl317 orientation about_technicalwriting
Engl317 orientation about_technicalwritingEngl317 orientation about_technicalwriting
Engl317 orientation about_technicalwritingZachary Williamson
 
Online project4 schedule_engl317_spring2019
Online project4 schedule_engl317_spring2019Online project4 schedule_engl317_spring2019
Online project4 schedule_engl317_spring2019Zachary Williamson
 

Mais de Zachary Williamson (20)

Engl 208 03 self-documentary assignment sheet
Engl 208 03 self-documentary assignment sheetEngl 208 03 self-documentary assignment sheet
Engl 208 03 self-documentary assignment sheet
 
Engl 208 03 essay ala bluets assignment sheet
Engl 208 03 essay ala bluets assignment sheetEngl 208 03 essay ala bluets assignment sheet
Engl 208 03 essay ala bluets assignment sheet
 
Engl317 assignment sheet_project4
Engl317 assignment sheet_project4Engl317 assignment sheet_project4
Engl317 assignment sheet_project4
 
Engl317 project4 slidedoc1_about_usabilitytesting
Engl317 project4 slidedoc1_about_usabilitytestingEngl317 project4 slidedoc1_about_usabilitytesting
Engl317 project4 slidedoc1_about_usabilitytesting
 
Engl317 project4 slidedoc3_technical_whitepaper
Engl317 project4 slidedoc3_technical_whitepaperEngl317 project4 slidedoc3_technical_whitepaper
Engl317 project4 slidedoc3_technical_whitepaper
 
Engl317 project4 slidedoc4_screencasting_usability_testfinding
Engl317 project4 slidedoc4_screencasting_usability_testfindingEngl317 project4 slidedoc4_screencasting_usability_testfinding
Engl317 project4 slidedoc4_screencasting_usability_testfinding
 
Engl317 project3 slidedoc1_graphic_designprinciplesfornondesigners
Engl317 project3 slidedoc1_graphic_designprinciplesfornondesignersEngl317 project3 slidedoc1_graphic_designprinciplesfornondesigners
Engl317 project3 slidedoc1_graphic_designprinciplesfornondesigners
 
Engl317 project3 slidedoc2_howto_createyourinfographic
Engl317 project3 slidedoc2_howto_createyourinfographicEngl317 project3 slidedoc2_howto_createyourinfographic
Engl317 project3 slidedoc2_howto_createyourinfographic
 
Engl317 project3 slidedoc3_screencasting_design_justification_
Engl317 project3 slidedoc3_screencasting_design_justification_Engl317 project3 slidedoc3_screencasting_design_justification_
Engl317 project3 slidedoc3_screencasting_design_justification_
 
Engl317 project2 slidedoc1_about_technical_definitions_and_descriptions
Engl317 project2 slidedoc1_about_technical_definitions_and_descriptionsEngl317 project2 slidedoc1_about_technical_definitions_and_descriptions
Engl317 project2 slidedoc1_about_technical_definitions_and_descriptions
 
Engl317 project2 slidedoc3_how_to_create_the_slidecast
Engl317 project2 slidedoc3_how_to_create_the_slidecastEngl317 project2 slidedoc3_how_to_create_the_slidecast
Engl317 project2 slidedoc3_how_to_create_the_slidecast
 
Engl317 project2 slidedoc2_how_to_write_the_technical_documentation
Engl317 project2 slidedoc2_how_to_write_the_technical_documentationEngl317 project2 slidedoc2_how_to_write_the_technical_documentation
Engl317 project2 slidedoc2_how_to_write_the_technical_documentation
 
Engl317 project2 slidedoc4_optional_metaphors_similiesanalogies
Engl317 project2 slidedoc4_optional_metaphors_similiesanalogiesEngl317 project2 slidedoc4_optional_metaphors_similiesanalogies
Engl317 project2 slidedoc4_optional_metaphors_similiesanalogies
 
F2 f project2_schedule_engl317_spring2019
F2 f project2_schedule_engl317_spring2019F2 f project2_schedule_engl317_spring2019
F2 f project2_schedule_engl317_spring2019
 
F2 f project3_schedule_engl317_spring2019
F2 f project3_schedule_engl317_spring2019F2 f project3_schedule_engl317_spring2019
F2 f project3_schedule_engl317_spring2019
 
F2 f project4_schedule_engl317_spring2019
F2 f project4_schedule_engl317_spring2019F2 f project4_schedule_engl317_spring2019
F2 f project4_schedule_engl317_spring2019
 
F2 f project5_schedule_engl317_spring2019
F2 f project5_schedule_engl317_spring2019F2 f project5_schedule_engl317_spring2019
F2 f project5_schedule_engl317_spring2019
 
F2 f project1_schedule_engl317_spring2019
F2 f project1_schedule_engl317_spring2019F2 f project1_schedule_engl317_spring2019
F2 f project1_schedule_engl317_spring2019
 
Engl317 orientation about_technicalwriting
Engl317 orientation about_technicalwritingEngl317 orientation about_technicalwriting
Engl317 orientation about_technicalwriting
 
Online project4 schedule_engl317_spring2019
Online project4 schedule_engl317_spring2019Online project4 schedule_engl317_spring2019
Online project4 schedule_engl317_spring2019
 

Último

mini mental status format.docx
mini    mental       status     format.docxmini    mental       status     format.docx
mini mental status format.docxPoojaSen20
 
Mastering the Unannounced Regulatory Inspection
Mastering the Unannounced Regulatory InspectionMastering the Unannounced Regulatory Inspection
Mastering the Unannounced Regulatory InspectionSafetyChain Software
 
Web & Social Media Analytics Previous Year Question Paper.pdf
Web & Social Media Analytics Previous Year Question Paper.pdfWeb & Social Media Analytics Previous Year Question Paper.pdf
Web & Social Media Analytics Previous Year Question Paper.pdfJayanti Pande
 
BAG TECHNIQUE Bag technique-a tool making use of public health bag through wh...
BAG TECHNIQUE Bag technique-a tool making use of public health bag through wh...BAG TECHNIQUE Bag technique-a tool making use of public health bag through wh...
BAG TECHNIQUE Bag technique-a tool making use of public health bag through wh...Sapna Thakur
 
Introduction to Nonprofit Accounting: The Basics
Introduction to Nonprofit Accounting: The BasicsIntroduction to Nonprofit Accounting: The Basics
Introduction to Nonprofit Accounting: The BasicsTechSoup
 
POINT- BIOCHEMISTRY SEM 2 ENZYMES UNIT 5.pptx
POINT- BIOCHEMISTRY SEM 2 ENZYMES UNIT 5.pptxPOINT- BIOCHEMISTRY SEM 2 ENZYMES UNIT 5.pptx
POINT- BIOCHEMISTRY SEM 2 ENZYMES UNIT 5.pptxSayali Powar
 
Call Girls in Dwarka Mor Delhi Contact Us 9654467111
Call Girls in Dwarka Mor Delhi Contact Us 9654467111Call Girls in Dwarka Mor Delhi Contact Us 9654467111
Call Girls in Dwarka Mor Delhi Contact Us 9654467111Sapana Sha
 
Nutritional Needs Presentation - HLTH 104
Nutritional Needs Presentation - HLTH 104Nutritional Needs Presentation - HLTH 104
Nutritional Needs Presentation - HLTH 104misteraugie
 
Sanyam Choudhary Chemistry practical.pdf
Sanyam Choudhary Chemistry practical.pdfSanyam Choudhary Chemistry practical.pdf
Sanyam Choudhary Chemistry practical.pdfsanyamsingh5019
 
Measures of Dispersion and Variability: Range, QD, AD and SD
Measures of Dispersion and Variability: Range, QD, AD and SDMeasures of Dispersion and Variability: Range, QD, AD and SD
Measures of Dispersion and Variability: Range, QD, AD and SDThiyagu K
 
Advanced Views - Calendar View in Odoo 17
Advanced Views - Calendar View in Odoo 17Advanced Views - Calendar View in Odoo 17
Advanced Views - Calendar View in Odoo 17Celine George
 
Disha NEET Physics Guide for classes 11 and 12.pdf
Disha NEET Physics Guide for classes 11 and 12.pdfDisha NEET Physics Guide for classes 11 and 12.pdf
Disha NEET Physics Guide for classes 11 and 12.pdfchloefrazer622
 
The Most Excellent Way | 1 Corinthians 13
The Most Excellent Way | 1 Corinthians 13The Most Excellent Way | 1 Corinthians 13
The Most Excellent Way | 1 Corinthians 13Steve Thomason
 
Activity 01 - Artificial Culture (1).pdf
Activity 01 - Artificial Culture (1).pdfActivity 01 - Artificial Culture (1).pdf
Activity 01 - Artificial Culture (1).pdfciinovamais
 
Ecosystem Interactions Class Discussion Presentation in Blue Green Lined Styl...
Ecosystem Interactions Class Discussion Presentation in Blue Green Lined Styl...Ecosystem Interactions Class Discussion Presentation in Blue Green Lined Styl...
Ecosystem Interactions Class Discussion Presentation in Blue Green Lined Styl...fonyou31
 
Arihant handbook biology for class 11 .pdf
Arihant handbook biology for class 11 .pdfArihant handbook biology for class 11 .pdf
Arihant handbook biology for class 11 .pdfchloefrazer622
 
The basics of sentences session 2pptx copy.pptx
The basics of sentences session 2pptx copy.pptxThe basics of sentences session 2pptx copy.pptx
The basics of sentences session 2pptx copy.pptxheathfieldcps1
 

Último (20)

mini mental status format.docx
mini    mental       status     format.docxmini    mental       status     format.docx
mini mental status format.docx
 
Mastering the Unannounced Regulatory Inspection
Mastering the Unannounced Regulatory InspectionMastering the Unannounced Regulatory Inspection
Mastering the Unannounced Regulatory Inspection
 
Web & Social Media Analytics Previous Year Question Paper.pdf
Web & Social Media Analytics Previous Year Question Paper.pdfWeb & Social Media Analytics Previous Year Question Paper.pdf
Web & Social Media Analytics Previous Year Question Paper.pdf
 
BAG TECHNIQUE Bag technique-a tool making use of public health bag through wh...
BAG TECHNIQUE Bag technique-a tool making use of public health bag through wh...BAG TECHNIQUE Bag technique-a tool making use of public health bag through wh...
BAG TECHNIQUE Bag technique-a tool making use of public health bag through wh...
 
Introduction to Nonprofit Accounting: The Basics
Introduction to Nonprofit Accounting: The BasicsIntroduction to Nonprofit Accounting: The Basics
Introduction to Nonprofit Accounting: The Basics
 
POINT- BIOCHEMISTRY SEM 2 ENZYMES UNIT 5.pptx
POINT- BIOCHEMISTRY SEM 2 ENZYMES UNIT 5.pptxPOINT- BIOCHEMISTRY SEM 2 ENZYMES UNIT 5.pptx
POINT- BIOCHEMISTRY SEM 2 ENZYMES UNIT 5.pptx
 
Call Girls in Dwarka Mor Delhi Contact Us 9654467111
Call Girls in Dwarka Mor Delhi Contact Us 9654467111Call Girls in Dwarka Mor Delhi Contact Us 9654467111
Call Girls in Dwarka Mor Delhi Contact Us 9654467111
 
Nutritional Needs Presentation - HLTH 104
Nutritional Needs Presentation - HLTH 104Nutritional Needs Presentation - HLTH 104
Nutritional Needs Presentation - HLTH 104
 
Mattingly "AI & Prompt Design: The Basics of Prompt Design"
Mattingly "AI & Prompt Design: The Basics of Prompt Design"Mattingly "AI & Prompt Design: The Basics of Prompt Design"
Mattingly "AI & Prompt Design: The Basics of Prompt Design"
 
Advance Mobile Application Development class 07
Advance Mobile Application Development class 07Advance Mobile Application Development class 07
Advance Mobile Application Development class 07
 
Sanyam Choudhary Chemistry practical.pdf
Sanyam Choudhary Chemistry practical.pdfSanyam Choudhary Chemistry practical.pdf
Sanyam Choudhary Chemistry practical.pdf
 
Código Creativo y Arte de Software | Unidad 1
Código Creativo y Arte de Software | Unidad 1Código Creativo y Arte de Software | Unidad 1
Código Creativo y Arte de Software | Unidad 1
 
Measures of Dispersion and Variability: Range, QD, AD and SD
Measures of Dispersion and Variability: Range, QD, AD and SDMeasures of Dispersion and Variability: Range, QD, AD and SD
Measures of Dispersion and Variability: Range, QD, AD and SD
 
Advanced Views - Calendar View in Odoo 17
Advanced Views - Calendar View in Odoo 17Advanced Views - Calendar View in Odoo 17
Advanced Views - Calendar View in Odoo 17
 
Disha NEET Physics Guide for classes 11 and 12.pdf
Disha NEET Physics Guide for classes 11 and 12.pdfDisha NEET Physics Guide for classes 11 and 12.pdf
Disha NEET Physics Guide for classes 11 and 12.pdf
 
The Most Excellent Way | 1 Corinthians 13
The Most Excellent Way | 1 Corinthians 13The Most Excellent Way | 1 Corinthians 13
The Most Excellent Way | 1 Corinthians 13
 
Activity 01 - Artificial Culture (1).pdf
Activity 01 - Artificial Culture (1).pdfActivity 01 - Artificial Culture (1).pdf
Activity 01 - Artificial Culture (1).pdf
 
Ecosystem Interactions Class Discussion Presentation in Blue Green Lined Styl...
Ecosystem Interactions Class Discussion Presentation in Blue Green Lined Styl...Ecosystem Interactions Class Discussion Presentation in Blue Green Lined Styl...
Ecosystem Interactions Class Discussion Presentation in Blue Green Lined Styl...
 
Arihant handbook biology for class 11 .pdf
Arihant handbook biology for class 11 .pdfArihant handbook biology for class 11 .pdf
Arihant handbook biology for class 11 .pdf
 
The basics of sentences session 2pptx copy.pptx
The basics of sentences session 2pptx copy.pptxThe basics of sentences session 2pptx copy.pptx
The basics of sentences session 2pptx copy.pptx
 

Engl317 project4 slidedoc2_stepsto_designux_test

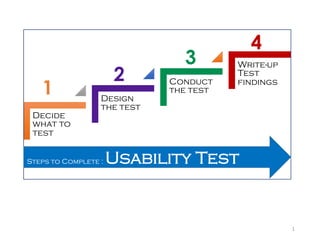
  • 1. 1 Decide what to test Design the test Conduct the test Write-up Test findings 1 2 3 4 Steps to Complete : Usability Test
  • 2. STEP 1: DECIDE WHAT TO TEST Option 1 Test usability of two communication products and compare outcomes. Option 2 Test usability of one website. OR Test usability of two websites and compare outcomes. 2 The next few slides will give you some ideas for what to test based on each option. You may use any of these ideas or come up with your own.
  • 3. 3 Option 1: Ideas (compare 2) Word Processing Microsoft Word, Open Office, Google Docs Image Editing Gimp, Adobe Photoshop, Pixelmator Website Creators Wix, Weebly, JIMDO 3-D Modeling AutoCad, OpenScaD, SolidWorks, FreeCAD MOBILE APPLICATIONS You may test two apps. These may be the mobile versions of software or stand-alone Apps. Just be certain any stand-alone apps are complex enough to test USABILITY. Ask me if you are uncertain.
  • 4. The two Products: • Need to be comparable. 4 xThey don’t need to have the exact same features. But they need to be the same type of product. Example: AutoCad does not have the same features as SolidWorks but both are 3-D modeling tools, and Pixelmator does not have the same features as Adobe Photoshop but both are image creators/editors.
  • 5. 5 Option 2: Ideas US Internal Revenue Service Idaho Department of Fish and Game Idaho Department of Labor University of Idaho These are just a few ideas. Many other possibilities exist.
  • 6. 6 Option 2: Test one or Tw0? • You may choose to test one website or compare two websites that are similar such as two department of fish and game sites or two university sites. The key is to choose a website that has complexity, where users need to find and/or do stuff. • I provide the option of choosing just one website because often it is not possible to compare two sites if what you want to test is not accessible to you. • For example, you culd not compare how to enroll in classes at the University of Idaho compared to Boise State because you would not have access to both of these.
  • 7. If you Test Two Websites: • They need to be comparable. 7 They don’t need to have the exact same features. But they need to be the same type of product. Example: Some states have fish and game websites with more features than others, but both are the same type of website. You may also compare two university sites from the viewpoint of a user who is not enrolled in either: a prospective student. x
  • 8. Step 2: Designing the Test 2.1 Identify users and and level of knowledge. 2.2 Decide test tasks. 2.3 Design test metrics. 2.4 Create data collection form 2.5 Decide test environment and equipment. 8
  • 9. 2.1: Identify Users 9 • Identify typical users of the product or website and decide their level of knowledge/background. For example, engineering students who have never used AutoCad or SolidWorks would bring a level of knowledge when using the products that others outside of engineering would not possess. A hunter using the Idaho Department of Fish and Game website would bring a level of knowledge to the site that a non-hunter would not possess.
  • 10. 2.2: Decide Test Tasks 10 • If testing two communication products or two websites, you will need to test approximately 10 specific tasks. Avoid tasks that are too basic to evaluate usability. Example: testing how to save a document file. • If you are testing one website, you will need approximately 20 specific tasks (refer to slide 6 in this slidedoc if you are confused about why I offer the option of testing just one website). • If you have no idea what type of tasks can be done with a product, then consult the product’s HelpCenter only to determine what types of things the product or website will let users do.
  • 11. 2.2: Decide Test Tasks continued 11 Example: Here is a screenshot of Weebly’s Help Center. Do not spend time trying to learn how to do a task because you will be testing learnability as one component of your test. Simply use the help page menus to derive a list of the tasks.
  • 12. 2.3: Design Test Metrics 12 Metrics are the means by which you will evaluate the following five components that define usability. 1. Effective: were you able to complete the task? Also means achieving goals. 2. Efficient: how long (or number of clicks) did it take you to perform a task and is that amount of time reasonable? 3. Engaging: Did the product’s style and appearance enhance your user experience? 4. Error Tolerant: How many times did you attempt an action that did not work? when you made an error or a false start, did the product give you feedback where needed? 5. Easy to Learn: how easy was it to learn how to do a task?
  • 13. 2.3: Design Test Metrics continued 13 Your test metrics will need to include the following: – Qualitative Data: five criteria statements aimed at evaluating the five components that define usability. You must write STATEMENTS and not questions. – Quantitative Data: a fixed-response Likert Scale that allows you to measure your level of agreement or disagreement with each criteria statement.
  • 14. • Example: the following statement would measure learning ability (component 5). • I was able to complete the task without consulting the product’s HelpCenter. 14 Strongly Agree Strongly Disagree 5 4 3 2 15 2.3: Design Test Metrics Continued
  • 15. 15 In 1932, Rensis Likert invented a means of measuring responses to a survey. He showed how asking respondents to place themselves on a scale of favor/disfavor with a neutral midpoint worked better than other means of measuring responses. The Likert scale has since been adopted throughout the world. 2.3: Design Test Metrics Continued About Likert Scales
  • 16. The neutral midpoint of Likert’s five-point scale is a matter of considerable debate. 16 2.3: Design Test Metrics Continued
  • 17. The debate about the midpoint. 17 Although Likert advocated for the use of a 5-point scale, researchers have since argued for more points to increase the reliability and validity of the scale. Their arguments are based on findings from studies about how respondents choose items on the scale. 2.3: Design Test Metrics Continued
  • 18. What research has shown about why respondents chose the mid-point: • Respondents may be unmotivated to make an effort to choose anything else. • Respondents may be ambivalent. • Respondents may be reluctant to voice a socially undesirable response. 18 Based on these findings, some researchers advocate eliminating the midpoint or adding more items to the scale. 2.3: Design Test Metrics Continued
  • 19. 19 2.3: Design Test Metrics Continued • The debate among researchers also includes how the scales should be labeled. Here are two ways to avoid the mid point problem. 1. Eliminate all but the end labels. 2. Add a sixth response choice.
  • 20. Labeling end points only or labeling all points is also a matter of debate. 20 There seems to be a pattern here. What does the research show?
  • 21. What research has shown about labeling. • Labeling End Points Only: respondents are more attracted to labeled points, so just labeling the end points may result in a bias towards extreme answers. • Labeling All Points: respondents are more attracted to intermediate options, so it can lower extremeness of responses, which is good. But, it may also increase levels of positivity bias, the tendency to respond with a positive answer, which is not good. 21
  • 22. Even the direction of labels/numbers is debated. Should 1 start the scale or should the last number and how many items 5, 6, 7 more?? 22 Good grief. Maybe they should seek counseling.
  • 23. 23 Hey Karen, thanks for that, but we are now thoroughly confused. Which scale do you want us to use?
  • 24. • In 1956, a researcher named George Miller conducted some experiments on short-term memory. • He published the results in a paper: The Magical Number Seven, Plus or Minus Two: Some Limits on Our Capacity for Processing Information. • His experiments lead him to conclude we can only retain 5 to 9 items in our short term memory. 24 It’s your choice, but here are some things to think about.
  • 25. His paper is cited as the reason why Bell Telephone chose to issue only seven digit phone numbers. 25 Call me back. My number is 1234567
  • 26. Tip #1: Keep it Simple 26 Do you really want to deal with interpreting the nuances of these scales? Just sayin..... Those are just plain scary.
  • 27. Tip #2: Be consistent 27 • Use the same scale for all criteria statements. • Don’t switch from a five-point to a seven-point and then to a four-point. • Keep the positions of the value labels the same. • If you start with negative type value labels on the left of the scale (levels of disagree) and positive on the right (levels of agree), don’t change the positions. • Example of inconsistent value labels:
  • 28. Tip #3: Use Numbers 28 • A Likert Scale is not a Likert Scale unless it has numbers. • That’s the whole point of using it. • You want to connect qualitative criteria statements to a quantitative measure.
  • 29. Tip #4: Compose criteria statements. 29 • A criteria statement has to be written in a way that a respondent (in this project the respondent is you) can answer by rating the level of agreement with that statement. • Ease of use. • I was able to complete the task without consulting the product’s HelpSection.
  • 30. • You will need a means of collecting the data for each task you do. • You may create a data collection form for this purpose or use a spreadsheet. • Your form or spreadsheet will need to list each tasks with the five criteria statements plus the Likert Scale and a place to take notes. 30 2.4: Create Data collection Form
  • 31. 31 2.4: Example You will need 10 pages using a form like this. One for each of the ten tasks.
  • 32. 32 2.4: Data Collection Option If you know how to use a spreadsheet, that is another option for collecting the data.
  • 33. 2.5: Choose Test Environment and Equipment 33 • In the white paper write-up of test findings, you will need to describe the test environment (where you conducted the test) and the equipment you used (PC? Mac? Operating system? Etc.). • The test environment should be a quiet place where you can work without interruption. • If you do the test in more than one setting, be consistent with the environment and equipment you use.
  • 34. Step 3: Conduct the Test 3.1 Become the user. 3.2 Do each task, take notes, score usability. 3.3 Take screenshots. 34
  • 35. 3.1: Become the User 35 • To do the test, you need to set aside what you may already know about how to use the products or website(s) because the test is about you playing the role of a new user.
  • 36. 3.2: Do each Task 36 • Pay close attention to what happens when you do a task in the five component areas that define usability. • Score your level of agreement or disagreement with the criteria statements in the data collection form or spreadsheet. AND • Take notes to help you describe what happened as you did the task and to offer any recommendations about how to improve the product or website.
  • 37. 3.3: Take Screenshots 37 • Take screenshots as you take notes. • The number of screenshots you take should work to support the descriptions you will write. • You will need to size these to be appropriate to the page layout in your white paper. • Often screenshots are difficult to wrap text around. That’s fine, but do keep the screenshot close to the textual information it is supporting. Remember to label, caption, and refer t screenshots in the text.
  • 38. Write-Up Test Results 38 • You will be writing-up the test results (findings) in a technical white paper. • What white papers are and how to write your is covered in another lecture.