matemática e música
•
1 gostou•382 visualizações

This document discusses the challenges of teaching introductory statistics compared to teaching mathematics. While mathematics can be taught in a linear, logical order and has produced child prodigies, statistics requires life experience and judgment to understand concepts like variation, conditional probabilities, and vague concepts. It is difficult to teach students these higher-level critical thinking skills needed for statistics in just one semester. The document argues that statistics should be taught as its own discipline focusing on developing students' statistical reasoning abilities, not just memorizing formulas, and that this approach is important but challenging to implement effectively.

Recomendados
Recomendados
Mais conteúdo relacionado
Semelhante a matemática e música
Semelhante a matemática e música (17)
Mais de Diogo Freire
Mais de Diogo Freire (12)
Último
Último (20)
matemática e música
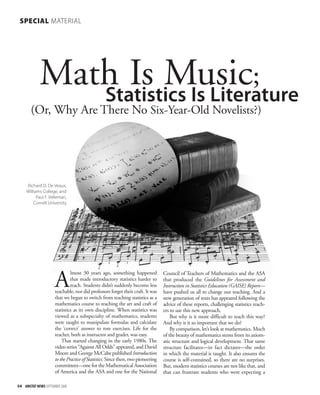
- 1. Math Is Music; Statistics Is Literature (Or, Why Are There No Six-Year-Old Novelists?) Richard D. De Veaux, Williams College, and Paul F. Velleman, Cornell University Almost 30 years ago, something happened 54 AMSTAT NEWS SEPTEMBER 2008 that made introductory statistics harder to teach. Students didn’t suddenly become less teachable, nor did professors forget their craft. It was that we began to switch from teaching statistics as a mathematics course to teaching the art and craft of statistics as its own discipline. When statistics was viewed as a subspecialty of mathematics, students were taught to manipulate formulas and calculate the ‘correct’ answer to rote exercises. Life for the teacher, both as instructor and grader, was easy. That started changing in the early 1980s. The video series “Against All Odds” appeared, and David Moore and George McCabe published Introduction to the Practice of Statistics. Since then, two pioneering committees—one for the Mathematical Association of America and the ASA and one for the National Council of Teachers of Mathematics and the ASA that produced the Guidelines for Assessment and Instruction in Statistics Education (GAISE) Report— have pushed us all to change our teaching. And a new generation of texts has appeared following the advice of these reports, challenging statistics teach-ers to use this new approach. But why is it more difficult to teach this way? And why is it so important that we do? By comparison, let’s look at mathematics. Much of the beauty of mathematics stems from its axiom-atic structure and logical development. That same structure facilitates—in fact dictates—the order in which the material is taught. It also ensures the course is self-contained, so there are no surprises. But, modern statistics courses are not like that, and that can frustrate students who were expecting a SPECIAL MATERIAL
- 2. SEPTEMBER 2008 AMSTAT NEWS 55 math class. As a student of one of us once wrote on the course evaluation form, “This course should be more like a math course, with everything you need laid out beforehand.” Mathematics has a long history of prodigies and geniuses, with many of the most famous luminar-ies showing their genius at remarkably early ages. We’ve all heard at least one version of the famous story of young Carl Friedrich Gauss. A web search finds more than 100 retellings of the story, but an article by Brian Hayes in American Scientist’s “Gauss’s Day of Reckoning” identifies a version actually recounted at Gauss’ funeral. In that ver-sion, Gauss—age 7 and the youngest in the class— summed the numbers from 1 to 100 in seconds, wrote the answer on his slate, and then threw it down on the table mumbling “there it lies” in the local dialect. It was perhaps an hour later that the teacher discovered that his answer was, in fact, the only correct one in the room. Prodigies in math can develop at remarkably early ages because math creates its own self-con-sistent and isolated world. Pascal had worked out the first 23 propositions of Euclid by age 12 when his parents, who wanted him to concentrate on religion, finally relented and presented him with a copy of Euclid’s Elements. Galois wrote down the essentials of what later became Galois Theory the night before a fateful duel when he was 20, or so the legend has it. In the modern era, Norbert Weiner entered Tufts at age 11; Charles Pfefferman of Princeton was, at 22, the youngest full professor in American history; and Ruth Lawrence of Hebrew University passed her A-levels in pure math at age 9 and became the youngest student ever to enroll at Oxford two years later. Of course, mathematics isn’t the only field that shows prodigies. Mozart, Schumann, and Mendelssohn, among others, were young musical prodigies. Even though his music matured, it is Carl Friedrich Gauss, a math prodigy at the age of 7 Blaise Pascal was a French mathematician, and a prodigy by the age of 12. Évariste Galois was a French mathematician and prodigy who finished the Galois Theory by the time he turned 20. remarkable that some of the music Mozart wrote at age 5 is still in the repertoire. Also, chess prodigies continue to appear. Sergey Karjakin is the youngest grandmaster ever at 12 years, 7 months. The infamous late Bobby Fischer—who was youngest in 1958 when he became a grand master at 15 years, 6 months, and 1 day—is now only 19th on that list. But there are only a few fields that develop prodigies, and all seem to be self-contained. For example, as professor of English at the University of Connecticut, Thomas Dulack observed, “There are no child prodigies in literature.” Although one might argue that William Cullen Bryant, Thomas Chatterton, H. P. Lovecraft, or Mattie Stepanek qualifies as a literary prodigy, that list doesn’t have quite the same panache as the others we’ve cited. It’s no easier to find prodigies in art, poetry, philosophy, or other endeavors that require life experience. What does any of this have to do with statistics and how can it help us understand why introduc-tory statistics is so hard to teach? The challenge for the student (and teacher) of introductory statistics is that, as literature and art, navigating through and making sense of it requires not just rules and axioms, but life experience and “common sense.” Although working with elementary statistics requires some mathematical skills, we ask so much more of the intro stats student than is required by, for example, a student in his or her first calculus course. A student in calculus I is not asked to com-ment on whether a question makes sense, whether the assumptions are satisfied (e.g., Is the reservoir from which the water pouring really a cone?), to evaluate the consequences of the result, or to write a sentence or two to communicate the answer to others. But, that’s exactly what the modern intro stats course demands. The challenge we face is that, unlike calculus I, we have a wide variety of skills to teach, and most of them require judgment in addition to mathematical manipulation. Judgment is best taught by example and experience, which takes time. But, we’re sup-posed to produce a student capable of these skills in one term. It would be challenging enough to teach the definitions, formulas, and skills in the standard first course. To convey in addition the grounds for sound judg-ment is even more difficult. It should be no wonder that the first course in statistics is widely acknowledged to be one of the most difficult courses to teach in the university. It is not merely that we hope to teach judgment to sophomores; we are actually asking our students to change the way they reason about
- 3. SEPTEMBER 2008 AMSTAT NEWS 57 the real world. P. F. Velleman in his 2003 key-note address to the Beyond the Formula con-ference called the skills they must acquire the seven unnatural acts of statistical thinking: ➊ Think critically. Challenge the data’s credentials; look for biases and lurking variables. ➋ Be skeptical. Question authority and the current theory. (Well, okay, sophomores do find this natural.) ➌ Think about variation, rather than about center. ➍ Focus on what we don’t know. For example, a confidence interval exhibits how much we don’t know about the parameter. ➎ Perfect the process. Our best conclusion is often a refined question, but that means a student can’t memorize the ‘answer.’ ➏ Think about conditional probabilities and rare events. Humans just don’t do this well. Ask any gambler. But, without this, the student can’t understand a p-value. Embrace vague concepts. Symmetry, center, outlier, linear … the list of concepts fundamen-tal to statistics but left without firm definitions is quite long. What diligent student wanting to learn the ‘right answer’ wouldn’t be dismayed? How can we help students navigate these woods? We don’t have definitive answers to the question, in spite of our more than 50 years (combined) teaching of introductory statistics. But, we’d like to identify some themes that might help us as a community to start a conver-sation about some of the challenges. We can help students by giving them a structure for problemsolving that incorpo-rates the requirement that they exercise their judgment. In our books, we’ve recommended that students follow the steps W. E. Deming created more than 50 years ago in his advice to industry: plan, do, check, act. We’ve sub-stituted communicate for act to underscore the importance of communicating to oth-ers the results we see. Students must learn to communicate their results in plain language, not only in statistical jargon. As GAISE emphasized, we must place more emphasis on the plan and communicate steps. The emphasis of the traditional mathematical course, on the do step can be largely replaced by relying on technology for the calculations and graphics. In teaching students to think through the prob-lem, plan their attack, and communicate results, we bring students face-to-face with their real-world knowledge and experience—with the literature side of their maturing intellect. We owe them an acknowledgement that we’ve done this. It isn’t fair to emphasize the simplicity of the calculations or to just provide a bunch of definitions in little boxes. No comparative literature or philosophy teacher would do that, and neither should we. What guidance should we offer? First, we can note that the judgment often called for in statistics is one that invites students to state their personal views. (After all, they are the ones who must be 95% confident in their interval.) But, we can offer guidance for their judgments; they must be guided by the ethical goal of discovering, describing, mod-eling, and understanding truth about the world. Second, we can remind students their introduc-tory statistics course is related to every other course SPECIAL MATERIAL 7
- 4. Resources Guidelines for Assessment and Instruction in Statistics Education (GAISE) Report, www.amstat.org/education/gaise Hayes, Brian. (2006) “Gauss’s Day of Reckoning.” American Scientist, 94(3):200. Velleman, P.F. (2008) “Truth, Damn Truth, and Statistics.” Journal of Statistics Education, 16(2): www.amstat.org/publications/jse/v16n2/ velleman.html. Velleman, P.F. (2003) “Thinking With Data: Seven Unnatural Acts and Ten 400-Year-Old Aphorisms.” Keynote address to the Beyond the Formula conference, Rochester, New York. Weiss, Cindy. (2006) “New York Philharmonic Selects UConn Prof to Revive Concert Series.” http://advance.uconn. edu/2006/060424/06042412.htm they may study. The reason they are taking statis-tics (or perhaps, the reason it’s required) is that they are accumulating the kind of knowledge about the real world that will help them write literature and read philosophy, and that kind of knowledge makes them qualified to make statistical judgments. Of course, by asking students to call upon what they’ve learned in other courses, we are encouraging them to solidify their knowledge from those courses. Third, we must actually require students to demonstrate all the steps of a statistical analysis, from problem formulation to communicating the results to making real-world recommendations on what they find. Unfortunately, homework and exam problems that carry these requirements are harder to write and harder to grade. Training teach-ing assistants to reliably grade these efforts can be problematic. Moreover, many statistics instructors are not trained in statistics, and they, too, can find this approach challenging. But, the results of teach-ing a modern course reward both the student and teacher, in spite of its challenges. We should also face outward to the academic community. There is a wide-spread impression that introductory statistics can be taught—or even less plausible, can be learned—in a single term. Any objective consid-eration of the breadth and depth of the concepts and methods covered shows this to be absurdly optimistic. Yet, few academic programs require more than one course, and many of those that require two are cutting back. We need to argue as a discipline that an introductory statistics course must cover more than an introduction to inference for means if it is to teach the reasoning of statistics— and that teaching that reasoning must be its goal (not just teaching definitions and formulas.) But, a more complete course that covers techniques that require more than rudimentary sophistication, such as inference for regression and multiple regression, is unlikely to have time to teach judgment, plan-ning, and communication. It will most likely be pared down to a collection of equations and rules. As a community, we need to make it clear that the subject of statistics deserves both more respect and more time, not because it covers so many methods, but because it should teach the founda-tions of reasoning when we have data. Part of the argument might be that, unlike students in subjects that exhibit prodigies, our students must summon their real-world knowledge to learn to think statisti-cally. And, that the effort by statistics teachers and students will pay back correspondingly in all our students do. Math is sometimes said to be the lan-guage of science (and much social science), but sta-tistics should teach students the structure for what it communicates. Is the effort to teach the modern course worth it? We believe it is. Rather than a col-lection of techniques or a ‘cookbook’ of situa-tions and formulas, a modern course in statis-tics must teach students to reason about the world. Although that makes the course more difficult to teach and assess, it will make a dif-ference in students’ lives and serve them for the rest of their academic careers and beyond. ■ Editor’s Note: This paper is based on several talks given by the authors at the United S tates Conference on Teaching Statistics (USCOTS). SPECIAL MATERIAL