SlideShare uma empresa Scribd logo
1 de 53
Baixar para ler offline
How Eight California Data Centers
    Reduced Energy by 20%


  Sponsored by the California Energy Commission
         Public Interest Energy Research

   David Weightman, Energy Commission Specialist
           California Energy Commission
           dweightm@energy.state.ca.us

              Jenny Field, Marketing Manager
                         E Source
                 jenny_field@esource.com


                                               Wednesday, April 4, 2012
California Energy Commission


  Public Interest Energy Research
   • Solicitations
   • Demonstrations
   • Research Centers
   • Partnerships
   • Codes and Standards
California Energy Commission


  Public Interest Energy Research
 • Global Warming Solutions
   Act (AB32)
 • Loading Order (EAP)
 • Zero-Net Energy (LTEESP)
 • Clean Energy Jobs Plan
   (Executive Initiative)
California Energy Commission


  Public Interest Energy Research
  • Achieve Clean and
    Sustainable Energy Future
  • Reduce
    Pollution
  • Increase Resource
    Efficiency
  • Create Jobs
California Energy Commission


  Public Interest Energy Research

  Today’s Webinar:
  Background
California Energy Commission


  Public Interest Energy Research
   Today’s Speakers:
   Carl Boomgaarden
   Information Systems Analyst
   State of California

   Manuel Lujano
   Staff Information Analyst
   California Franchise Tax Board

   Dan Mascola
   Senior Energy Efficiency Analyst
   Vigilent
California Energy
Commission Webinar


Carl Boomgaarden
Office of Technology Services

April 4, 2012
Agenda

•   Gold Camp Data Center
•   Goals for the Project
•   Challenges
•   Implementation
•   Results
Gold Camp Data Center
44,000 sf located near
Sacramento, CA
• Serves more than
  500 State, County,
  Federal and Local
  Government entities    Source: Google Maps


• 23 CRAC units
  expanding to 48
• 1,010 racks
 4/2012
Gold Camp Data Center
Updating & Modernizing
• Upgrading and adding
  power distribution units
• Updating and adding static
  transfer switches
• Migrating customers’ power
                                 Source: Google Maps
  off old to new
• Realigning cabinets into hot
  aisle/cold aisle


  4/2012
Project Goals

• Continuous visibility for
  informed decisions
      • Improved planning options,
        capacity & growth
• Energy savings
      • Cut cooling costs up to 40%
      • Less CRAC wear and tear
• Modernize data center               Source: Gold Camp


      • Improve resiliency &
        redundancy
      • Reduce downtime risk
 4/2012
Challenges
• Data center in state of flux
         • IT equipment growing rapidly
• Power usage on constant incline
         • 2 MW going up to 3 MW
• Initially somewhat skeptical
         • How will the technology work in this
           data center?
         • What improvements will be delivered?
• 23 old 30-ton CRAC units
4/2012
Implementation

• Quick
         •   System up and running in 5 days
         •   275 wireless sensors
         •   6 wireless gateways
         •   23 CRAC units

• Added network wiring & VLAN IP addressing
         • Ethernet and power to wireless gateways
         • IP address for wireless gateways and server


4/2012
Implementation

                                         • Wireless sensors at
                                           top and bottom of IT
                                           server inlet air
                                         • System gives
                                           operations information
                                           they can use
                                         • Hot spots/cold spots
                                         • Adjust floor tiles
                   Results are visible   • Eliminate air gaps
Source: Vigilent
                     within days of
 4/2012
                      installation
Floor Temperature Visibility

• Easily identify hot/cold
  spots
         • Visual picture shows
           where to go look

• Red triangle means go
  look at what’s causing            Source: Vigilent

  temperature rise
         • Could be a box on the
           floor blocking airflow


4/2012
Cooling and Airflow Visibility

• More even temperatures
• Month 1: Turned 8 of 23
  CRACs off
• Month 2: Turned 10–11
  CRACs off
• Feb 2012: added 13 new
  CRAC units to the
  system
• After floor balancing, 18
                              Source: Vigilent
  of 36 CRACs are off
 4/2012
Power Usage

• Prior to project, steady rate of
  power increase in the data center
• After project, total power usage
  plateaued for a short time even
  as the data center continued
  to grow                             Source: Liebert PDU


• Power usage continues to
  increase, but at a slower rate


4/2012
Cooling at Room Level
• System adjusts as new
  conditions arise throughout
  the room for improved end-
  to-end reliability
• Capacity rating screen tells
  us CRAC unit on but running
  at low efficiency level, which
  could indicate pushing return
  air into the floor               Source: Gold Camp


• Leads operations to adjust
  local CRAC setpoints to
  increase cooling capability
 4/2012
CRAC Influence… At a Glance
• System shows the effect
  of every CRAC across
  the floor
         • Comprehensive, accurate,
           real-time airflow visual

• Operations looks at
  Vigilent constantly           wCRAC A
         • Saves money
         • Saves time                     Source: Vigilent


4/2012
Results
• Works as advertised
• Valuable tool helps operations do their job better
• Be more energy efficient
         • Support state data center consolidation
         • Use Vigilent as a map to ensure new equipment can
           be added
         • Can show management how we’re improving power
           consumption efficiency
• Extend cooling unit life due to decreased run time
• Lower risk due to cooling control across the
  entire floor
4/2012
Results
• Automatic monitoring of cooling control
         • Removed “human” factor
         • No more walking around checking/adjusting temperatures
• Automated ability of system to respond to changes
  works like a charm
         • Moved cooling units, moved power units, add/move cabinets
• Streamlined the process
         • See at a glance the conditions on the data center floor
• Go from being reactive to proactive
         • Operations are first ones to know there is a hot spot and have
           a solution in place before there is an issue
4/2012
California Energy
Commission Webinar


Manuel Lujano
California Franchise Tax Board

April 4, 2012
Agenda

•        Building 1 Data Center
•        Goals for the Project
•        Challenges
•        Implementation
•        Results
•        Next Steps


4/2012
Building 1 Data Center
• 20,000 sf located in
  Sacramento
• 13 CRAC units
• Humidity control
  requirements for printing
  operation                             Source: Google Maps


• Tape storage units
  (confined to one area)
• Odd-sized room cooling requirements
4/2012
Building 1 Data Center
• Hot spots and cold spots
     • Operations measured
       temperatures by walking around
• All CRAC units running 100%
     • Crosstalk – these units were
       blowing too much air, creating   Source: CA Franchise Tax Board

       too much air mixing in the
       data center
• Inefficient
     • Some CRACs heating
     • Some CRACs cooling
  4/2012
Project Goals

• Energy savings
• Better temperature
  control
• Eliminate CRAC cross
  talk or fighting
• Better floor temperature   Source: CA Franchise Tax Board


  visibility for more
  informed decision-making

 4/2012
Data Center in State of Flux
• The B1 Data Center was both growing
  and shrinking
         • Need to add capacity in the same room to get
           ready for more agencies
         • Need to add and remove IT equipment
           without temperature change
• Keep IT guys happy
         • Identify, correct and prevent hot spots
• Efficiently cool the odd-shaped room
4/2012
Implementation
• Quick
     •    Vigilent System up and running in 5 days
     •    140 wireless sensors
     •    2 wireless gateways
     •    13 CRAC units
• Installed ABB VFDs in five days
• Previous experience with Vigilent
  deployment in Building 3 data center in 2009
     • High confidence that the system would work well
 4/2012
Implementation

                                                 • Wireless sensors at
                                                   top and bottom of IT
                                                   server inlet air
                                                 • System gives
                                                   operations actionable
                                                   information
                                                 • Measuring power on
                                                   each CRAC for
                             Results are visible   cooling energy usage
Source: CA Franchise Tax Board
                               within days of      reports
  4/2012
                                 installation
Floor Temperatures Visible
• Hot spots/cold spots
  immediately visible
   • Once corrected, can
     show IT guys proof with
     the thermal map
• Feel the difference
   • Shift in how data
     center feels
   • Cold spots identified before
                                          Source: Vigilent
     installation disappeared afterward
 4/2012
Results

• 78% energy savings
           • Annual kWh savings of
             697,042 or $69,705
           • Exceeded expectations
• Reduced VFD speeds in 13
  CRACs from 100% to 50%                                          Source: CA Franchise Tax Board


• Eliminated CRAC fighting
• Reduced noise
85,108 kWh/month usage before project reduced to 19,014 kWh/month after project
Made changes to data center so now usage is 25,882 kWh/month

  4/2012
Results
• Odd-shaped room now
  cooled efficiently
         • Lowered setpoints on Vigilent
           system which directed more
           cooling to the room
• Temperatures in data center
  went down AFTER energy
                                                Source: Vigilent
  usage was reduced
         • Less air movement and
           air mixing
     • Humidity remained constant and managed
4/2012
Results

• Major energy savings and carbon reduction
• Eliminated hot spots and cold spots
• Less wear and tear on CRACs
• Improved risk management due to system ability
  to auto-adjust to equipment adds or removals
• Quick payback and ROI
• Works with varying data center floor plan and
  equipment type and age


4/2012
Next Steps

• Upgrade 2009 Building 3 data center (13,000 sf)
  to add VFDs to all 12 CRACs
         • Upgrade Vigilent system from start/stop CRACs to full
           control VFDs
• Add more hot aisle containment curtains
• Add a water side economizer
• Improve lighting efficiency


4/2012
Vigilent                         ®


Intelligent Energy Management Systems


Solutions for Data Centers, Telcos,
and Commercial Buildings
Dan Mascola
Blog: www.dchuddle.com

California Energy Commission Webinar
April 4, 2012
California State Data Centers
                                             Square               kWh       Dollar Cooling
Site Name                                     Feet Sensors CRAHs Savings   Savings Reduced

Office of Technology Services, Gold Camp 40,000       495   23   484,174   $48,417         19%

Employment Development Department            12,500   63     5   433,049   $43,305         54%

Franchise Tax Board LA Data Center           12,000   126   15   697,045   $69,705         78%

Department of Water Resources                5,300    53     6   288,348   $28,835         40%

Department of Trans. (Caltrans), 2nd Floor   4,000    44     4   149,555   $17,947         64%

Secretary of State                           2,700    32     5    37,084    $3,708         30%

Department of General Services, Ziggurat     2,500    41     4    84,134   $11,358         50%

Department of Trans. (Caltrans), 9th Floor    667     31     3   140,135   $16,816         64%

Totals                                       79,667   885   65   2,313,524 $240,091        41%
                                                                                      Source: Vigilent


 4/4/12
Results

      • Reduced energy consumption of eight data
        centers by more than 2.3 million kWh
      • Projecting over $240,000 in annual savings
      • Results achieved at diverse set of
        data centers
             • Demonstrates the power and flexibility of
               intelligent energy management
      • Works in big or small, old or new data centers

        4/4/12
Proprietary and confidential
Vigilent Today

Vigilent provides intelligent energy
management systems for data centers,
telcos, central offices, and buildings
         •   Intelligent control – dynamic, predictive, adaptive
         •   Rapid deployment with minimal disruption
         •   Instant savings on energy costs
         •   Informed by Big Data, directed by Big Analytics


4/4/12
Big Pressures…


                 Source: Vigilent


4/4/12
Big Challenges and Costly

• Cooling accounts for 50% of data center
  energy costs
• Downtime costs $5,600 per minute
• Human error is one of the largest causes
  of downtime
         • Nearly $300,000 downtime costs per incident
• Siloed information across multiple sites

"National Survey on Data Center Outages," conducted by the Ponemon Institute, published September 30, 2010.

4/4/12
And More...

• 42% of data centers will run out of cooling,
  power, or space in the next two years
• Technical Challenges
         •   Chasing hot spots
         •   Increasing rack energy density
         •   IT loads becoming more dynamic
         •   A lot to manage, little visibility


4/4/12
The Vigilent Solution

•    Cooling becomes a managed resource
•    Improved reliability
•    Improved capacity management
•    Improved resiliency
•    Lowered life-cycle costs
•    PAID FOR WITH ENERGY SAVINGS

    Typical savings of 40% savings in cooling costs or better

4/4/12
Vigilent Data Center™


                        Source: Vigilent

4/4/12
Vigilent Delivers
                            60
                                                            energy management
                                     BEFORE                 software started
                            50
         Main breaker, kW


                            40

                            30

                            20

                            10
                                                               AFTER
                             0
                              1/31     2/2    2/4     2/6         2/8        2/10
                                               date/time
                                                                        Source: Vigilent


4/4/12
The Data Center Solution
• Powerful Artificial Intelligence based
  technology
• Measures, monitors and actively controls
  cooling operations
• Dynamically adjust cooling units in real time
• Optimize temperature distribution
• Provides insight into environment and
  operations through lots of data

 4/4/12
Cooling Strategies
                                    floor tile                   control        hot aisle        rack
                                                     VFDs
                                    changes                     software        isolation       blanks
                           60

                           50
         main breaker kW


                           40
                                                                           SAVINGS FROM
                                                                           ENERGY MANAGEMENT
                           30

                           20

                           10

                            0
                                A                B          C               D               E               F
                                                            Time Interval
                                                                                                         Source: Vigilent

4/4/12
Technology Overview
Intelligent Energy Management

• Input-output data model
         • Interactions drive AI decision-making and analytics
• Adaptive and dynamic
         • Self-configuring
         • Self-maintaining
• Self-optimizing
         • Optimize temperature distribution
         • Minimize energy consumption


4/4/12
Long Tail


                              Source: Vigilent


            Large amount of data able to
              predict very rare events

4/4/12
Thermal Mapping

• Pinpoint hot spots,
  identify areas of
  excess cooling
• Colorized, overhead
  views make it easy to
  assess performance
  at a glance                                 Source: Vigilent


• View sensor readings over time as a movie


4/4/12
Summary

• Vigilent delivers…
    •    Improved IT reliability
    •    Improved resilience, redundancy
    •    Improved capacity management
    •    Extended equipment life
    •    Reduced maintenance costs
    •    Paid for with reduced energy costs

     Vigilent solutions are farthest up the experience curve

4/4/12
Vigilent™
Intelligent Energy Management Systems

www.vigilent.com
dmascola@vigilent.com

Vig•i•lent /ˈvijələnt/
    Adjective: Intelligently keeping careful watch for possible
    danger or difficulties
Questions?

Mais conteúdo relacionado

Mais procurados

Flow Data Acquisition Presentation
Flow Data Acquisition PresentationFlow Data Acquisition Presentation
Flow Data Acquisition Presentation
Nicholas Chapman
 
2 b brychan watkins
2 b brychan watkins2 b brychan watkins
2 b brychan watkins
CFG
 
Event Driven Architectures
Event Driven ArchitecturesEvent Driven Architectures
Event Driven Architectures
Avinash Ramineni
 

Mais procurados (10)

Introducing Ironstream Support for ServiceNow Event Management
Introducing Ironstream Support for ServiceNow Event Management Introducing Ironstream Support for ServiceNow Event Management
Introducing Ironstream Support for ServiceNow Event Management
 
Slides: The Top 3 North America Data Center Trends for Cooling
Slides: The Top 3 North America Data Center Trends for CoolingSlides: The Top 3 North America Data Center Trends for Cooling
Slides: The Top 3 North America Data Center Trends for Cooling
 
Ashrae presentation Managing BMS systems
Ashrae presentation Managing BMS systemsAshrae presentation Managing BMS systems
Ashrae presentation Managing BMS systems
 
Ashrae standards development
Ashrae standards development Ashrae standards development
Ashrae standards development
 
Flow Data Acquisition Presentation
Flow Data Acquisition PresentationFlow Data Acquisition Presentation
Flow Data Acquisition Presentation
 
2 b brychan watkins
2 b brychan watkins2 b brychan watkins
2 b brychan watkins
 
Audit ranking & Rental Quality Scorecard Lyons Information Systems
Audit ranking & Rental Quality Scorecard Lyons Information SystemsAudit ranking & Rental Quality Scorecard Lyons Information Systems
Audit ranking & Rental Quality Scorecard Lyons Information Systems
 
Daimler Trucks of North America
Daimler Trucks of North AmericaDaimler Trucks of North America
Daimler Trucks of North America
 
Event Driven Architectures
Event Driven ArchitecturesEvent Driven Architectures
Event Driven Architectures
 
Zero downtime upgrate for dcs migration Thermo Systems
Zero downtime upgrate for dcs migration Thermo SystemsZero downtime upgrate for dcs migration Thermo Systems
Zero downtime upgrate for dcs migration Thermo Systems
 

Semelhante a How 8 California Data Centers Reduced Cooling Energy by 40%

Implementing the Poughkeepsie Green Data Center
Implementing the Poughkeepsie Green Data CenterImplementing the Poughkeepsie Green Data Center
Implementing the Poughkeepsie Green Data Center
Elisabeth Stahl
 

Semelhante a How 8 California Data Centers Reduced Cooling Energy by 40% (20)

How EnerKey Using InfluxDB Saves Customers Millions by Detecting Energy Usage...
How EnerKey Using InfluxDB Saves Customers Millions by Detecting Energy Usage...How EnerKey Using InfluxDB Saves Customers Millions by Detecting Energy Usage...
How EnerKey Using InfluxDB Saves Customers Millions by Detecting Energy Usage...
 
How green standards are changing data center design and operations
How green standards are changing data center design and operationsHow green standards are changing data center design and operations
How green standards are changing data center design and operations
 
How green standards are changing data center design and operations
How green standards are changing data center design and operationsHow green standards are changing data center design and operations
How green standards are changing data center design and operations
 
Air Flow Presentation Pdf
Air Flow  Presentation PdfAir Flow  Presentation Pdf
Air Flow Presentation Pdf
 
Green IT Concept
Green IT ConceptGreen IT Concept
Green IT Concept
 
High Efficiency technologies for Data Centre Air Conditioning
High Efficiency technologies for  Data Centre Air ConditioningHigh Efficiency technologies for  Data Centre Air Conditioning
High Efficiency technologies for Data Centre Air Conditioning
 
Server room presentation 16th january 2014
Server room presentation 16th january 2014Server room presentation 16th january 2014
Server room presentation 16th january 2014
 
Energy Efficient Server Rooms at the University of Cambridge
Energy Efficient Server Rooms at the University of CambridgeEnergy Efficient Server Rooms at the University of Cambridge
Energy Efficient Server Rooms at the University of Cambridge
 
Air Flow Presentation 0218
Air Flow  Presentation 0218Air Flow  Presentation 0218
Air Flow Presentation 0218
 
SD WAN Cost Savings Strategies
SD WAN Cost Savings StrategiesSD WAN Cost Savings Strategies
SD WAN Cost Savings Strategies
 
Unintended consequences
Unintended consequencesUnintended consequences
Unintended consequences
 
Managing the Impact and Cost of the IOT Data Explosion - Data Centre Converge...
Managing the Impact and Cost of the IOT Data Explosion - Data Centre Converge...Managing the Impact and Cost of the IOT Data Explosion - Data Centre Converge...
Managing the Impact and Cost of the IOT Data Explosion - Data Centre Converge...
 
Managing the Impact and Cost of the IOT Data Explosion - Data Centre Converge...
Managing the Impact and Cost of the IOT Data Explosion - Data Centre Converge...Managing the Impact and Cost of the IOT Data Explosion - Data Centre Converge...
Managing the Impact and Cost of the IOT Data Explosion - Data Centre Converge...
 
Proposal for PSEB
Proposal for PSEBProposal for PSEB
Proposal for PSEB
 
Aged Data Center Infrastructure.pptx
Aged Data Center Infrastructure.pptxAged Data Center Infrastructure.pptx
Aged Data Center Infrastructure.pptx
 
The Connected Building Transformation
The Connected Building TransformationThe Connected Building Transformation
The Connected Building Transformation
 
Implementing the Poughkeepsie Green Data Center
Implementing the Poughkeepsie Green Data CenterImplementing the Poughkeepsie Green Data Center
Implementing the Poughkeepsie Green Data Center
 
Key areas to consider when evaluating a Data Centre
Key areas to consider when evaluating a Data CentreKey areas to consider when evaluating a Data Centre
Key areas to consider when evaluating a Data Centre
 
Data center energy practitioner (dcep) certification training 2020
Data center energy practitioner (dcep) certification training 2020Data center energy practitioner (dcep) certification training 2020
Data center energy practitioner (dcep) certification training 2020
 
Pp webinar
Pp webinarPp webinar
Pp webinar
 

Mais de E Source Companies, LLC

Mais de E Source Companies, LLC (20)

3 Best Practices in Utility Bill Redesign
3 Best Practices in Utility Bill Redesign3 Best Practices in Utility Bill Redesign
3 Best Practices in Utility Bill Redesign
 
Reduce Costs and Efficiently Handle High-Volume Customer Transactions with Jo...
Reduce Costs and Efficiently Handle High-Volume Customer Transactions with Jo...Reduce Costs and Efficiently Handle High-Volume Customer Transactions with Jo...
Reduce Costs and Efficiently Handle High-Volume Customer Transactions with Jo...
 
How Can Utilities Better Serve Up Energy-Efficiency Programs to Small Restaur...
How Can Utilities Better Serve Up Energy-Efficiency Programs to Small Restaur...How Can Utilities Better Serve Up Energy-Efficiency Programs to Small Restaur...
How Can Utilities Better Serve Up Energy-Efficiency Programs to Small Restaur...
 
Did You Meet Your DSM Goals in 2015?
Did You Meet Your DSM Goals in 2015?Did You Meet Your DSM Goals in 2015?
Did You Meet Your DSM Goals in 2015?
 
Increase Customer Participation in Value-Added Programs with Journey Mapping
Increase Customer Participation in Value-Added Programs with Journey MappingIncrease Customer Participation in Value-Added Programs with Journey Mapping
Increase Customer Participation in Value-Added Programs with Journey Mapping
 
The Critical Relationship Between DSM Programs and Customer Experience
The Critical Relationship Between DSM Programs and Customer ExperienceThe Critical Relationship Between DSM Programs and Customer Experience
The Critical Relationship Between DSM Programs and Customer Experience
 
Ten DSM Topics That Made Waves in 2016
Ten DSM Topics That Made Waves in 2016Ten DSM Topics That Made Waves in 2016
Ten DSM Topics That Made Waves in 2016
 
Using Segmentation to Personalize Low-Income Program Outreach and Increase Pa...
Using Segmentation to Personalize Low-Income Program Outreach and Increase Pa...Using Segmentation to Personalize Low-Income Program Outreach and Increase Pa...
Using Segmentation to Personalize Low-Income Program Outreach and Increase Pa...
 
Growing Pains: How Utilities Are Meeting Increasing Efficiency Goals
Growing Pains: How Utilities Are Meeting Increasing Efficiency GoalsGrowing Pains: How Utilities Are Meeting Increasing Efficiency Goals
Growing Pains: How Utilities Are Meeting Increasing Efficiency Goals
 
E Source Forum: A Compilation of Insights from 2016
E Source Forum: A Compilation of Insights from 2016E Source Forum: A Compilation of Insights from 2016
E Source Forum: A Compilation of Insights from 2016
 
E Source Forum: A Compilation of Insights from 2015
E Source Forum: A Compilation of Insights from 2015E Source Forum: A Compilation of Insights from 2015
E Source Forum: A Compilation of Insights from 2015
 
An Integrated Individual-Organization Approach to Change Management
An Integrated Individual-Organization Approach to Change ManagementAn Integrated Individual-Organization Approach to Change Management
An Integrated Individual-Organization Approach to Change Management
 
Integrating Change Management and Project Management
Integrating Change Management and Project ManagementIntegrating Change Management and Project Management
Integrating Change Management and Project Management
 
How Utilities Can Reduce Costs and Efficiently Handle High-Volume Customer Tr...
How Utilities Can Reduce Costs and Efficiently Handle High-Volume Customer Tr...How Utilities Can Reduce Costs and Efficiently Handle High-Volume Customer Tr...
How Utilities Can Reduce Costs and Efficiently Handle High-Volume Customer Tr...
 
Reaching Small Business Customers: Successful Strategies and the Ones That Go...
Reaching Small Business Customers: Successful Strategies and the Ones That Go...Reaching Small Business Customers: Successful Strategies and the Ones That Go...
Reaching Small Business Customers: Successful Strategies and the Ones That Go...
 
Engaging SMB Customers
Engaging SMB CustomersEngaging SMB Customers
Engaging SMB Customers
 
Engaging SMB Customers: Some Really Cool Ideas (Barrett)
Engaging SMB Customers: Some Really Cool Ideas (Barrett)Engaging SMB Customers: Some Really Cool Ideas (Barrett)
Engaging SMB Customers: Some Really Cool Ideas (Barrett)
 
Residential Energy Segmentation
Residential Energy SegmentationResidential Energy Segmentation
Residential Energy Segmentation
 
Achieve Your Potential: Segmentation for Business Customer Experience and Ene...
Achieve Your Potential: Segmentation for Business Customer Experience and Ene...Achieve Your Potential: Segmentation for Business Customer Experience and Ene...
Achieve Your Potential: Segmentation for Business Customer Experience and Ene...
 
Channel Surfing: Optimize Your Omnichannel Experience
Channel Surfing: Optimize Your Omnichannel ExperienceChannel Surfing: Optimize Your Omnichannel Experience
Channel Surfing: Optimize Your Omnichannel Experience
 

Último

BASLIQ CURRENT LOOKBOOK LOOKBOOK(1) (1).pdf
BASLIQ CURRENT LOOKBOOK  LOOKBOOK(1) (1).pdfBASLIQ CURRENT LOOKBOOK  LOOKBOOK(1) (1).pdf
BASLIQ CURRENT LOOKBOOK LOOKBOOK(1) (1).pdf
SoniaTolstoy
 

Último (20)

Sanyam Choudhary Chemistry practical.pdf
Sanyam Choudhary Chemistry practical.pdfSanyam Choudhary Chemistry practical.pdf
Sanyam Choudhary Chemistry practical.pdf
 
Student login on Anyboli platform.helpin
Student login on Anyboli platform.helpinStudent login on Anyboli platform.helpin
Student login on Anyboli platform.helpin
 
Software Engineering Methodologies (overview)
Software Engineering Methodologies (overview)Software Engineering Methodologies (overview)
Software Engineering Methodologies (overview)
 
Web & Social Media Analytics Previous Year Question Paper.pdf
Web & Social Media Analytics Previous Year Question Paper.pdfWeb & Social Media Analytics Previous Year Question Paper.pdf
Web & Social Media Analytics Previous Year Question Paper.pdf
 
Introduction to Nonprofit Accounting: The Basics
Introduction to Nonprofit Accounting: The BasicsIntroduction to Nonprofit Accounting: The Basics
Introduction to Nonprofit Accounting: The Basics
 
Advanced Views - Calendar View in Odoo 17
Advanced Views - Calendar View in Odoo 17Advanced Views - Calendar View in Odoo 17
Advanced Views - Calendar View in Odoo 17
 
Sports & Fitness Value Added Course FY..
Sports & Fitness Value Added Course FY..Sports & Fitness Value Added Course FY..
Sports & Fitness Value Added Course FY..
 
Código Creativo y Arte de Software | Unidad 1
Código Creativo y Arte de Software | Unidad 1Código Creativo y Arte de Software | Unidad 1
Código Creativo y Arte de Software | Unidad 1
 
Class 11th Physics NEET formula sheet pdf
Class 11th Physics NEET formula sheet pdfClass 11th Physics NEET formula sheet pdf
Class 11th Physics NEET formula sheet pdf
 
Q4-W6-Restating Informational Text Grade 3
Q4-W6-Restating Informational Text Grade 3Q4-W6-Restating Informational Text Grade 3
Q4-W6-Restating Informational Text Grade 3
 
BAG TECHNIQUE Bag technique-a tool making use of public health bag through wh...
BAG TECHNIQUE Bag technique-a tool making use of public health bag through wh...BAG TECHNIQUE Bag technique-a tool making use of public health bag through wh...
BAG TECHNIQUE Bag technique-a tool making use of public health bag through wh...
 
Mattingly "AI & Prompt Design: Structured Data, Assistants, & RAG"
Mattingly "AI & Prompt Design: Structured Data, Assistants, & RAG"Mattingly "AI & Prompt Design: Structured Data, Assistants, & RAG"
Mattingly "AI & Prompt Design: Structured Data, Assistants, & RAG"
 
Key note speaker Neum_Admir Softic_ENG.pdf
Key note speaker Neum_Admir Softic_ENG.pdfKey note speaker Neum_Admir Softic_ENG.pdf
Key note speaker Neum_Admir Softic_ENG.pdf
 
BASLIQ CURRENT LOOKBOOK LOOKBOOK(1) (1).pdf
BASLIQ CURRENT LOOKBOOK  LOOKBOOK(1) (1).pdfBASLIQ CURRENT LOOKBOOK  LOOKBOOK(1) (1).pdf
BASLIQ CURRENT LOOKBOOK LOOKBOOK(1) (1).pdf
 
APM Welcome, APM North West Network Conference, Synergies Across Sectors
APM Welcome, APM North West Network Conference, Synergies Across SectorsAPM Welcome, APM North West Network Conference, Synergies Across Sectors
APM Welcome, APM North West Network Conference, Synergies Across Sectors
 
Explore beautiful and ugly buildings. Mathematics helps us create beautiful d...
Explore beautiful and ugly buildings. Mathematics helps us create beautiful d...Explore beautiful and ugly buildings. Mathematics helps us create beautiful d...
Explore beautiful and ugly buildings. Mathematics helps us create beautiful d...
 
IGNOU MSCCFT and PGDCFT Exam Question Pattern: MCFT003 Counselling and Family...
IGNOU MSCCFT and PGDCFT Exam Question Pattern: MCFT003 Counselling and Family...IGNOU MSCCFT and PGDCFT Exam Question Pattern: MCFT003 Counselling and Family...
IGNOU MSCCFT and PGDCFT Exam Question Pattern: MCFT003 Counselling and Family...
 
fourth grading exam for kindergarten in writing
fourth grading exam for kindergarten in writingfourth grading exam for kindergarten in writing
fourth grading exam for kindergarten in writing
 
Holdier Curriculum Vitae (April 2024).pdf
Holdier Curriculum Vitae (April 2024).pdfHoldier Curriculum Vitae (April 2024).pdf
Holdier Curriculum Vitae (April 2024).pdf
 
social pharmacy d-pharm 1st year by Pragati K. Mahajan
social pharmacy d-pharm 1st year by Pragati K. Mahajansocial pharmacy d-pharm 1st year by Pragati K. Mahajan
social pharmacy d-pharm 1st year by Pragati K. Mahajan
 

How 8 California Data Centers Reduced Cooling Energy by 40%

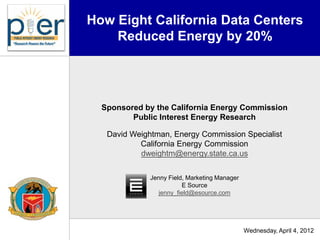
  • 1. How Eight California Data Centers Reduced Energy by 20% Sponsored by the California Energy Commission Public Interest Energy Research David Weightman, Energy Commission Specialist California Energy Commission dweightm@energy.state.ca.us Jenny Field, Marketing Manager E Source jenny_field@esource.com Wednesday, April 4, 2012
  • 2. California Energy Commission Public Interest Energy Research • Solicitations • Demonstrations • Research Centers • Partnerships • Codes and Standards
  • 3. California Energy Commission Public Interest Energy Research • Global Warming Solutions Act (AB32) • Loading Order (EAP) • Zero-Net Energy (LTEESP) • Clean Energy Jobs Plan (Executive Initiative)
  • 4. California Energy Commission Public Interest Energy Research • Achieve Clean and Sustainable Energy Future • Reduce Pollution • Increase Resource Efficiency • Create Jobs
  • 5. California Energy Commission Public Interest Energy Research Today’s Webinar: Background
  • 6. California Energy Commission Public Interest Energy Research Today’s Speakers: Carl Boomgaarden Information Systems Analyst State of California Manuel Lujano Staff Information Analyst California Franchise Tax Board Dan Mascola Senior Energy Efficiency Analyst Vigilent
  • 7. California Energy Commission Webinar Carl Boomgaarden Office of Technology Services April 4, 2012
  • 8. Agenda • Gold Camp Data Center • Goals for the Project • Challenges • Implementation • Results
  • 9. Gold Camp Data Center 44,000 sf located near Sacramento, CA • Serves more than 500 State, County, Federal and Local Government entities Source: Google Maps • 23 CRAC units expanding to 48 • 1,010 racks 4/2012
  • 10. Gold Camp Data Center Updating & Modernizing • Upgrading and adding power distribution units • Updating and adding static transfer switches • Migrating customers’ power Source: Google Maps off old to new • Realigning cabinets into hot aisle/cold aisle 4/2012
  • 11. Project Goals • Continuous visibility for informed decisions • Improved planning options, capacity & growth • Energy savings • Cut cooling costs up to 40% • Less CRAC wear and tear • Modernize data center Source: Gold Camp • Improve resiliency & redundancy • Reduce downtime risk 4/2012
  • 12. Challenges • Data center in state of flux • IT equipment growing rapidly • Power usage on constant incline • 2 MW going up to 3 MW • Initially somewhat skeptical • How will the technology work in this data center? • What improvements will be delivered? • 23 old 30-ton CRAC units 4/2012
  • 13. Implementation • Quick • System up and running in 5 days • 275 wireless sensors • 6 wireless gateways • 23 CRAC units • Added network wiring & VLAN IP addressing • Ethernet and power to wireless gateways • IP address for wireless gateways and server 4/2012
  • 14. Implementation • Wireless sensors at top and bottom of IT server inlet air • System gives operations information they can use • Hot spots/cold spots • Adjust floor tiles Results are visible • Eliminate air gaps Source: Vigilent within days of 4/2012 installation
  • 15. Floor Temperature Visibility • Easily identify hot/cold spots • Visual picture shows where to go look • Red triangle means go look at what’s causing Source: Vigilent temperature rise • Could be a box on the floor blocking airflow 4/2012
  • 16. Cooling and Airflow Visibility • More even temperatures • Month 1: Turned 8 of 23 CRACs off • Month 2: Turned 10–11 CRACs off • Feb 2012: added 13 new CRAC units to the system • After floor balancing, 18 Source: Vigilent of 36 CRACs are off 4/2012
  • 17. Power Usage • Prior to project, steady rate of power increase in the data center • After project, total power usage plateaued for a short time even as the data center continued to grow Source: Liebert PDU • Power usage continues to increase, but at a slower rate 4/2012
  • 18. Cooling at Room Level • System adjusts as new conditions arise throughout the room for improved end- to-end reliability • Capacity rating screen tells us CRAC unit on but running at low efficiency level, which could indicate pushing return air into the floor Source: Gold Camp • Leads operations to adjust local CRAC setpoints to increase cooling capability 4/2012
  • 19. CRAC Influence… At a Glance • System shows the effect of every CRAC across the floor • Comprehensive, accurate, real-time airflow visual • Operations looks at Vigilent constantly wCRAC A • Saves money • Saves time Source: Vigilent 4/2012
  • 20. Results • Works as advertised • Valuable tool helps operations do their job better • Be more energy efficient • Support state data center consolidation • Use Vigilent as a map to ensure new equipment can be added • Can show management how we’re improving power consumption efficiency • Extend cooling unit life due to decreased run time • Lower risk due to cooling control across the entire floor 4/2012
  • 21. Results • Automatic monitoring of cooling control • Removed “human” factor • No more walking around checking/adjusting temperatures • Automated ability of system to respond to changes works like a charm • Moved cooling units, moved power units, add/move cabinets • Streamlined the process • See at a glance the conditions on the data center floor • Go from being reactive to proactive • Operations are first ones to know there is a hot spot and have a solution in place before there is an issue 4/2012
  • 22. California Energy Commission Webinar Manuel Lujano California Franchise Tax Board April 4, 2012
  • 23. Agenda • Building 1 Data Center • Goals for the Project • Challenges • Implementation • Results • Next Steps 4/2012
  • 24. Building 1 Data Center • 20,000 sf located in Sacramento • 13 CRAC units • Humidity control requirements for printing operation Source: Google Maps • Tape storage units (confined to one area) • Odd-sized room cooling requirements 4/2012
  • 25. Building 1 Data Center • Hot spots and cold spots • Operations measured temperatures by walking around • All CRAC units running 100% • Crosstalk – these units were blowing too much air, creating Source: CA Franchise Tax Board too much air mixing in the data center • Inefficient • Some CRACs heating • Some CRACs cooling 4/2012
  • 26. Project Goals • Energy savings • Better temperature control • Eliminate CRAC cross talk or fighting • Better floor temperature Source: CA Franchise Tax Board visibility for more informed decision-making 4/2012
  • 27. Data Center in State of Flux • The B1 Data Center was both growing and shrinking • Need to add capacity in the same room to get ready for more agencies • Need to add and remove IT equipment without temperature change • Keep IT guys happy • Identify, correct and prevent hot spots • Efficiently cool the odd-shaped room 4/2012
  • 28. Implementation • Quick • Vigilent System up and running in 5 days • 140 wireless sensors • 2 wireless gateways • 13 CRAC units • Installed ABB VFDs in five days • Previous experience with Vigilent deployment in Building 3 data center in 2009 • High confidence that the system would work well 4/2012
  • 29. Implementation • Wireless sensors at top and bottom of IT server inlet air • System gives operations actionable information • Measuring power on each CRAC for Results are visible cooling energy usage Source: CA Franchise Tax Board within days of reports 4/2012 installation
  • 30. Floor Temperatures Visible • Hot spots/cold spots immediately visible • Once corrected, can show IT guys proof with the thermal map • Feel the difference • Shift in how data center feels • Cold spots identified before Source: Vigilent installation disappeared afterward 4/2012
  • 31. Results • 78% energy savings • Annual kWh savings of 697,042 or $69,705 • Exceeded expectations • Reduced VFD speeds in 13 CRACs from 100% to 50% Source: CA Franchise Tax Board • Eliminated CRAC fighting • Reduced noise 85,108 kWh/month usage before project reduced to 19,014 kWh/month after project Made changes to data center so now usage is 25,882 kWh/month 4/2012
  • 32. Results • Odd-shaped room now cooled efficiently • Lowered setpoints on Vigilent system which directed more cooling to the room • Temperatures in data center went down AFTER energy Source: Vigilent usage was reduced • Less air movement and air mixing • Humidity remained constant and managed 4/2012
  • 33. Results • Major energy savings and carbon reduction • Eliminated hot spots and cold spots • Less wear and tear on CRACs • Improved risk management due to system ability to auto-adjust to equipment adds or removals • Quick payback and ROI • Works with varying data center floor plan and equipment type and age 4/2012
  • 34. Next Steps • Upgrade 2009 Building 3 data center (13,000 sf) to add VFDs to all 12 CRACs • Upgrade Vigilent system from start/stop CRACs to full control VFDs • Add more hot aisle containment curtains • Add a water side economizer • Improve lighting efficiency 4/2012
  • 35. Vigilent ® Intelligent Energy Management Systems Solutions for Data Centers, Telcos, and Commercial Buildings Dan Mascola Blog: www.dchuddle.com California Energy Commission Webinar April 4, 2012
  • 36. California State Data Centers Square kWh Dollar Cooling Site Name Feet Sensors CRAHs Savings Savings Reduced Office of Technology Services, Gold Camp 40,000 495 23 484,174 $48,417 19% Employment Development Department 12,500 63 5 433,049 $43,305 54% Franchise Tax Board LA Data Center 12,000 126 15 697,045 $69,705 78% Department of Water Resources 5,300 53 6 288,348 $28,835 40% Department of Trans. (Caltrans), 2nd Floor 4,000 44 4 149,555 $17,947 64% Secretary of State 2,700 32 5 37,084 $3,708 30% Department of General Services, Ziggurat 2,500 41 4 84,134 $11,358 50% Department of Trans. (Caltrans), 9th Floor 667 31 3 140,135 $16,816 64% Totals 79,667 885 65 2,313,524 $240,091 41% Source: Vigilent 4/4/12
  • 37. Results • Reduced energy consumption of eight data centers by more than 2.3 million kWh • Projecting over $240,000 in annual savings • Results achieved at diverse set of data centers • Demonstrates the power and flexibility of intelligent energy management • Works in big or small, old or new data centers 4/4/12 Proprietary and confidential
  • 38. Vigilent Today Vigilent provides intelligent energy management systems for data centers, telcos, central offices, and buildings • Intelligent control – dynamic, predictive, adaptive • Rapid deployment with minimal disruption • Instant savings on energy costs • Informed by Big Data, directed by Big Analytics 4/4/12
  • 39. Big Pressures… Source: Vigilent 4/4/12
  • 40. Big Challenges and Costly • Cooling accounts for 50% of data center energy costs • Downtime costs $5,600 per minute • Human error is one of the largest causes of downtime • Nearly $300,000 downtime costs per incident • Siloed information across multiple sites "National Survey on Data Center Outages," conducted by the Ponemon Institute, published September 30, 2010. 4/4/12
  • 41. And More... • 42% of data centers will run out of cooling, power, or space in the next two years • Technical Challenges • Chasing hot spots • Increasing rack energy density • IT loads becoming more dynamic • A lot to manage, little visibility 4/4/12
  • 42. The Vigilent Solution • Cooling becomes a managed resource • Improved reliability • Improved capacity management • Improved resiliency • Lowered life-cycle costs • PAID FOR WITH ENERGY SAVINGS Typical savings of 40% savings in cooling costs or better 4/4/12
  • 43. Vigilent Data Center™ Source: Vigilent 4/4/12
  • 44. Vigilent Delivers 60 energy management BEFORE software started 50 Main breaker, kW 40 30 20 10 AFTER 0 1/31 2/2 2/4 2/6 2/8 2/10 date/time Source: Vigilent 4/4/12
  • 45. The Data Center Solution • Powerful Artificial Intelligence based technology • Measures, monitors and actively controls cooling operations • Dynamically adjust cooling units in real time • Optimize temperature distribution • Provides insight into environment and operations through lots of data 4/4/12
  • 46. Cooling Strategies floor tile control hot aisle rack VFDs changes software isolation blanks 60 50 main breaker kW 40 SAVINGS FROM ENERGY MANAGEMENT 30 20 10 0 A B C D E F Time Interval Source: Vigilent 4/4/12
  • 48. Intelligent Energy Management • Input-output data model • Interactions drive AI decision-making and analytics • Adaptive and dynamic • Self-configuring • Self-maintaining • Self-optimizing • Optimize temperature distribution • Minimize energy consumption 4/4/12
  • 49. Long Tail Source: Vigilent Large amount of data able to predict very rare events 4/4/12
  • 50. Thermal Mapping • Pinpoint hot spots, identify areas of excess cooling • Colorized, overhead views make it easy to assess performance at a glance Source: Vigilent • View sensor readings over time as a movie 4/4/12
  • 51. Summary • Vigilent delivers… • Improved IT reliability • Improved resilience, redundancy • Improved capacity management • Extended equipment life • Reduced maintenance costs • Paid for with reduced energy costs Vigilent solutions are farthest up the experience curve 4/4/12
  • 52. Vigilent™ Intelligent Energy Management Systems www.vigilent.com dmascola@vigilent.com Vig•i•lent /ˈvijələnt/ Adjective: Intelligently keeping careful watch for possible danger or difficulties