Examining advance time of furrow irrigation at Koga Irrigation Scheme, Ethiopia mining Advance Time of Furrow Irrigation at Koga Irrigation Scheme,
•
2 gostaram•895 visualizações

Poster prepared by Gizaw Desta, Menelik Getaneh and Amare Tsigie at the Nile Basin Development Challenge (NBDC) Science Workshop, Addis Ababa, Ethiopia, 9–10 July 2013
Recomendados

Recomendados
Mais conteúdo relacionado
Mais procurados
Mais procurados (20)
Destaque
Destaque (20)
Semelhante a Examining advance time of furrow irrigation at Koga Irrigation Scheme, Ethiopia mining Advance Time of Furrow Irrigation at Koga Irrigation Scheme,
Semelhante a Examining advance time of furrow irrigation at Koga Irrigation Scheme, Ethiopia mining Advance Time of Furrow Irrigation at Koga Irrigation Scheme, (20)
Mais de International Water Management Institute (IWMI)
Mais de International Water Management Institute (IWMI) (20)
Último
Último (20)
Examining advance time of furrow irrigation at Koga Irrigation Scheme, Ethiopia mining Advance Time of Furrow Irrigation at Koga Irrigation Scheme,
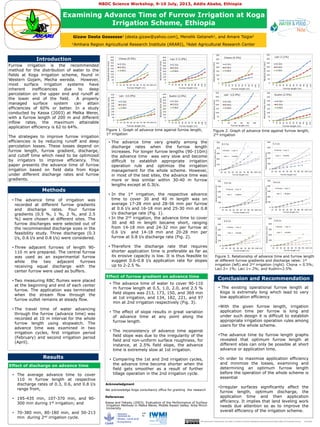
- 1. • The advance time of irrigation was recorded at different furrow gradients and discharge rates. Four furrow gradients (0.5 %, 1 %, 2 %, and 2.5 %) were chosen at different sites. The furrow discharges were selected out of the recommended discharge sizes in the feasibility study. Three discharges (0.3 l/s, 0.6 l/s and 0.8 l/s) were considered. • Three adjacent furrows of length 90- 110 m are prepared. The central furrow was used as an experimental furrow while the two adjacent furrows receiving equal discharge with the center furrow were used as buffers. • Two measuring RBC flumes were placed at the beginning and end of each center furrow. The application was terminated when the stream flow through the furrow outlet remains at steady flow. • The travel time of water advancing through the furrow (advance time) was recorded at 10 m interval for the whole furrow length using stopwatch. The advance time was examined in two irrigation cycles, first irrigation period (February) and second irrigation period (April). • The advance time vary greatly among the discharge rates when the furrow length increases. For longer furrow lengths (90-110m) the advance time was very slow and become difficult to establish appropriate irrigation operation rule and optimize the irrigation management for the whole scheme. However, in most of the test sites, the advance time was more or less similar within 30-40 m furrow lengths except at 0.3l/s. • In the 1st irrigation, the respective advance time to cover 30 and 40 m length was on average 17-28 min and 28-56 min per furrow at 0.6 l/s and 16-18 min and 25-30 min at 0.8 l/s discharge rate (Fig. 1). • In the 2nd irrigation, the advance time to cover 30 and 40 m length became short, ranging from 14-18 min and 24-32 min per furrow at 0.6 l/s and 14-18 min and 20-28 min per furrow at 0.8 l/s discharge rate (Fig. 2). • Therefore the discharge rate that requires shorter application time is preferable as far as its erosive capacity is low. It is thus feasible to suggest 0.6-0.8 l/s application rate for slopes up to 2-2.5 %. • The advance time of water to cover 90-110 m furrow length at 0.5, 1.0, 2.0, and 2.5 % field slopes was 213, 173, 150, and 369 min at 1st irrigation, and 134, 182, 221, and 97 min at 2nd irrigation respectively (Fig. 3). • The effect of slope results in great variation of advance time at any point along the furrow length. • The inconsistency of advance time against field slope was due to the irregularity of the field and non-uniform surface roughness, for instance, at 2.5% field slope, the advance time is extremely slow at 1st irrigation. • Comparing the 1st and 2nd irrigation cycles, the advance time become shorter when the field gets smoother as a result of further tillage operation in the 2nd irrigation cycle. • The existing operational furrow length at Koga is extremely long which lead to very low application efficiency •With the given furrow length, irrigation application time per furrow is long and under such design it is difficult to establish appropriate irrigation operation rules among users for the whole scheme. •The advance time by furrow length graphs revealed that optimum furrow length at different sites can only be possible at short advance or application time. •In order to maximize application efficiency and minimize the losses, examining and determining an optimum furrow length before the operation of the whole scheme is essential •Irregular surfaces significantly affect the furrow length, optimum discharge, the application time and then application efficiency. It implies that land leveling work needs due attention so as to improve the overall efficiency of the irrigation scheme. Gizaw Desta Gessesse1 (desta.gizaw@yahoo.com), Menelik Getaneh1, and Amare Tsigie2 1Amhara Region Agricultural Research Institute (ARARI), 2Adet Agricultural Research Center Introduction Results Furrow irrigation is the recommended method for the distribution of water to the fields at Koga irrigation scheme, found in Western Gojam, Mecha wereda. However, most surface irrigation systems have inherent inefficiencies due to deep percolation on the upper end and runoff at the lower end of the field. A properly managed surface system can attain efficiencies of 60% or better. In a study conducted by Kassa (2003) at Melka Werer, with a furrow length of 200 m and different inflow rates, the maximum attainable application efficiency is 62 to 64%. The strategies to improve furrow irrigation efficiencies is by reducing runoff and deep percolation losses. These losses depend on furrow length, furrow gradient, discharge, and cutoff time which need to be optimized by irrigators to improve efficiency. This paper presents the advance time of furrow irrigation based on field data from Koga under different discharge rates and furrow gradients. Methods Effect of furrow gradient on advance time NBDC Science Workshop, 9-10 July, 2013, Addis Ababa, Ethiopia Examining Advance Time of Furrow Irrigation at Koga Irrigation Scheme, Ethiopia Conclusion and Recommendation • The average advance time to cover 110 m furrow length at respective discharge rates of 0.3, 0.6, and 0.8 l/s range from, • 195-435 min, 107-370 min, and 90- 300 min during 1st irrigation; and • 70-380 min, 80-180 min, and 50-213 min during 2nd irrigation cycle. Effect of discharge on advance time Acknowledgment We acknowledge Koga consultancy office for granting the research 0 50 100 150 200 250 300 350 400 450 0 10 20 30 40 50 60 70 80 90 100110 Advancetime(min) Furrow length (m) Chona (0.5%) 0.3l/s 0.6l/s 0.8l/s 0 50 100 150 200 250 300 350 400 450 0 10 20 30 40 50 60 70 80 90 100 110 Advancetime(min) Furrow length (m) Laci 2 (1.0%) 0.3l/s 0.6l/s 0.8l/s 0 50 100 150 200 250 300 350 400 450 0 10 20 30 40 50 60 70 80 90 100110 Advancetime(min) Furrow length (m) Laci 1(2.0%) 0.3l/s 0.6l/s 0.8l/s 0 50 100 150 200 250 300 350 400 450 0 10 20 30 40 50 60 70 80 90 100 110 Advancetime(min) Furrow length (m) Kudmi (2.5%) 0.3l/s 0.6l/s 0.8l/s Figure 1. Graph of advance time against furrow length, 1st irrigation 0 50 100 150 200 250 300 350 0 10 20 30 40 50 60 70 80 90 100 110 Advancetime(min) Furrow length (m) Chona (0.5%) 0.3l/s 0.6l/s 0.8l/s 0 50 100 150 200 250 300 350 0 10 20 30 40 50 60 70 80 90 100 110 Advancetime(min) Furrow length (m) Laci 2 (1%) 0.3l/s 0.6l/s 0.8l/s 0 50 100 150 200 250 300 350 0 20 40 60 80 100 Advancetime(min) Furrow length (m) Laci 1(2.0%) 0.3l/s 0.6l/s 0.8l/s 0 50 100 150 200 250 300 350 0 10 20 30 40 50 60 70 80 90 100 110 Advancetime(min) Furrow length (m) Kudmi (2.5%) 0.3l/s 0.6l/s 0.8l/s Figure 2. Graph of advance time against furrow length, 2nd irrigation 0 100 200 300 400 500 10 20 30 40 50 60 70 80 90 100 110 Advancetime(min) Furrow length (m) 0.3 l/s Chona Laci 2 Laci 1 Kudmi 0 100 200 300 400 500 10 20 30 40 50 60 70 80 90 100 110 Advancetime(min) Furrow length (m) 0.3 l/s Chona Laci 2 Laci 1 Kudmi 0 100 200 300 400 500 10 20 30 40 50 60 70 80 90 100 110 Advancetime(min) Furrow length (m) 0.6 l/s Chona Laci 2 laci 1 Kudmi 0 100 200 300 400 500 10 20 30 40 50 60 70 80 90 100 110 Advancetime(min) Furrow length (m) 0.6 l/s Chona Laci 2 laci 1 Kudmi 0 100 200 300 400 500 10 20 30 40 50 60 70 80 90 100 110 Advancetime(min) Furrow length (m) 0.8 l/s Chona Laci 2 Laci 1 Kudmi 0 100 200 300 400 500 10 20 30 40 50 60 70 80 90 100 110 Advancetime(min) Furrow length (m) 0.8 l/s Chona Laci 2 Laci 1 Kudmi Figure 3. Relationship of advance time and furrow length at different furrow gradients and discharge rates: 1st irrigation (left) and 2nd irrigation (right). Chona = 0.5%; Laci 2= 1%; Laci 1= 2%; and Kudmi=2.5% References Kassa and Fekadu (2003). Evaluation of the Performance of Surface Irrigation Methods in Melka Werer, Middle Awash Valley. Arba Minch University This document is licensed for use under a Creative Commons Attribution-Noncommercial-Share Alike 3.0 Unported License July 2013