Farmers' risk perceptions of climate change
•
2 gostaram•1,126 visualizações

This document summarizes a research project on farmers' risk perceptions of climate change. The project aims to assess how UK farmers form perceptions of climate change risks and how those perceptions relate to risk mitigation actions. The researcher conducted a literature review finding little prior research on UK farmers. A conceptual framework was developed using a "cultural-behavioral" theory to understand decision-making. Methods included analyzing climate data and newspaper reports. Next steps are to analyze newspapers using qualitative data software and conduct preliminary interviews with farmers.

Recomendados
Recomendados
Mais conteúdo relacionado
Destaque
Destaque (20)
Semelhante a Farmers' risk perceptions of climate change
Semelhante a Farmers' risk perceptions of climate change (20)
Mais de Countryside and Community Research Institute
Mais de Countryside and Community Research Institute (20)
Último
Último (20)
Farmers' risk perceptions of climate change
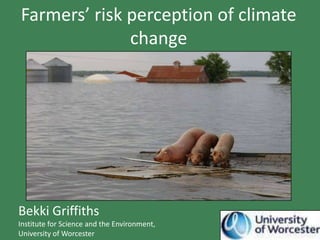
- 1. Farmers’ risk perception of climate change Bekki Griffiths Institute for Science and the Environment, University of Worcester
- 2. Farmer’s Risk Perception of climate change 1. Research project Background 2. Risk perception 3. Literature Review findings 4. ‘Cultural-behavourial’ theoretical framework 5. Methods 6. Metdata preliminary findings 7. Newspaper analysis 8. Conclusion (ITV News 2012)
- 3. By 2080… Research background +1.8 c - 8 c Summer +3-70% Winter and - 60% Temperature Summer Rainfall Soil erosion Wheat Yield +40-140% Water depletion from irrigation Sugar Beet +20-70% Flooding of farmland Grass +20-50% New Pests & Diseases? New Crops? Animal heat stress Yet little research so far has focused upon farmer’s in the UK …
- 4. Research Project • Aim: to assess how farmers perceptions of climate change are formed, and the relationship of this with risk mitigation actions. • Three counties: Worcestershire, Shropshire and Herefordshire • Completed literature review and conceptual framework
- 5. What is Risk Perception? Risk perception = the way in which an individual evaluates their level of risk in view of the information they have received, observed and recalled.
- 6. Literature review findings • Food security in the UK could be under threat. • UK & Europe left behind? Considerable research has focused upon the developing world, Canada & in the USA. • Climate change adaption is not a linear process from receiving of information to action. • Three key lessons from the developing world: local knowledge, Participatory Rural Appraisal & livelihoods framework.
- 7. ‘Cultural-behavioural’ theory • Devised a ‘cultural’ behavioural’ theory to allow for the consideration of farmers decision making as individual part of a wider cultural society. • This affects the way in which farmers behave in practices, information receiving and seeking and the actions taken as a result of this • Allows both quantitative and qualitative methodologies.
- 8. • Phase 1: Methods Rank of Shawbury Airfrost per month 1982 extreme 30 Average Monthly minimum temperatures: decadal comparison 1983 1984 event 14 Ross-on-wye Average maximum temperature: decadal R max temp (c) Year Date month 1985 comparison 1986 1987 R1 25 12 25 1990 3 8 1988 35 1989 1990 R2 2006 19 7 Average ofof Average D1 1991 35 2010 min 1992 20 1982-1991 1993 R3 1995 1 8 33.2 Sum of Air Frost days 1994 Average ofof Average D2 1995 Average of D1 (1986-1991) Temperature (°c) 8 1996 R4 1990 2 8 1992-2001 33.1 Temperature (°c) 15 15 min 1997 1998 Average of D2 (1992-2001) 1999 R5 6 2003 9 8 Average ofof 33.1 Average D3 2000 10 10 2002-2011 2001 Average of D3 (2002-2011) min 2002 R6 4 1995 2 8 2003 33 2004 2005 R7 5 5 1995 3 8 32.8 2006 2 2007 2008 R8 2006 18 7 32.5 2009 0 2010 0 R9 0 Jan JAN FEB Feb MAR Mar APR2003 Apr MAY JUN May JUL Jun AUG15 Jul SEP Aug OCT NOV Sep DEC Oct 7 Nov Dec 32.5 2011 JAN FEB MAR APR MAY JUN JUL AUG SEP OCT NOV DEC R10 1989 21 7 31.9
- 9. • Phase 2: Methods
- 11. Next Steps • To conduct newspaper analysis using Nvivo. Before Christmas. • Analyse relationship between recorded data & newspaper reports of this • Conduct preliminary scoping interviews
- 12. Thank you & any questions or ideas? Rebecca.griffiths@worc.ac.uk The Guardian (2007)
Notas do Editor
- So just to provide a little background to the climate change impacts that Defra (2009) predicted on agricultural production. So by 2080 Defra predict … [read out quite quickly the predicted impacts& yet despite these predicted impacts and the scale of these there has been very little research to date that has focused upon farmers in the UK.
- Started Sept 2011Early stages of data collection
- Risk perceptions are formed within the persons cultural and behavioural norms. For example the farmer on the left has a different set of values, beliefs, attitudes to risk and priorities than the farmer on the right. As a direct result of their different socio-economic backgrounds.Additionally, Bryant et al. (2000) found that the perception of stress by a farmer can be influenced by individual, characteristics of the farm and prior experiences of the farm family. It is these influences on a farmers risk perception which include; communications, values, attitudes, experiences, memories, observations, communities and social networks. Which I am focusing on to establish how a farmers risk perception of climate change is formed, and how this then results in action. I am doing this by establishing the difference in the relationships between the met data recorded and scientific observations, with that communicated through the media, with farmers observations and experiences.
- From looking at climate science and food security literature it is apparent that there is a sense of urgency across these reports. Adaption is a dynamic process that aims to reduce a systems vulnerability through increased resilience.In Canada Smitet al. (1996) found that most farmers reported being significantly affected by variable climatic conditions over a 6 year period however only 1 in 5 made any conscious effort to adjust to climatic events. Agricultural adaptations are determined by decisions and changing conditions at farm and local levels.Developing world literature is well established on this subject due its considerable focus at a local scale. Three key approach used to encourage climate adaptations in the developing world include:1. Local knowledge – allowing the farmers to draw upon their own past expeiriences, memories and observations. 2. Participatory Rural Apprasil – encourage groups of farmers to discuss actions, such as crop trials and irrigation strategies. 3. Livelihoods framework – considers a farmers physical, natural, social, economic and cultural capital. As key influences to farmers decision making.
- In line with the focus of the devloping world literature, I have decided to use a cultural-behavioural theory which looks at farmers decision-making as individuals, but as part of a wider community. cultural-behvioural theoretical framework is not just an amalgamation of theory but also a ammalgamtion of methods thus I am using a mixed methods approach.
- 1 - I have analysed met data from a site in each county: Shawbury, Ross-on-Wye and Pershore, over a 30 year period of 1982-2011, the standard time frame used to establish a ‘climate’. I have now established rough prelimnaryfindings:Subtle seasonal shiftsDecadal analysis reveals gradual increase in the average maximum and minimum temperatures recorded Possible shift in rainfall, less winter rainfall and more intense episodes of summer rainfall NO significant shift in extreme events, most extreme temps recorded in both earlier & latter half 30 year period (highest temp recorded in August 1990 of 35 degrees at Ross-on-wye. Frost free days per annum appear to be slightly increasing, but it is not a significant trend. 2- Will use dates of considerable readings to look at the local newspaper to see if recorded. This will establish the relationship between extreme readings/recordings and the impacts on the ground. It will also allow to establish the communication of weather events (whether sensationalised or not etc.), and indicate how this may impact upon farmers perceptions, and thus actions.
- I Will then be looking at worcester news, shropshire star and Hereford times. Along side three counties farmer, to asses how and when weather events are recorded.IT IS IMPORTNANT THAT THIS IS A VERY LOCALISED STUDY LOOKING AT LOCAL EVENTS AND CHANGES AND THE LOCAL COMMUNICATION OF THIS. Many studies have looked at national and international communication of long-term cc, but I want to be able to destinguish the relationships of specific weather events and farmers memories and perceptions of these. Thus fine grained local data and local newspapers have been used. I am particularly interested in the manner that these events are reported, and what are the specific impacts that certain conditions are perceived on having on the ground. This is to be analyses in relation to the met data findings. Targeting specific dates identified in SD test to show most extreme met values, investigating top 10 ‘most extreme’ conditions recordedI aim to start this next week.
- I will then use this baseline data as comparison material in interviews and focus groups with farmers across the region.I also intend on presenting farmer’s with different climate scenarios and see how they reactAs well as exploring their reactions and interpretations of different newspaper reports , to explore communication chains.
- ( Farming futures 2012)