GIS Workshop Selected Final Maps
•
1 gostou•986 visualizações

In this lower resolution PDF, you'll find selected maps that were produced by students in the 2010 GIS Workshop held in the Department of Geography at Ball State University.

Recomendados
Recomendados
Mais conteúdo relacionado
Semelhante a GIS Workshop Selected Final Maps
Semelhante a GIS Workshop Selected Final Maps (20)
Último
Último (20)
GIS Workshop Selected Final Maps
- 1. GIS Workshop Selected Final Map Products Spring 2010 Instructor: Matthew W. Wilson Assistant Professor of Geography Ball State University Course Description: Geographic information technologies continue to drive the representation and management of complex as well as everyday spatial information. As a result, increasing numbers of for-profit and non-profit organizations have recognized the need to transform their information into a spatial format. The demand for collaborative and participatory skills in the use of these mapping tools has, of course, been furthered by this general trend. Therefore, the goal for this course is that each student will become an independent and effective GIS user while developing their collaborative skills in the use of GIS for spatial analysis and representation. To meet this goal, this course follows a participatory workshop model, drawing on Elwood (2009) -- an intensive, hands-on experience in which student teams use GIS in collaboration with community partners. These partnerships will involve students in a full range of collaborative GIS: working with team members and project partners to identify project goals, acquiring and preparing spatial data for GIS analyses, communicating with clients to assess progress, managing spatial data, and producing necessary maps and analyses. The lecture, reading, and seminar discussion components of the course will focus on topics important to collaborative development -- to be prepared to implement, manage, and apply in a variety of research and applications areas, and in multiple geographical and institutional contexts. Note: Further details about these projects, as well as their data sources, are available on request.
- 2. GIS Workshop Spring 2010 Page 2 Table of Contents Student‐Authored Project Descrip5ons ............................................................................ 3 City of Muncie Animal Shelter ........................................................................................... 5 City of Muncie Total Strays in 2009 (dot density) 5 City of Muncie Total Strays in 2009 (by 2000 census tract) 6 City of Muncie Stray Cats in 2009 (by 2000 census tract) 7 City of Muncie Stray Dogs in 2009 (by 2000 census tracts) 8 City of Muncie Animals DOAs in 2009 (by 2000 census tracts) 9 City of Muncie Misc. Strays in 2009 (by 2000 census tracts) 10 Muncie Financial Services and Poverty Mapping ............................................................11 Muncie Social and Financial Services: Banks 11 Muncie Social and Financial Services: Tax PreparaMon 12 Muncie Social and Financial Services: Predatory Lending 13 Muncie Social and Financial Services: Homeless Shelters 14 Muncie Social and Financial Services: Churches 15 Muncie Social and Financial Services: Childcare 16 Muncie Social and Financial Services: Public Schools 17 Muncie Social and Financial Services: Libraries 18 Indiana 500 Tour .............................................................................................................. 19 Indiana 500 Tour Trail Basemap 19 Chicago Urban Heat Island 1998‐2008 ............................................................................ 20 Chicago Urban Heat Island: January Ground Surface 20 Chicago Urban Heat Island: April Ground Surface 21 Chicago Urban Heat Island: July Ground Surface 22 Chicago Urban Heat Island: October Ground Surface 23 Chicago Urban Heat Island: April 1998 Satellite Surface Temperature 24 Chicago Urban Heat Island: April 2008 Satellite Surface Temperature 25 Chicago Urban Heat Island: July 1998 Satellite Surface Temperature 26 Chicago Urban Heat Island: July 2008 Satellite Surface Temperature 27 Historical GIS for Tropical Cyclones ................................................................................. 28 Historical GIS for Tropical Cyclones: 1775 AtlanMc Hurricane Season 28 Historical GIS for Tropical Cyclones: 1775 Hurricane San Pedro 29 Historical GIS for Tropical Cyclones: 1775 Independence Hurricane 30 Historical GIS for Tropical Cyclones: 1775 Newfoundland Hurricane 31 Historical GIS for Tropical Cyclones: 1780 AtlanMc Hurricane Season 32 Mapping Muncie Sidewalks ............................................................................................. 33 Mapping Muncie Sidewalks: Available Sidewalks 33 Mapping Muncie Sidewalks: Sidewalk CondiMons 34 Mapping Muncie Sidewalks: ReMrement Services 35 Mapping Muncie Sidewalks: Major MITS bus stops 36 Mapping Muncie Sidewalks: Cultural Points of Interest 37 Mapping Muncie Sidewalks: Age 65+ 38
- 3. GIS Workshop Spring 2010 Page 3 Student‐Authored Project Descrip:ons Health Services in Muncie (maps not included as per agreement with partner) Brad Hofmann, Brad Beer, Corbin Haggard Our project consists of creating maps of the current use of the Open Door Health Services. We were given a list of patients under the age of 18 that have used the service. We created a map of this data that will display which census blocks have used the service the most. We also created a map of the primary care facilities in Muncie. When we use these two data sets and compare them to demographics such as poverty levels, race & ethnicity, single-parent household, insurance status, and teenage pregnancy rates the Open Door Health Services facility will be able to more confidently apply for grants because they will now be able to visually show where their services are being used. City of Muncie Animal Shelter (pgs. 5-10) Will Hamby, Andrew Goldblatt, Matt Canale The main objective of this project is to illustrate the growing stray animal problem in the City of Muncie. Animal shelter employees will be our primary target for this topic as well as the public. We will use mapping software, created by ESRI, as a tool to categorize and analyze data. This software will also be used to create maps that graphically represent problem areas within Muncie. These maps will be given to the City of Muncie Animal Shelter to give them an idea of where to focus their efforts in combating this problem. United Way: Financial Services and Poverty Mapping in Muncie (pgs. 11-18) Daniel Mills, Jeremy Trusty, Ashley Hooker The collaborative community project that we have been assigned is projected to provide the United Way with maps showing locations and density of certain places including poverty and social services, financial services, and tax preparation services. Specifically these locations include banks, child care providers, food pantries, homeless shelters, libraries, predatory lending facilities, schools, and tax preparation services. Our goal is to create maps of these locations within the city boundaries of Muncie, IN that can be used for future analysis. Mainly they will be used to analyze where certain places are located with respect to areas with the highest poverty levels ultimately representing potential areas for developing new facilities. Indiana 500 Tour (pg. 19) Todd Davis, Jeff Hultman, Carrah McElfresh The Indiana 500 Tour Project is aimed to guide the public of Indiana or surrounding areas in a tour of Indiana Automobile Historic Places. This trail will highlight the automobile industry, but also any business that has historical value when going on this tour. Our job as GIS students was to map the locations of interest. There are five different types of places to visit along the trail, and that can include everything from diners and drive-ins to historic museums. The final product of this project is an interactive website in which there will be information about anything that relates to this tour. Also, there will be interactive maps that can be sorted by what type of attraction the visitors wishes to view. Overall, it should be a great website to educate people in the history of Indiana's automobile industry, and then hopefully motivate them to go experience it first hand!
- 4. GIS Workshop Spring 2010 Page 4 Chicago Urban Heat Island 1998-2008 (pgs. 20-27) Laura Giboo, Jessica Thompson An urban heat island is a phenomenon in which city areas experience as much as a 10 degree Fahrenheit temperature increase over surrounding areas. To understand the urban heat island effect, it is important to note that city areas are made up primarily of concrete and asphalt (buildings and streets) with very little natural vegetation. The primary cause of heat islands is the absorption of incoming solar radiation which later becomes trapped on the earth’s surface. Urban heat islands are caused when the incoming solar radiation is absorbed into the Earth’s surface, concrete, and asphalt but is not released. An urban area becomes a storage box for heat in which the heat absorbed during the day, is not released until night (Gartland, 2008). In recent years, the Environmental Protection Agency (EPA) has established an Urban Heat Island Pilot Project, where Chicago was a chosen city. In this project, Chicago worked jointly with the EPA to reduce the urban heat island effect (EPA, 2002). Our project is geared towards analyzing the difference between the urban heat island effect from 1998, before the EPA implemented their pilot project, and 2008, to see if the pilot project has begun to eliminate the problem. We will use satellite imagery and various remote sensing and GIS tools to help with the analysis process. Historical GIS for Tropical Cyclones (pgs. 28-32) Steve LaVoie, Korey Klein, Derek Lawalin An extensive database that contains the tracks of known tropical cyclones in the North Atlantic Ocean after 1850 is currently available and is commonly known by the abbreviation HURDAT or North Atlantic Hurricane Database. While this database is an invaluable tool to public and private agencies alike, some of the deadliest hurricanes on record occurred prior to 1851. This study revolves around the identification and quantification of tropical cyclones that existed during the one hundred year period from 1751-1850 dubbed the "Pre-HURDAT era" by the analysis team. While previous researchers have compiled works on tropical cyclones that occurred prior to 1851, they have yet to attempt the development of a full database, complete with cyclone tracks, for any period prior to 1851. This study is essentially a synthesis of all available historical and scientific data in order to analyze the tracks of every tropical cyclone witnessed by man during the Pre-HURDAT era. The goal of this study is to add valuable data to HURDAT in order to determine long term trends in tropical cyclone frequency. United Way: Mapping Muncie Sidewalks (pgs. 33-38) Jeffrey Gibbs, Daniel Root Our project is focused on mapping the conditions of Muncie's sidewalks as they relate to the MITS bus system. As a portion of Muncie's senior population continues to grow, so does the importance of sidewalks and public transportation. This project aims to better illustrate areas where sidewalks need to be improved or constructed, so as to better serve Muncie's population. Sidewalks are important when it comes to getting to and from MITS route stops and shelters, and people being able to utilize the MITS system from their neighborhoods. The second half of our project deals with charting all MITS routes, MITS shelters and stop locations as they relate to sidewalk coverage for the city.
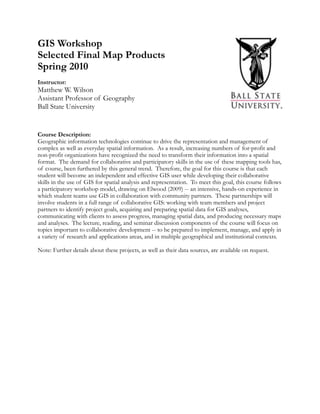
- 19. GIS Workshop Spring 2010 Page 19 Indiana 500 Tour Indiana 500 Tour Trail Basemap ! Michigan City ! § ¦ ¨ 31 § ¦ ¨80 § ¦ ¨912 South Bend Elkhart ! ! Chicago ! ! ! ! ! Warsaw ! Fort Wayne ! § ¦ ¨ 469 ! ! ! Lafayette Kokomo § ¦ ¨ 69 Muncie ! § ¦ ¨ 74 Anderson § ¨ ¦ ¦ ¨ § 65 465 ! ! Indianapolis !! § ¦ ¨70 ! ! !! ! Terre Haute ! Columbus Bloomington Cincinnati § ¦ ¨65 § ¦ ¨41 ! Louisville § ¦ ¨ 164 § ¦ ¨ 64 Evansville !
- 24. GIS Workshop Spring 2010 Page 24 Chicago Urban Heat Island: April 1998 Satellite Surface Temperature
- 25. GIS Workshop Spring 2010 Page 25 Chicago Urban Heat Island: April 2008 Satellite Surface Temperature
- 26. GIS Workshop Spring 2010 Page 26 Chicago Urban Heat Island: July 1998 Satellite Surface Temperature
- 27. GIS Workshop Spring 2010 Page 27 Chicago Urban Heat Island: July 2008 Satellite Surface Temperature
- 30. GIS Workshop Spring 2010 Page 30 Historical GIS for Tropical Cyclones: 1775 Independence Hurricane
- 31. GIS Workshop Spring 2010 Page 31 Historical GIS for Tropical Cyclones: 1775 Newfoundland Hurricane