Ecosystem Interactions Class Discussion Presentation in Blue Green Lined Styl...
Sarita chauhan seminar presentation
1. PHYSICS SEMINAR PRESENTATION 1
SUNSPOTS
Sunspot
Introduction to Sun Spots
Our Star Has Spots! The sun is a great star to study; since it is so close we can see many more details than on
any other star. One of the details we see are sunspots, small dark regions on the surface of the sun. When we
watch every day for years, we can see that sunspots come and go in patterns or cycles. The so-called "sunspot
cycle" not only affects the sun, it also affects life here on Earth.
Does it surprise you that our sun has spots? These spots may be seen even without a telescope. They look like
dark spots or blemishes on the sun's surface. If you took a picture of the sunspots each day, you would notice
that they all move a little bit every day. The sunspots do not really move, that small daily movement is caused by
the sun turning on its axis. The sun spins on its axis once every 27 days just as the Earth spins once every 24
hours. We do not know for sure what causes sunspots, but scientists know two things. Each sunspot has a
magnetic field that is strongest near the center of the sunspot. They also know that a sunspot is cooler than the
rest of the sun; the surface of the sun is about 6000 degrees C and a sunspot may be as cool as 3,000 degrees
C.
Sunspots follow some interesting patterns on our star. There is a cycle of Spots; during an eleven year period,
the number of spots seen on the sun Starts near zero and increases each year until many spots can be seen at
Once. Then the number of sunspots decreases slowly each year until there are very few sunspots again. The
pattern keeps repeating every eleven ears. Although some cycles have more sunspots than other cycles, the
Pattern does not change. The year 2000 had many sunspots because it is the peak of the current 11 year cycles.
Parts of the Sun
by Fraser Cain on March 11, 2012
2. PHYSICS SEMINAR PRESENTATION 2
SUNSPOTS
Interior of the Sun. Image credit: NASA
From here on Earth, the Sun like a smooth ball of fire, and before the discovery of sunspots by
Galileo, astronomers even thought it was a perfect orb with no imperfections. However, we now know
that the Sun, like Earth, is actually made up of several layers, each of which serves its own purpose.
It’s this structure of the Sun that powers this massive furnace and provider of all terrestrial life and
energy.
What is the Sun Made Of?
If you could take the Sun apart, and stack up its various elements, you would find that the Sun
is made of hydrogen (74%) and helium (about 24%). Astronomers consider anything heavier
than helium to be a metal. The remaining amount of the Sun is made of iron, nickel, oxygen,
silicon, sulfur, magnesium, carbon, neon, calcium and chromium. In fact, the Sun is 1%
3. PHYSICS SEMINAR PRESENTATION 3
SUNSPOTS
oxygen; and everything else comes out of that last 1%.
Supernova remnant SNR 0509-67.5. Supernovae provided the heavier elements in the Sun.
Image credit: NASA/ESA/CXC
Where did these elements come from? The hydrogen and helium came from the Big Bang. In the early
moments of the Universe, the first element, hydrogen, formed from the soup of elementary particles.
The pressure and temperatures were still so intense that the entire Universe had the same conditions as
the core of a star. Hydrogen was fused into helium until the Universe cooled down enough that this
reaction couldn’t happen any more. The ratios of hydrogen and helium that we see in the Universe
today were created in those first few moments after the Big Bang.
The other elements were created in other stars. Stars are constantly fusing hydrogen into
helium in their cores. Once the hydrogen in the core runs out, they switch to fusing heavier
and heavier elements, like helium, lithium, oxygen. Most of the heavier metals we see in the
Sun were formed in other stars at the end of their lives.
The heaviest elements, like gold and uranium, were formed when stars many times more
massive that our Sun detonated in supernova explosions. In a fraction of a second, as a black
hole was forming, elements were crushed together in the intense heat and pressure to form the
heaviest elements. The explosion scattered these elements across the region, where they could
contribute to the formation of new stars.
Our Sun is made up of elements left over from the Big Bang, elements formed from dying
stars, and elements created in supernovae. That’s pretty amazing.
4. PHYSICS SEMINAR PRESENTATION 4
SUNSPOTS
The proton-proton chain that fuels nuclear fusion inside the core of our Sun. Credit: Ian
O'Neill
Layers of the Sun
Although the Sun is mostly just a ball of hydrogen and helium, it’s actually broken up into distinct
layers. The layers of the Sun are created because the temperatures and pressures increase as you move
towards the center of the Sun. The hydrogen and helium behave differently under the changing
conditions.
The Core of the Sun
Let’s start at the innermost layer of the Sun, the core of the Sun. This is the very center of the
Sun, where temperatures and pressures are so high that fusion can happen. The Sun is
combining hydrogen into helium atoms, and this reaction gives off the light and heat that we
see here on Earth. The density of the core is 150 times the density of water, and the
temperatures are thought to be 13,600,000 degrees Kelvin.
Astronomers believe that the core of the Sun extends from the center out to about 0.2 solar
radius. And within this region, temperatures and pressures are so high that hydrogen atoms
are torn apart to form separate protons, neutrons and electrons. With all of these free floating
particles, the Sun is able to reform them into atoms of helium.
This reaction is exothermic. That means that the reaction gives off a tremendous amount of
heat – 3.89 x 1033 ergs of energy every second. The light pressure of all this energy streaming
from the core of the Sun is what stops it from collapsing inward on itself.
5. PHYSICS SEMINAR PRESENTATION 5
SUNSPOTS
Massive coronal mass ejection on. This image shows the size of the Earth to scale. NASA /
SDO / J. Major.
The Radiative Zone
The radiative zone of the Sun starts at the edge of the core of the Sun (0.2 solar radii), and extends up
to about 0.7 radii. Within the radiative zone, the solar material is hot and dense enough that thermal
radiation transfers the heat of the core outward through the Sun.
The core of the Sun is where nuclear fusion reactions are happening – protons are merged
together to create atoms of helium. This reaction produces a tremendous amount of gamma
radiation. These photons of energy are emitted, absorbed, and then emitted again by various
particles in the radiative zone.
The path that photons take is called the “random walk”. Instead of going in a straight beam of
light, they travel in a zigzag direction, eventually reaching the surface of the Sun. In fact, it
can take a single photon upwards of 200,000 years to make the journey through the radiative
zone of the Sun. As they transfer from particle to particle, the photons lose energy. That’s a
good thing, since we wouldn’t want only gamma radiation streaming from the Sun. Once
these photons reach space, they take a mere 8 minutes to get to Earth.
Most stars will have radiative zones, but their size depends on the star’s size. Small stars will
have much smaller radiative zones, and the convective zone will take up a larger portion of
the star’s interior. The smallest stars might not have a radiative zone at all, with the
convective zone reaching all the way down to the core. The largest stars would have the
opposite situation, where the radiative zone reaches all the way up to the surface.
The Convective Zone
Outside the radiative zone is another layer, called the convective zone, where heat from inside
the Sun is carried up by columns of hot gas.
Most stars have a convective zone. In the case of the Sun, it starts at around 70% of the Sun’s
radius and goes to the outer surface (the photosphere). Gas deeper inside the star is heated up
so that it rises, like globs of wax in a lava lamp. As it gets to the surface, the gas loses some of
6. PHYSICS SEMINAR PRESENTATION 6
SUNSPOTS
its heat, cools down, and sinks back towards the center to pick up more heat. Another
example would be a pot of boiling water on the stove.
Solar Prominence and Sunspot 1271. Credit: John Chumack
The surface of the Sun looks granulated. These granules are the columns of hot gas that carry heat to
the surface. They can be more than 1,000 km across, and typically last about 8 to 20 minutes before
dissipating.
Astronomers think that low mass stars, like red dwarfs, have a convective zone that goes all
the way down to the core. Unlike the Sun, they don’t have a radiative zone at all.
The Photosphere
The layer of the Sun that we can see from Earth is called the photosphere. Below the
photosphere, the Sun becomes opaque to visible light, and astronomers have to use other
methods to probe its interior. The temperature of the photosphere is about 6,000 Kelvin, and
gives off the yellow-white light that we see.
Above the photosphere is the atmosphere of the Sun. Perhaps the most dramatic of these is the
corona, which is visible during a total solar eclipse.
7. PHYSICS SEMINAR PRESENTATION 7
SUNSPOTS
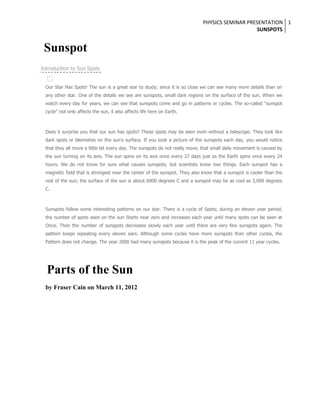
Diagram of the Sun. Image credit: NASA
Diagram of the Sun
This is a diagram of the Sun, originally developed by NASA for educational purposes.
Visible, IR and UV radiation – The light that we see coming from the Sun is visible, but if you
close your eyes and just feel the warmth, that’s IR, or infrared radiation. And the light that
gives you a sunburn is ultraviolet (UV) radiation. The Sun produces all of these wavelengths
at the same time.
Photosphere 6000 K – The photosphere is the surface of the Sun. This is the region where
light from the interior finally reaches space. The temperature is 6000 K, which is the same as
5,700 degrees C.
Radio emissions – In addition to visible, IR and UV, the Sun also gives off radio emissions,
which can be detected by a radio telescope. These emissions rise and fall depending on the
number of sunspots on the surface of the Sun.
Coronal Hole – These are regions on the Sun where the corona is cooler, darker and has less
dense plasma.
2100000 – This is the temperature of the Sun’s radiative zone.
Convective zone/Turbulent convection – This is the region of the Sun where heat from the
core is transferred through convection. Warm columns of plasma rise to the surface in
columns, release their heat and then fall back down to heat up again.
Coronal loops – These are loops of plasma in the Sun’s atmosphere that follows magnetic flux
lines. They look like big arches, stretching up from the surface of the Sun for hundreds of
thousands of kilometers.
Core – The is the heart of the Sun, where the temperatures and pressures are so high that
nuclear fusion reactions can happen. All of the energy coming from the Sun originates from
8. PHYSICS SEMINAR PRESENTATION 8
SUNSPOTS
the core.
14500000 K – The temperature of the core of the Sun.
Radiative Zone – The region of the Sun where energy can only be transferred through
radiation. It can take a single photon 200,000 years to get from the core, through the radiative
zone, out to the surface and into space.
Neutrinos – Neutrinos are nearly mass-less particles blasted out from the Sun as part of the
fusion reactions. There are millions of neutrinos passing through your body every second, but
they don’t interact, so you can’t feel them.
Chromospheric Flare – The Sun’s magnetic field can get twisted up and then snap into a
different configuration. When this happens, there can be powerful X-ray flares emanating
from the surface of the Sun.
Magnetic Field Loop – The Sun’s magnetic field extends out above its surface, and can be
seen because hot plasma in the atmosphere follows the field lines.
Spot – A sunspot. These are areas on the Sun’s surface where the magnetic field lines pierce
the surface of the Sun, and they’re relatively cooler than the surrounding areas.
Prominence – A bright feature that extends above the surface of the Sun, often in the shape of
a loop.
Energetic particles – There can be energetic particles blasting off the surface of the Sun to
create the solar wind. In solar storms, energetic protons can be accelerated to nearly the speed
of light.
X-rays – In addition to the wavelengths we can see, there are invisible X-rays coming from
the Sun, especially during flares. The Earth’s atmosphere protects us from this radiation.
Bright spots and short-lived magnetic regions – The surface of the Sun has many brighter and
dimmer spots caused by changing temperature. The temperature changes from the constantly
shifting magnetic field.
[?]
Skip Navigation (press 2)
News and Events
Multimedia
Technology Through Time
Promotional Materials
During the minimum of the sunspot cycle, when there are few spots on the sun, most of the spots are located
near the sun's north and
south poles. During the maximum of the sunspot cycle, when there are lots of spots on the sun, most of the
9. PHYSICS SEMINAR PRESENTATION 9
SUNSPOTS
spots are located closer to the sun's equator. When scientists make a graph of sunspots and where they are
located during different parts of the 11-year cycle ,the pattern is beautiful. The graph looks like a butterfly!
Something else interesting happens to the sun during the eleven year cycle. The earth has two magnetic poles,
the north pole and the south pole. The sun also has two magnetic poles. At the end of each cycle, the magnetic
poles on the sun change! The pole that was negative becomes positive; the pole that was positive become
negative. Sunspots are temporary phenomena on the photosphere of the Sun that appear visibly
as dark spots compared to surrounding regions. They are caused by intense magnetic activity,
which inhibits convection by an effect comparable to the eddy current brake, forming areas of
reduced surface temperature. Like magnets, they also have two poles. Although they are at
temperatures of roughly 3000–4500 K (2727–4227 °C), the contrast with the surrounding
material at about 5780 K (5500 °C) leaves them clearly visible as dark spots, as the luminous
intensity of a heated black body (closely approximated by the photosphere) is a function of
temperature to the fourth power. If the sunspot were isolated from the surrounding
photosphere it would be brighter than an electric arc. Sunspots expand and contract as they
move across the surface of the Sun and can be as large as 80,000 kilometers (50,000 mi) in
diameter, making the larger ones visible from Earth without the aid of a telescope.[1] They
may also travel at relative speeds ("proper motions") of a few hundred m/s when they first
emerge onto the solar photosphere.
Manifesting intense magnetic activity, sunspots host secondary phenomena such as coronal
loops (prominences) and reconnection events. Most solar flares and coronal mass ejections
originate in magnetically active regions around visible sunspot groupings. Similar phenomena
indirectly observed on stars are commonly called starspots and both light and dark spots have
been measured.[2]
A Sunspot
Almost any picture you see of the Sun will show sunspots. These are dark dots on the surface
of the Sun, and they’re even visible from Earth without a telescope. Galileo was the first to
point a telescope at the Sun and see sunspots, but it wasn’t until recently that astronomers had
a good explanation for what causes them.
Although sun spots are darker than the surrounding regions of the Sun, they’re actually
incredibly hot. A sun spot can be more than 3,500 degrees Kelvin. Even though that would be
white hot if you could look at it, that’s less bright than the average surface temperature of the
Sun, which is 5,800 Kelvin. They’re still extremely hot, but this is enough of a temperature
difference that they look dark in comparison. These features can be so large that the Earth
could fit within an average-sized sunspot.
The Sun is mostly made of plasma, a state of matter which has the additional property of
being highly magnetic. Because of the movement of plasma inside the Sun, it generates a
powerful magnetic field, similar to the Earth’s magnetosphere. But the magnetic field on the
Sun is constantly shifting around. Physicists believe that these magnetic field lines can get so
twisted up that they curl up like a rubber band and pierce the outside of the Sun.
10. PHYSICS SEMINAR PRESENTATION 10
SUNSPOTS
Sunspots are created at the points where the Sun’s magnetic field lines pierce through the
Sun’s photosphere (the part of the Sun that we can see). Although they look dark, they’re
really just a few thousand degrees cooler than the surrounding photosphere, so they’re
actually still very hot. The magnetic field lines are loops, so the sunspots appear in pairs; the
two points where a single loop comes out of the Sun and then goes back in.
A sunspot can be broken into two parts: the central umbra and the surrounding penumbra.
From within the central umbra region, the magnetic field lines are perpendicular to the Sun’s
surface, and are roughly vertical. Within the penumbral region, the field lines are inclined at
an angle.
Coronal mass ejections are explosions on the surface of the Sun that can through out
enormous amounts of material. They usually blast out of regions dominated by sunspots.
Astronomers have been tracking the number of sunspots for more than 100 years, and they’ve
learned that the number of sunspots on the Sun’s surface rises and falls in an 11-year cycle.
At the low point of the cycle, called the solar minimum, there can be few or no sunspots on
the surface of the Sun. And then at the high point, the solar maximum, we see the highest
number of sunspots.
o
Spots on the sun were once seen as rare and exotic, but are now a
commonplace, solar event.
ISSUE #52: SUNSPOTS FROM A TO B - SOLAR MAGNETISM
Figure 1: Closeup of a sunspot taken with the Swedish Solar Telescope in La Palma, the Cannary Islands. ( Courtesy:
Göran B. Scharmer, and Boris V. Gudiksen, The Swedish Institute for Solar Physics)
Sunspots have been observed on the sun for thousands of years, but only during the last century have
astronomers figured out what they actually are, and why the sun has them! Most of this advancement in our
knowledge occurred because of the advent of new technologies to observe the sun since the 1850s. Another
11. PHYSICS SEMINAR PRESENTATION 11
SUNSPOTS
important clue to solving the sunspot mystery was revealed when scientists developed powerful new insights
about how matter and the various fundamental forces of nature, actually worked.
Sunspots are found in the photosphere of the sun, where the temperature is 6,000 C, and the surface is
covered by innumerable, small convection cells called 'granules' (Figure 1). Sunspots have a dark, central
region called the umbra, surrounded by a lighter region called the penumbra. When examined at high
resolution, the penumbral region resolves into numerous filaments or 'fibrils' that radiate outwards from the
dark umbral zone (Figure 2). Temperatures in the umbral zone are commonly about 2,200 C, while in the
penumbral zone, temperatures can be as high as 3,500 C. The reason that sunspots appear dark is that they
are as much as 3,000 C cooler than the rest of the solar surface! Because brightness depends on the fourthpower of the temperature, the sunspot umbra emits 1/6 as much light as a similar-sized piece of the solar
surface.
Figure 2: Sunspot AR 10810, observed Sept. 23, 2005 with the Dunn Solar Telescope at the NSO. At this scale, the
Earth is as big as the dark 'umbral' region. (Courtesy: Friedrich Woeger, KIS, and Chris Berst and Mark Komsa,
NSO/AURA/NSF.)
Sunspots can be so cold that water vapor 'steam' can even form within them! In 1995, astronomers Lloyd
Wallace, William Livingston and Kenneth Hinkle at the National Solar Observatory in Tucson, Arizona worked
with collaborators to obtain infrared spectra that proved that water molecules could exist in the umbral regions
of some sunspots.
There is no typical size to a sunspot. They can be as small as the continent of Africa, or as large as 30-times
the diameter of the Earth! The number of sunspots on the solar surface also varies in an 11-year cycle,
discovered in 1843 by German astronomer Samuel Heinrich. During the peak of the sunspot cycle, as many as
200 spots and sunspot groups can be found. In actuality, the sunspot cycle is 22-years long because of the
magnetic properties of the sun.
12. PHYSICS SEMINAR PRESENTATION 12
SUNSPOTS
The sunspot cycle during the last 400 years.
Sunspots would not exist were it not for solar magnetism.
Below the photosphere, the convecting upper region of the sun allows the solar magnetic field to be
concentrated into dense rope-like structures. These magnetic ropes become buoyant and float up to the
surface, where they erupt as a pair of sunspots; one with a north-type polarity and one with a south-type. At
the start of the first cycle, the leading sunspot has the same polarity as the magnetic field of the sun in that
hemisphere. When the next 11-year cycle starts, the leading sunspot has the opposite polarity. Then during
the third cycle, the polarity of the leading sunspot has returned to the same polarity as the solar field in that
hemisphere. The full 'Hale-Cycle' takes 22 years.
The magnetic properties of sunspots were discovered by astronomer George Ellery Hale (1868-1938), in 1908
using a new instrument he had invented, and a newly-discovered physical effect called Zeeman splitting.
Under laboratory conditions, if you look at the light from atoms in a strong magnetic field, a very high resolution
spectroscope will show that the atomic lines are split into pairs. The wavelength separation of these pairs will
increase as the strength of the magnetic field increases. After careful measurements, Hale was able to
determine that sunspots have magnetic fields as strong as 1,500 Gauss, which is about 2000 times Earth's
magnetic field, and 100 times the Sun's common surface field!
The discovery of strong sunspot fields also provided astronomers with a powerful clue as to why they are dark.
The strong magnetic field of a spot makes it very hard for gases below these spots to transport heat from the
lower layers of the sun to its surface. That means that the gases can be considerably cooler than the rest of
the sun because there is less energy available from below to keep them heated. As a result, the gases are
cooler, emit less light, and are darker.
Recently, data obtained by the SOHO satellite has allowed astronomers to look below the surface of a
sunspot! The accompanying animation, based on a computer model of the physical conditions, reveals just
how gases move around. (SOHOconv.mpeg). As the cooler umbral gasses flow downwards, they collide with
upward-moving gases, and are deflected around the spot.
An important consequence of this flow pattern is that the energy flowing from lower regions is diverted around
the sunspot and causes the surrounding solar surface to emit more ultraviolet light. As a result, during sunspot
maximum conditions, the sun is actually a few percent BRIGHTER in ultraviolet light than at other times, even
though the surface is visibly covered with lots of dark umbral regions. This UV increase can be detected at
13. PHYSICS SEMINAR PRESENTATION 13
SUNSPOTS
Earth, and actually produces a measurable climate impact!
By the way, high-resolution images of sunspots reveal new details that challenge astronomers to understand
even finer details of sunspot physics. In Figure 1, taken with the Swedish Vacuum Telescope at La Palma in
the Canary Islands, features described as hairs and canals are seen as dark cores visible within the bright
filaments that extend into the sunspot. The filaments' newly revealed dark cores are seen to be thousands of
kilometers long but only about 100 kilometers wide. These features represent previously unknown and
unexplored solar phenomena.
Sunspot Cycle
An Active Sunspot
14. PHYSICS SEMINAR PRESENTATION 14
SUNSPOTS
Galileo Galilei made a huge number of revolutionary discoveries when he pointed his first
rudimentary telescope at the skies in 1610. One of these was the discovery that the Sun isn’t a pristine
ball, but actually had blemishes that moved across its surface. Galileo was the first to discover
sunspots.
From this point on, astronomers were hard at work cataloging the size and number of
sunspots, and they learned that the rise and fall in the number of sunspots follows an 11-year
period – this is the sunspot cycle.
Astronomers now maintain the “sunspot number”. They add up the total number of sunspot
groups, and the count the number of individual sunspots. And these observations have been
made for over 300 years. Sometimes the sunspot cycle can be as short as 9 years and other
times as long as 14 years. But on average, it takes 11 years.
At the height of solar activity, there can be dozens of sunspots on the surface of the Sun at the
15. PHYSICS SEMINAR PRESENTATION 15
SUNSPOTS
same time, and at the lowest points, the Sun can go days without sunspots. When the Sun is
most active, it releases more flares and coronal mass ejections, so astronomers are continuing
to gather data about the sunspot cycle, to better predict solar weather. This will be especially
important when the first astronauts travel to the Moon, and could be at risk to a radioactive
solar storm.
Why does the sunspot cycle rise and fall like this? Scientists just aren’t sure. It’s all connected
to the Sun’s magnetic field, which twists and turns as it rotates. Sunspots occur at the points
where the magnetic field lines pierce the surface of the Sun.
But why it takes 11-years between minimum and maximum? Nobody knows. One theory is
that it has something to do with the tidal interactions between the Sun, Jupiter and Saturn.
Here’s an article from Universe Today about a puzzling lack of sunspots, and
another article about how the Sun burst into light during a cycle.
Here’s a page from NASA that explains the sunspot cycle, and a bunch of charts from
NOAA.
Physics
A sunspot viewed close-up in ultraviolet light, taken by the TRACE spacecraft
Main article: Solar cycle
Although the details of sunspot generation are still a matter of research, it appears that
sunspots are the visible counterparts of magnetic flux tubes in the Sun's convective zone that
get "wound up" by differential rotation. If the stress on the tubes reaches a certain limit, they
curl up like a rubber band and puncture the Sun's surface. Convection is inhibited at the
puncture points; the energy flux from the Sun's interior decreases; and with it surface
temperature.
The Wilson effect tells us that sunspots are actually depressions on the Sun's surface.
Observations using the Zeeman effect show that prototypical sunspots come in pairs with
opposite magnetic polarity. From cycle to cycle, the polarities of leading and trailing (with
16. PHYSICS SEMINAR PRESENTATION 16
SUNSPOTS
respect to the solar rotation) sunspots change from north/south to south/north and back.
Sunspots usually appear in groups.
The sunspot itself can be divided into two parts:
The central umbra, which is the darkest part, where the magnetic field is
approximately vertical (normal to the Sun's surface).
The surrounding penumbra, which is lighter, where the magnetic field is more
inclined.
Magnetic pressure should tend to remove field concentrations, causing the sunspots to
disperse, but sunspot lifetimes are measured in days or even weeks. Recent observations from
the Solar and Heliospheric Observatory (SOHO) using sound waves traveling below the Sun's
photosphere (local helioseismology) have been used to develop a three-dimensional image of
the internal structure below sunspots; these observations show that there is a powerful
downdraft underneath each sunspot, forming a rotating vortex that concentrates the magnetic
field. Sunspots can thus be thought of as self-perpetuating storms, analogous in some ways to
terrestrial hurricanes.
Butterfly diagram showing paired Spörer's law behavior
Sunspot activity cycles about every eleven years. The point of highest sunspot activity during
this cycle is known as Solar Maximum, and the point of lowest activity is Solar Minimum.
Early in the cycle, sunspots appear in the higher latitudes and then move towards the equator
as the cycle approaches maximum: this is called Spörer's law.
Wolf number sunspot index displays various periods, the most prominent of which is at about
11 years in the mean. This period is also observed in most other expressions of solar activity
and is deeply linked to a variation in the solar magnetic field that changes polarity with this
period, too.
The modern understanding of sunspots starts with George Ellery Hale, who first linked
magnetic fields and sunspots in 1908.[14] Hale suggested that the sunspot cycle period is
22 years, covering two polar reversals of the solar magnetic dipole field. Horace W. Babcock
17. PHYSICS SEMINAR PRESENTATION 17
SUNSPOTS
later proposed a qualitative model for the dynamics of the solar outer layers. The Babcock
Model explains that magnetic fields cause the behavior described by Spörer's law, as well as
other effects, which are twisted by the Sun's rotation.
Sunspot variation
Main article: Solar variation
400 year sunspot history
11,000 year sunspot reconstruction
Sunspot populations quickly rise and more slowly fall on an irregular cycle of 11 years,
although significant variations in the number of sunspots attending the 11-year period are
known over longer spans of time. For example, from 1900 to the 1960s the solar maxima
trend of sunspot count has been upward; from the 1960s to the present, it has diminished
somewhat.[24] Over the last decades the Sun has had a markedly high average level of sunspot
activity; it was last similarly active over 8,000 years ago.[6]
The number of sunspots correlates with the intensity of solar radiation over the period since
1979, when satellite measurements of absolute radiative flux became available. Since
sunspots are darker than the surrounding photosphere it might be expected that more sunspots
would lead to less solar radiation and a decreased solar constant. However, the surrounding
margins of sunspots are brighter than the average, and so are hotter; overall, more sunspots
increase the Sun's solar constant or brightness. The variation caused by the sunspot cycle to
solar output is relatively small, on the order of 0.1% of the solar constant (a peak-to-trough
range of 1.3 W·m−2 compared to 1366 W·m−2 for the average solar constant).[25][26] Sunspots
18. PHYSICS SEMINAR PRESENTATION 18
SUNSPOTS
were rarely observed during the Maunder Minimum in the second part of the 17th century
(approximately from 1645 to 1715).
Sunspot observation
The Swedish 1-m Solar Telescope at Roque de los Muchachos Observatory, La Palma in the
Canary Islands
Sunspots are observed with land-based and Earth-orbiting solar telescopes. These telescopes
use filtration and projection techniques for direct observation, in addition to various types of
filtered cameras. Specialized tools such as spectroscopes and spectrohelioscopes are used to
examine sunspots and sunspot areas. Artificial eclipses allow viewing of the circumference of
the Sun as sunspots rotate through the horizon.
Since looking directly at the Sun with the naked eye permanently damages vision, amateur
observation of sunspots is generally conducted indirectly using projected images, or directly
through protective filters. Small sections of very dark filter glass, such as a #14 welder's glass
are effective. A telescope eyepiece can project the image, without filtration, onto a white
screen where it can be viewed indirectly, and even traced, to follow sunspot evolution.
Special purpose hydrogen-alpha narrow bandpass filters as well as aluminum coated glass
attenuation filters (which have the appearance of mirrors due to their extremely high optical
density) on the front of a telescope provide safe observation through the eyepiece.
Application
19. PHYSICS SEMINAR PRESENTATION 19
SUNSPOTS
A large group of sunspots in 2004. The grey area around the spots can be seen very clearly, as
well as the granulation of the Sun's surface
Due to its link to other kinds of solar activity, sunspot occurrence can be used to help predict
space weather, the state of the ionosphere, and hence the conditions of short-wave radio
propagation or satellite communications. Solar activity (and the sunspot cycle) are frequently
discussed in the context of global warming; Jack Eddy noted the apparent correlation between
the Maunder Minimum of sunspot occurrence and the Little Ice Age in European
climate.[citation needed] Sunspots themselves, in terms of the magnitude of their radiant-energy
deficit, have only a weak effect on the terrestrial climate[27] in a direct sense. On longer time
scales, such as the solar cycle, other magnetic phenomena (faculae and the chromospheric
network) do correlate with sunspot occurrence. It is these other features that make the solar
constant increase slightly at sunspot maxima, when naively one might expect that sunspots
would make it decrease.[28]
British economist William Stanley Jevons suggested in the 1870s that there is a relationship
between sunspots and business cycle crises. Jevons reasoned that sunspots affect Earth's
weather, which, in turn, influences crops and, therefore, the economy.[29]
Spots on other stars
In 1947, G. E. Kron proposed that starspots were the reason for periodic changes in brightness
on red dwarfs.[2] Since the mid-1990s, starspot observations have been made using
increasingly powerful techniques yielding more and more detail: photometry showed starspot
growth and decay and showed cyclic behavior similar to the Sun's; spectroscopy examined
the structure of starspot regions by analyzing variations in spectral line splitting due to the
Zeeman Effect; Doppler imaging showed differential rotation of spots for several stars and
distributions different from the Sun's; spectral line analysis measured the temperature range of
spots and the stellar surfaces. For example, in 1999, Strassmeier reported the largest cool
starspot ever seen rotating the giant K0 star XX Triangulum (HD 12545) with a temperature
of 3,500 K (3,230 °C), together with a warm spot of 4,800 K (4,530 °C).[2][30]
20. PHYSICS SEMINAR PRESENTATION 20
SUNSPOTS
Pictures of the Sun
by Fraser Cain on September 12, 2008
There are so many beautiful pics of the Sun, it’s almost too difficult to know where to start.
21. PHYSICS SEMINAR PRESENTATION 21
SUNSPOTS
Sun with a huge coronal mass ejection.
This is a picture of the Sun captured by NASA’s SOHO spacecraft. It would be a typical day on the
Sun, except for the enormous coronal mass ejection blasting out of the upper right-hand side of the
Sun. When the Sun is at its most active state, it can release 5-6 of these a day.
22. PHYSICS SEMINAR PRESENTATION 22
SUNSPOTS
STEREO's image of the Sun.
This photograph of the Sun was one of the first captured by NASA’s STEREO mission. These twin
spacecraft were launched in 2006. One is leading the Earth in orbit, while the other has fallen behind.
With both observing the Sun, scientists are given a 3-dimensional view of the Sun.
23. PHYSICS SEMINAR PRESENTATION 23
SUNSPOTS
Sun seen from TRACE.
This pic of the Sun shows our star on a calm day, believe it or now. When you look close, this is what
the surface of the Sun is doing all the time. The TRACE spacecraft was launched in 1997, and helps
scientists study the Sun’s magnetic field – and to take beautiful photos like this.
24. PHYSICS SEMINAR PRESENTATION 24
SUNSPOTS
Ultraviolet view of the Sun
This picture of the Sun was captured by the EIT instrument on board the NASA/ESA SOHO
spacecraft. It reveals the normally invisible ultraviolet radiation streaming from the Sun. It’s actually a
composite of three different Sun photos captured at different parts of the ultraviolet spectrum and then
merged together.
25. PHYSICS SEMINAR PRESENTATION 25
SUNSPOTS
Picture of the Sun in 3-D
You’re going to need a set of 3-D glasses to get the most out of this Sun photograph. It’s an image of
Sun captured by NASA’s twin STEREO spacecraft. Images like this help scientists understand how
the Sun interacts with its local environment, and better predict space weather.
Sunspots imaged on 22 June 2004
26. PHYSICS SEMINAR PRESENTATION 26
SUNSPOTS
.
Gallery
For a better video playback experience we recommend a html5 video browser.
Sunspot NOAA 875.
For a better video playback experience we recommend a html5 video browser.
A flare from sunspot NOAA 875.
27. PHYSICS SEMINAR PRESENTATION 27
SUNSPOTS
This visualization tracks the emergence and evolution of a sunspot group as seen starting in early
February 2011 and continuing for two weeks. Images are sampled one hour apart. The camera
tracks the movement of the solar rotation. At this scale, a 'shimmer' of the solar surface is visible,
created by the turnover of convection cells.
A view of the coronal structure
.
September 201
A view of the coronal structure above a different sunspot seen in October 2010.
Sunspot 923 at sunset and in solar scope
Sunset Superior Mirage of sunspot #930
28. PHYSICS SEMINAR PRESENTATION 28
SUNSPOTS
Sunset in Bangladesh, January 2004
Setting sun with large sunspot, August 2010