SlideShare uma empresa Scribd logo
1 de 42
Baixar para ler offline
Chapter 3 1©2005 Pearson Education, Inc.
Indifference Curves:
An Example (pp. 65 - 79)
4010H
2010G
4030E
2040D
5010B
3020A
Units of ClothingUnits of FoodMarket Basket
Chapter 3 2©2005 Pearson Education, Inc.
Indifference Curves:
An Example (pp. 65 - 79)
Graph the points with one good on the x-
axis and one good on the y-axis
Plotting the points, we can make some
immediate observations about
preferences
The more, the better
Chapter 3 3©2005 Pearson Education, Inc.
The consumer prefers
A to all combinations
in the yellow box, while
all those in the pink
box are preferred to A.
Indifference Curves:
An Example (pp. 65 - 79)
Food
10
20
30
40
10 20 30 40
Clothing 50
G
A
EH
B
D
Chapter 3 4©2005 Pearson Education, Inc.
Indifference Curves:
An Example (pp. 65 - 79)
Points such as B & D have more of one
good but less of another compared to A
Need more information about consumer
ranking
Consumer may decide they are
indifferent between B, A and D
We can then connect those points with an
indifference curve
Chapter 3 5©2005 Pearson Education, Inc.
•Indifferent
between points B,
A, & D
•E is preferred to
any points on the
indifference curve
U1
•Points on U1 are
preferred to H & G
Indifference Curves:
An Example (pp. 65 - 79)
Food
10
20
30
40
10 20 30 40
Clothing
50
U1G
D
A
E
H
B
Chapter 3 6©2005 Pearson Education, Inc.
Indifference Curves (pp. 65 - 79)
Any market basket lying northeast of an
indifference curve is preferred to any
market basket that lies on the
indifference curve
Points on the curve are preferred to
points southwest of the curve
Chapter 3 7©2005 Pearson Education, Inc.
Indifference Curves (pp. 65 - 79)
Indifference curves slope downward to
the right
If they sloped upward, they would violate the
assumption that more is preferred to less
Chapter 3 8©2005 Pearson Education, Inc.
Indifference Curves (pp. 65 - 79)
To describe preferences for all
combinations of goods/services, we have
a set of indifference curves – an
indifference map
Each indifference curve in the map shows
the market baskets among which the person
is indifferent
Chapter 3 9©2005 Pearson Education, Inc.
U2
U3
Indifference Map (pp. 65 - 79)
Food
Clothing
U1
AB
D
Market basket A
is preferred to B.
Market basket B is
preferred to D.
Chapter 3 10©2005 Pearson Education, Inc.
Indifference Maps (pp. 65 - 79)
Indifference maps give more information
about shapes of indifference curves
Indifference curves cannot cross
Violates assumption that more is better
Why? What if we assume they can cross?
Chapter 3 11©2005 Pearson Education, Inc.
Indifference Maps (pp. 65 - 79)
Food
Clothing
•B is preferred to D
•A is indifferent to B & D
•B must be indifferent to
D but that can’t be if B is
preferred to D. A
contradiction
•Other example:
On a map, two
contours never cross
each other.
U1
U1
U2
U2
A
B
D
Chapter 3 12©2005 Pearson Education, Inc.
Indifference Curves (pp. 65 - 79)
The shapes of indifference curves
describe how a consumer is willing to
substitute one good for another
A to B, give up 6 clothing to get 1 food
D to E, give up 2 clothing to get 1 food
The more clothing and less food a person
has, the more clothing they will give up to
get more food
Chapter 3 13©2005 Pearson Education, Inc.
A
B
D
E
G
-1
-6
1
1
-4
-2
1
1
Observation: The amount
of clothing given up for
1 unit of food decreases
from 6 to 1
Indifference Curves (pp. 65 - 79)
Food
Clothing
2 3 4 51
2
4
6
8
10
12
14
16
Chapter 3 14©2005 Pearson Education, Inc.
Indifference Curves (pp. 65 - 79)
We measure how a person trades one
good for another using the marginal rate
of substitution (MRS)
It quantifies the amount of one good a
consumer will give up to obtain more of
another good, or the individual terms of trade
From a geometric viewpoint, it is measured
by the slope of the indifference curve
Chapter 3 15©2005 Pearson Education, Inc.
Marginal Rate of Substitution (pp. 65
- 79)
Food
2 3 4 51
Clothing
2
4
6
8
10
12
14
16 A
B
D
E
G
-6
1
1
1
1
-4
-2
-1
MRS = 6
MRS = 2
F
CMRS
Δ
Δ−=
Chapter 3 16©2005 Pearson Education, Inc.
Marginal Rate of Substitution (pp. 65
- 79)
From A to B, give up 6 clothing to get 1 food.
That is,
ΔF=2-1=1, ΔC=10-16 =-6; MRS=- ΔC / ΔF=6
From D to E, , give up 2 clothing to get 1 food;
ΔF=4-3=1, ΔC=4-6 =-2; MRS =- ΔC / ΔF= 2
Chapter 3 17©2005 Pearson Education, Inc.
Marginal Rate of Substitution (pp. 65
- 79)
Indifference curves are convex
As more of one good is consumed, a consumer would
prefer to give up fewer units of a second good to get
additional units of the first one. As food becomes less
scarce, he/she would give up less of clothing for an
additional food.
Consumers generally prefer a balanced market
basket (preference for varieties; the Doctrine of
the Mean in a Chinese classic)
Chapter 3 18©2005 Pearson Education, Inc.
Marginal Rate of Substitution (pp. 65
- 79)
The MRS decreases as we move down
the indifference curve
Along an indifference curve there is a
diminishing marginal rate of substitution.
The MRS went from 6 to 4 to 1
Chapter 3 19©2005 Pearson Education, Inc.
Marginal Rate of Substitution (pp. 65
- 79)
Indifference curves with different shapes
imply a different willingness to substitute
[That is, an indifference map is a concept
to represent one’s preference for market
baskets.]
Two polar cases are of interest
Perfect substitutes
Perfect complements
Chapter 3 20©2005 Pearson Education, Inc.
Marginal Rate of Substitution (pp. 65
- 79)
Perfect Substitutes
Two goods are perfect substitutes when the
marginal rate of substitution of one good for
the other is constant
Example: a person might consider apple
juice and orange juice perfect substitutes
They would always trade 1 glass of OJ for 1
glass of Apple Juice
Find your own examples.
Chapter 3 21©2005 Pearson Education, Inc.
Consumer Preferences (pp. 65 - 79)
Orange Juice
(glasses)
Apple
Juice
(glasses)
2 3 41
1
2
3
4
0
Perfect
Substitutes
Chapter 3 22©2005 Pearson Education, Inc.
Consumer Preferences (pp. 65 - 79)
Perfect Complements
Two goods are perfect complements when
the indifference curves for the goods are
shaped as right angles
Example: If you have 1 left shoe and 1 right
shoe, you are indifferent between having
more left shoes only
Must have one right for one left. That’s why we
always get a pair of shoes, not one by one.
Find your own examples.
Chapter 3 23©2005 Pearson Education, Inc.
Consumer Preferences (pp. 65 - 79)
Right Shoes
Left
Shoes
2 3 41
1
2
3
4
0
Perfect
Complements
Chapter 3 24©2005 Pearson Education, Inc.
Consumer Preferences:
An Application (pp. 65 - 79)
In designing new cars, automobile
executives must determine how much
time and money to invest in restyling
versus increased performance
Higher demand for car with better styling and
performance
Both cost more to improve
Chapter 3 25©2005 Pearson Education, Inc.
Consumer Preferences:
An Application (pp. 65 - 79)
An analysis of consumer preferences
would help to determine where to spend
more on change: performance or styling
Some consumers will prefer better styling
and some will prefer better performance
In recent years we have seen more and
more SUVs on our roads. Certainly more
owners/drivers prefer SUVs to other
styles.
Chapter 3 26©2005 Pearson Education, Inc.
Consumer Preferences (pp. 65 - 79)
The theory of consumer behavior does
not required assigning a numerical value
to the level of satisfaction. Can you tell
the level of satisfaction from your monthly
basket?
Although ranking of market baskets is
good, sometimes numerical value is
useful
Chapter 3 27©2005 Pearson Education, Inc.
Consumer Preferences (pp. 65 - 79)
Utility
A numerical score (concept) representing the
satisfaction that a consumer gets from a
given market basket. The concept of utility was
born before that of consumer preference.
If buying 3 copies of Microeconomics makes
you happier than buying one shirt, then we
say that the books give you more utility than
the shirt
Chapter 3 28©2005 Pearson Education, Inc.
Utility (pp. 65 - 79)
Utility function
Formula that assigns a level of utility to
individual market baskets
If the utility function is
U(F,C) = F + 2C
A market basket with 8 units of food and 3 units of
clothing gives a utility of
14 = 8 + 2(3)
Chapter 3 29©2005 Pearson Education, Inc.
Utility - Example (pp. 65 - 79)
4 + 2(4) = 1244C
6 + 2(4) = 1446B
8 + 2(3) = 1438A
UtilityClothingFoodMarket
Basket
Consumer is indifferent between A & B and
prefers both to C.
Chapter 3 30©2005 Pearson Education, Inc.
Utility - Example (pp. 65 - 79)
Baskets for each level of utility can be
plotted to get an indifference curve
To find the indifference curve for a utility of
14, we can change the combinations of food
and clothing that give us a utility of 14
Chapter 3 31©2005 Pearson Education, Inc.
Utility - Another Example (pp. 65 - 79)
Food
10 155
5
10
15
0
Clothing
U1 = 25
U2 = 50
U3 = 100A
B
C
Basket U = FC
C 25 = 2.5(10)
A 25 = 5(5)
B 25 = 10(2.5)
Chapter 3 32©2005 Pearson Education, Inc.
Utility (pp. 65 - 79)
Although we numerically rank baskets and
indifference curves, numbers are ONLY for
ranking
A utility of 4 is not necessarily twice as good as
a utility of 2. A umber assigned to a utility level
DOES NOT have any meaning.
There are two types of rankings
Ordinal ranking; Ordinal Utility Function
Think of a number on your ticket when you are in a
waiting line.
Cardinal ranking; Cardinal Utility Function
Think of the total number of students in this class.
Chapter 3 33©2005 Pearson Education, Inc.
Budget Constraints (pp. 79 - 83)
Preferences do not explain all of
consumer behavior
Budget constraints limit an individual’s
ability to consume in light of the prices
they must pay for various goods and
services
Chapter 3 34©2005 Pearson Education, Inc.
Budget Constraints (pp. 79 - 83)
The Budget Line (Constraint)
Indicates all combinations of two
commodities for which total money spent
equals total income
We assume only 2 goods are consumed, so
we do not consider savings
Chapter 3 35©2005 Pearson Education, Inc.
The Budget Line (pp. 79 - 83)
Let F equal the amount of food
purchased, and C is the amount of
clothing
Price of food = PF and price of
clothing = PC
Then PFF is the amount of money spent
on food, and PCC is the amount of money
spent on clothing
Chapter 3 36©2005 Pearson Education, Inc.
ICPFP CF =+
The Budget Line (pp. 79 - 83)
The budget line then can be written:
All income is allocated to food (F) and/or clothing
(C)
Chapter 3 37©2005 Pearson Education, Inc.
The Budget Line (pp. 79 - 83)
Different choices of food and clothing can
be calculated that use all income
These choices can be graphed as the budget
line
Example:
Assume income of $80/week, PF = $1 and PC
= $2
Chapter 3 38©2005 Pearson Education, Inc.
Budget Constraints (pp. 79 - 83)
$80080G
$801060E
$802040D
$803020B
$80400A
Income
I = PFF + PCC
Clothing
PC = $2
Food
PF = $1
Market
Basket
Chapter 3 39©2005 Pearson Education, Inc.
C
F
P
P
F
C
Slope -
2
1
- ==
Δ
Δ
=
The Budget Line (pp. 79 - 83)
10
20
A
B
D
E
G
(I/PC) = 40
Food
40 60 80 = (I/PF)20
10
20
30
0
Clothing
Chapter 3 40©2005 Pearson Education, Inc.
The Budget Line (pp. 79 - 83)
As consumption moves along a budget
line from the intercept, the consumer
spends less on one item and more on the
other
The slope of the line measures the
relative cost of food and clothing
The slope is the negative of the ratio of
the prices of the two goods
Chapter 3 41©2005 Pearson Education, Inc.
The Budget Line (pp. 79 - 83)
The slope indicates the rate at which the
two goods can be substituted without
changing the amount of money spent
It represents exchange ratio or terms of
trade in market places.
We can rearrange the budget line
equation to make this more clear
Chapter 3 42©2005 Pearson Education, Inc.
The Budget Line (pp. 79 - 83)
YX
P
P
P
I
YPXPI
YPXPI
Y
X
Y
YX
YX
=−
=−
+=

Mais conteúdo relacionado

Mais procurados

Consumer Equilibrium by Indifference Curve Analysis
Consumer Equilibrium by Indifference Curve AnalysisConsumer Equilibrium by Indifference Curve Analysis
Consumer Equilibrium by Indifference Curve AnalysisMohammed Jasir PV
 
The Market Forces of Supply and Demand
The Market Forces of Supply and DemandThe Market Forces of Supply and Demand
The Market Forces of Supply and DemandTuul Tuul
 
Utility - Concept and Types - Law of Diminishing Marginal Utility - Assumptio...
Utility - Concept and Types - Law of Diminishing Marginal Utility - Assumptio...Utility - Concept and Types - Law of Diminishing Marginal Utility - Assumptio...
Utility - Concept and Types - Law of Diminishing Marginal Utility - Assumptio...Mohammed Jasir PV
 
Theory of consumer behavior
Theory of consumer behaviorTheory of consumer behavior
Theory of consumer behaviorer_kamal
 
Elasticity Micro Economics ECO101
Elasticity Micro Economics ECO101Elasticity Micro Economics ECO101
Elasticity Micro Economics ECO101Sabih Kamran
 
Cardinal approches
Cardinal approchesCardinal approches
Cardinal approchesAdeel Razzaq
 
Economics giffen GOODS
Economics giffen GOODSEconomics giffen GOODS
Economics giffen GOODSSmeet Jain
 
Price strategy & price discrimination
Price strategy & price discriminationPrice strategy & price discrimination
Price strategy & price discriminationRutvik Patel
 
Income consumption curve,price consumption curve, engles law
Income consumption curve,price consumption curve, engles law  Income consumption curve,price consumption curve, engles law
Income consumption curve,price consumption curve, engles law Ekta Doger
 
Ordinal Utility Approach IC Curve
Ordinal Utility Approach IC CurveOrdinal Utility Approach IC Curve
Ordinal Utility Approach IC CurveTej Kiran
 
Law of diminishing marginal utility
Law of diminishing marginal utilityLaw of diminishing marginal utility
Law of diminishing marginal utilitynirali2301
 
Income elasticity of demand
Income elasticity of demandIncome elasticity of demand
Income elasticity of demandbusinesstopia
 

Mais procurados (20)

Consumer theory
Consumer theoryConsumer theory
Consumer theory
 
Consumer Equilibrium by Indifference Curve Analysis
Consumer Equilibrium by Indifference Curve AnalysisConsumer Equilibrium by Indifference Curve Analysis
Consumer Equilibrium by Indifference Curve Analysis
 
The Market Forces of Supply and Demand
The Market Forces of Supply and DemandThe Market Forces of Supply and Demand
The Market Forces of Supply and Demand
 
Microeconomics: Income and Substitution Effects
Microeconomics: Income and Substitution EffectsMicroeconomics: Income and Substitution Effects
Microeconomics: Income and Substitution Effects
 
Utility - Concept and Types - Law of Diminishing Marginal Utility - Assumptio...
Utility - Concept and Types - Law of Diminishing Marginal Utility - Assumptio...Utility - Concept and Types - Law of Diminishing Marginal Utility - Assumptio...
Utility - Concept and Types - Law of Diminishing Marginal Utility - Assumptio...
 
Budget constrain
Budget constrainBudget constrain
Budget constrain
 
Theory of consumer behavior
Theory of consumer behaviorTheory of consumer behavior
Theory of consumer behavior
 
Elasticity Micro Economics ECO101
Elasticity Micro Economics ECO101Elasticity Micro Economics ECO101
Elasticity Micro Economics ECO101
 
Theory consumer choice
Theory consumer choice Theory consumer choice
Theory consumer choice
 
Cardinal approches
Cardinal approchesCardinal approches
Cardinal approches
 
Theory of supply
Theory of supplyTheory of supply
Theory of supply
 
Economics giffen GOODS
Economics giffen GOODSEconomics giffen GOODS
Economics giffen GOODS
 
Price strategy & price discrimination
Price strategy & price discriminationPrice strategy & price discrimination
Price strategy & price discrimination
 
Income consumption curve,price consumption curve, engles law
Income consumption curve,price consumption curve, engles law  Income consumption curve,price consumption curve, engles law
Income consumption curve,price consumption curve, engles law
 
Ordinal Utility Approach IC Curve
Ordinal Utility Approach IC CurveOrdinal Utility Approach IC Curve
Ordinal Utility Approach IC Curve
 
Demand Function
Demand FunctionDemand Function
Demand Function
 
Law of diminishing marginal utility
Law of diminishing marginal utilityLaw of diminishing marginal utility
Law of diminishing marginal utility
 
Indifrrence curve analysis
Indifrrence curve analysisIndifrrence curve analysis
Indifrrence curve analysis
 
Income elasticity of demand
Income elasticity of demandIncome elasticity of demand
Income elasticity of demand
 
Indifference curve
Indifference curveIndifference curve
Indifference curve
 

Semelhante a Indifference Curve

Chapter 3 Consumer Behaviour
Chapter 3 Consumer BehaviourChapter 3 Consumer Behaviour
Chapter 3 Consumer Behaviourprovost33
 
Chapter 3 consumer behavior
Chapter 3 consumer behaviorChapter 3 consumer behavior
Chapter 3 consumer behaviorYesica Adicondro
 
indifference curve analysis [Autosaved].pptx
indifference curve analysis [Autosaved].pptxindifference curve analysis [Autosaved].pptx
indifference curve analysis [Autosaved].pptxShreyasYewale
 
[PERT-3] Consumer Behaviour.pdf
[PERT-3] Consumer Behaviour.pdf[PERT-3] Consumer Behaviour.pdf
[PERT-3] Consumer Behaviour.pdfAlifMuhammadFadli
 
Microeconomics Consumer
Microeconomics ConsumerMicroeconomics Consumer
Microeconomics ConsumerRakesh Mehta
 
TüKetici Tercihleri
TüKetici TercihleriTüKetici Tercihleri
TüKetici Tercihlerierkanaktas
 
B-COM PART 1 Eco 2014 r solved
B-COM PART 1 Eco 2014 r solvedB-COM PART 1 Eco 2014 r solved
B-COM PART 1 Eco 2014 r solvedKhalid Aziz
 
Micro part 2.pdf
Micro part 2.pdfMicro part 2.pdf
Micro part 2.pdfayaismailii
 
AE 121 L3 CONSUMER THEORY INTRODUCTION.pdf
AE 121 L3 CONSUMER THEORY INTRODUCTION.pdfAE 121 L3 CONSUMER THEORY INTRODUCTION.pdf
AE 121 L3 CONSUMER THEORY INTRODUCTION.pdfBrendenKapo
 
Price, income &_consumption
Price, income &_consumptionPrice, income &_consumption
Price, income &_consumptionkarun11
 
Mba1014 consumers markets elasticity 040513
Mba1014 consumers markets elasticity 040513Mba1014 consumers markets elasticity 040513
Mba1014 consumers markets elasticity 040513Stephen Ong
 
Week1 consumerbehaviouribbbmicroeconomics-111229235717-phpapp02
Week1 consumerbehaviouribbbmicroeconomics-111229235717-phpapp02Week1 consumerbehaviouribbbmicroeconomics-111229235717-phpapp02
Week1 consumerbehaviouribbbmicroeconomics-111229235717-phpapp02DeShawn A. Larkin
 
Ap microeconomics revew slides
Ap microeconomics revew slidesAp microeconomics revew slides
Ap microeconomics revew slidesStephen Staunton
 

Semelhante a Indifference Curve (20)

Chapter 3 Consumer Behaviour
Chapter 3 Consumer BehaviourChapter 3 Consumer Behaviour
Chapter 3 Consumer Behaviour
 
Chapter 3 consumer behavior
Chapter 3 consumer behaviorChapter 3 consumer behavior
Chapter 3 consumer behavior
 
indifference curve analysis [Autosaved].pptx
indifference curve analysis [Autosaved].pptxindifference curve analysis [Autosaved].pptx
indifference curve analysis [Autosaved].pptx
 
[PERT-3] Consumer Behaviour.pdf
[PERT-3] Consumer Behaviour.pdf[PERT-3] Consumer Behaviour.pdf
[PERT-3] Consumer Behaviour.pdf
 
Microeconomics Consumer
Microeconomics ConsumerMicroeconomics Consumer
Microeconomics Consumer
 
TüKetici Tercihleri
TüKetici TercihleriTüKetici Tercihleri
TüKetici Tercihleri
 
B-COM PART 1 Eco 2014 r solved
B-COM PART 1 Eco 2014 r solvedB-COM PART 1 Eco 2014 r solved
B-COM PART 1 Eco 2014 r solved
 
Indifference curve
Indifference curveIndifference curve
Indifference curve
 
Micro part 2.pdf
Micro part 2.pdfMicro part 2.pdf
Micro part 2.pdf
 
LESSON_02_consumer-beh.pdf
LESSON_02_consumer-beh.pdfLESSON_02_consumer-beh.pdf
LESSON_02_consumer-beh.pdf
 
ch03.ppt
ch03.pptch03.ppt
ch03.ppt
 
AE 121 L3 CONSUMER THEORY INTRODUCTION.pdf
AE 121 L3 CONSUMER THEORY INTRODUCTION.pdfAE 121 L3 CONSUMER THEORY INTRODUCTION.pdf
AE 121 L3 CONSUMER THEORY INTRODUCTION.pdf
 
Quantity Demand Analysis
Quantity Demand AnalysisQuantity Demand Analysis
Quantity Demand Analysis
 
Price, income &_consumption
Price, income &_consumptionPrice, income &_consumption
Price, income &_consumption
 
ME 6.ppt
ME 6.pptME 6.ppt
ME 6.ppt
 
Mba1014 consumers markets elasticity 040513
Mba1014 consumers markets elasticity 040513Mba1014 consumers markets elasticity 040513
Mba1014 consumers markets elasticity 040513
 
Week1 consumerbehaviouribbbmicroeconomics-111229235717-phpapp02
Week1 consumerbehaviouribbbmicroeconomics-111229235717-phpapp02Week1 consumerbehaviouribbbmicroeconomics-111229235717-phpapp02
Week1 consumerbehaviouribbbmicroeconomics-111229235717-phpapp02
 
Ap microeconomics revew slides
Ap microeconomics revew slidesAp microeconomics revew slides
Ap microeconomics revew slides
 
Ge273.u4.pp1
Ge273.u4.pp1Ge273.u4.pp1
Ge273.u4.pp1
 
Chapter 1 What Is Economics
Chapter 1   What Is EconomicsChapter 1   What Is Economics
Chapter 1 What Is Economics
 

Mais de Utkarsh Bisht

office communication
office communicationoffice communication
office communicationUtkarsh Bisht
 
Marketing segmentation
Marketing segmentationMarketing segmentation
Marketing segmentationUtkarsh Bisht
 
Communication through social media.pptx
Communication through social media.pptxCommunication through social media.pptx
Communication through social media.pptxUtkarsh Bisht
 
STRATEGIC PLAN OF INDIAN TOBACCO COMPANY (ITC)
STRATEGIC PLAN OF INDIAN TOBACCO COMPANY (ITC)STRATEGIC PLAN OF INDIAN TOBACCO COMPANY (ITC)
STRATEGIC PLAN OF INDIAN TOBACCO COMPANY (ITC)Utkarsh Bisht
 
internal and external communication
internal and external communicationinternal and external communication
internal and external communicationUtkarsh Bisht
 

Mais de Utkarsh Bisht (12)

Ppt on healthcare
Ppt on healthcarePpt on healthcare
Ppt on healthcare
 
Capital Market
Capital MarketCapital Market
Capital Market
 
Money market
Money marketMoney market
Money market
 
Office management
Office managementOffice management
Office management
 
office communication
office communicationoffice communication
office communication
 
Marketing segmentation
Marketing segmentationMarketing segmentation
Marketing segmentation
 
Communication through social media.pptx
Communication through social media.pptxCommunication through social media.pptx
Communication through social media.pptx
 
leadership
leadershipleadership
leadership
 
Motivation
Motivation Motivation
Motivation
 
STRATEGIC PLAN OF INDIAN TOBACCO COMPANY (ITC)
STRATEGIC PLAN OF INDIAN TOBACCO COMPANY (ITC)STRATEGIC PLAN OF INDIAN TOBACCO COMPANY (ITC)
STRATEGIC PLAN OF INDIAN TOBACCO COMPANY (ITC)
 
internal and external communication
internal and external communicationinternal and external communication
internal and external communication
 
ITC Ltd
ITC LtdITC Ltd
ITC Ltd
 

Último

Report Writing Webinar Training
Report Writing Webinar TrainingReport Writing Webinar Training
Report Writing Webinar TrainingKylaCullinane
 
Ready Set Go Children Sermon about Mark 16:15-20
Ready Set Go Children Sermon about Mark 16:15-20Ready Set Go Children Sermon about Mark 16:15-20
Ready Set Go Children Sermon about Mark 16:15-20rejz122017
 
Unlocking Exploration: Self-Motivated Agents Thrive on Memory-Driven Curiosity
Unlocking Exploration: Self-Motivated Agents Thrive on Memory-Driven CuriosityUnlocking Exploration: Self-Motivated Agents Thrive on Memory-Driven Curiosity
Unlocking Exploration: Self-Motivated Agents Thrive on Memory-Driven CuriosityHung Le
 
Call Girls Near The Byke Suraj Plaza Mumbai »¡¡ 07506202331¡¡« R.K. Mumbai
Call Girls Near The Byke Suraj Plaza Mumbai »¡¡ 07506202331¡¡« R.K. MumbaiCall Girls Near The Byke Suraj Plaza Mumbai »¡¡ 07506202331¡¡« R.K. Mumbai
Call Girls Near The Byke Suraj Plaza Mumbai »¡¡ 07506202331¡¡« R.K. MumbaiPriya Reddy
 
LITTLE ABOUT LESOTHO FROM THE TIME MOSHOESHOE THE FIRST WAS BORN
LITTLE ABOUT LESOTHO FROM THE TIME MOSHOESHOE THE FIRST WAS BORNLITTLE ABOUT LESOTHO FROM THE TIME MOSHOESHOE THE FIRST WAS BORN
LITTLE ABOUT LESOTHO FROM THE TIME MOSHOESHOE THE FIRST WAS BORNtntlai16
 
Jual obat aborsi Jakarta 085657271886 Cytote pil telat bulan penggugur kandun...
Jual obat aborsi Jakarta 085657271886 Cytote pil telat bulan penggugur kandun...Jual obat aborsi Jakarta 085657271886 Cytote pil telat bulan penggugur kandun...
Jual obat aborsi Jakarta 085657271886 Cytote pil telat bulan penggugur kandun...ZurliaSoop
 
Introduction to Artificial intelligence.
Introduction to Artificial intelligence.Introduction to Artificial intelligence.
Introduction to Artificial intelligence.thamaeteboho94
 
Dreaming Marissa Sánchez Music Video Treatment
Dreaming Marissa Sánchez Music Video TreatmentDreaming Marissa Sánchez Music Video Treatment
Dreaming Marissa Sánchez Music Video Treatmentnswingard
 
Zone Chairperson Role and Responsibilities New updated.pptx
Zone Chairperson Role and Responsibilities New updated.pptxZone Chairperson Role and Responsibilities New updated.pptx
Zone Chairperson Role and Responsibilities New updated.pptxlionnarsimharajumjf
 
AWS Data Engineer Associate (DEA-C01) Exam Dumps 2024.pdf
AWS Data Engineer Associate (DEA-C01) Exam Dumps 2024.pdfAWS Data Engineer Associate (DEA-C01) Exam Dumps 2024.pdf
AWS Data Engineer Associate (DEA-C01) Exam Dumps 2024.pdfSkillCertProExams
 
lONG QUESTION ANSWER PAKISTAN STUDIES10.
lONG QUESTION ANSWER PAKISTAN STUDIES10.lONG QUESTION ANSWER PAKISTAN STUDIES10.
lONG QUESTION ANSWER PAKISTAN STUDIES10.lodhisaajjda
 
Lions New Portal from Narsimha Raju Dichpally 320D.pptx
Lions New Portal from Narsimha Raju Dichpally 320D.pptxLions New Portal from Narsimha Raju Dichpally 320D.pptx
Lions New Portal from Narsimha Raju Dichpally 320D.pptxlionnarsimharajumjf
 
Proofreading- Basics to Artificial Intelligence Integration - Presentation:Sl...
Proofreading- Basics to Artificial Intelligence Integration - Presentation:Sl...Proofreading- Basics to Artificial Intelligence Integration - Presentation:Sl...
Proofreading- Basics to Artificial Intelligence Integration - Presentation:Sl...David Celestin
 
SOLID WASTE MANAGEMENT SYSTEM OF FENI PAURASHAVA, BANGLADESH.pdf
SOLID WASTE MANAGEMENT SYSTEM OF FENI PAURASHAVA, BANGLADESH.pdfSOLID WASTE MANAGEMENT SYSTEM OF FENI PAURASHAVA, BANGLADESH.pdf
SOLID WASTE MANAGEMENT SYSTEM OF FENI PAURASHAVA, BANGLADESH.pdfMahamudul Hasan
 
Uncommon Grace The Autobiography of Isaac Folorunso
Uncommon Grace The Autobiography of Isaac FolorunsoUncommon Grace The Autobiography of Isaac Folorunso
Uncommon Grace The Autobiography of Isaac FolorunsoKayode Fayemi
 
Dreaming Music Video Treatment _ Project & Portfolio III
Dreaming Music Video Treatment _ Project & Portfolio IIIDreaming Music Video Treatment _ Project & Portfolio III
Dreaming Music Video Treatment _ Project & Portfolio IIINhPhngng3
 
BEAUTIFUL PLACES TO VISIT IN LESOTHO.pptx
BEAUTIFUL PLACES TO VISIT IN LESOTHO.pptxBEAUTIFUL PLACES TO VISIT IN LESOTHO.pptx
BEAUTIFUL PLACES TO VISIT IN LESOTHO.pptxthusosetemere
 
Digital collaboration with Microsoft 365 as extension of Drupal
Digital collaboration with Microsoft 365 as extension of DrupalDigital collaboration with Microsoft 365 as extension of Drupal
Digital collaboration with Microsoft 365 as extension of DrupalFabian de Rijk
 
BIG DEVELOPMENTS IN LESOTHO(DAMS & MINES
BIG DEVELOPMENTS IN LESOTHO(DAMS & MINESBIG DEVELOPMENTS IN LESOTHO(DAMS & MINES
BIG DEVELOPMENTS IN LESOTHO(DAMS & MINESfuthumetsaneliswa
 

Último (20)

Report Writing Webinar Training
Report Writing Webinar TrainingReport Writing Webinar Training
Report Writing Webinar Training
 
Ready Set Go Children Sermon about Mark 16:15-20
Ready Set Go Children Sermon about Mark 16:15-20Ready Set Go Children Sermon about Mark 16:15-20
Ready Set Go Children Sermon about Mark 16:15-20
 
Unlocking Exploration: Self-Motivated Agents Thrive on Memory-Driven Curiosity
Unlocking Exploration: Self-Motivated Agents Thrive on Memory-Driven CuriosityUnlocking Exploration: Self-Motivated Agents Thrive on Memory-Driven Curiosity
Unlocking Exploration: Self-Motivated Agents Thrive on Memory-Driven Curiosity
 
Call Girls Near The Byke Suraj Plaza Mumbai »¡¡ 07506202331¡¡« R.K. Mumbai
Call Girls Near The Byke Suraj Plaza Mumbai »¡¡ 07506202331¡¡« R.K. MumbaiCall Girls Near The Byke Suraj Plaza Mumbai »¡¡ 07506202331¡¡« R.K. Mumbai
Call Girls Near The Byke Suraj Plaza Mumbai »¡¡ 07506202331¡¡« R.K. Mumbai
 
LITTLE ABOUT LESOTHO FROM THE TIME MOSHOESHOE THE FIRST WAS BORN
LITTLE ABOUT LESOTHO FROM THE TIME MOSHOESHOE THE FIRST WAS BORNLITTLE ABOUT LESOTHO FROM THE TIME MOSHOESHOE THE FIRST WAS BORN
LITTLE ABOUT LESOTHO FROM THE TIME MOSHOESHOE THE FIRST WAS BORN
 
Jual obat aborsi Jakarta 085657271886 Cytote pil telat bulan penggugur kandun...
Jual obat aborsi Jakarta 085657271886 Cytote pil telat bulan penggugur kandun...Jual obat aborsi Jakarta 085657271886 Cytote pil telat bulan penggugur kandun...
Jual obat aborsi Jakarta 085657271886 Cytote pil telat bulan penggugur kandun...
 
Introduction to Artificial intelligence.
Introduction to Artificial intelligence.Introduction to Artificial intelligence.
Introduction to Artificial intelligence.
 
Dreaming Marissa Sánchez Music Video Treatment
Dreaming Marissa Sánchez Music Video TreatmentDreaming Marissa Sánchez Music Video Treatment
Dreaming Marissa Sánchez Music Video Treatment
 
Zone Chairperson Role and Responsibilities New updated.pptx
Zone Chairperson Role and Responsibilities New updated.pptxZone Chairperson Role and Responsibilities New updated.pptx
Zone Chairperson Role and Responsibilities New updated.pptx
 
AWS Data Engineer Associate (DEA-C01) Exam Dumps 2024.pdf
AWS Data Engineer Associate (DEA-C01) Exam Dumps 2024.pdfAWS Data Engineer Associate (DEA-C01) Exam Dumps 2024.pdf
AWS Data Engineer Associate (DEA-C01) Exam Dumps 2024.pdf
 
lONG QUESTION ANSWER PAKISTAN STUDIES10.
lONG QUESTION ANSWER PAKISTAN STUDIES10.lONG QUESTION ANSWER PAKISTAN STUDIES10.
lONG QUESTION ANSWER PAKISTAN STUDIES10.
 
ICT role in 21st century education and it's challenges.pdf
ICT role in 21st century education and it's challenges.pdfICT role in 21st century education and it's challenges.pdf
ICT role in 21st century education and it's challenges.pdf
 
Lions New Portal from Narsimha Raju Dichpally 320D.pptx
Lions New Portal from Narsimha Raju Dichpally 320D.pptxLions New Portal from Narsimha Raju Dichpally 320D.pptx
Lions New Portal from Narsimha Raju Dichpally 320D.pptx
 
Proofreading- Basics to Artificial Intelligence Integration - Presentation:Sl...
Proofreading- Basics to Artificial Intelligence Integration - Presentation:Sl...Proofreading- Basics to Artificial Intelligence Integration - Presentation:Sl...
Proofreading- Basics to Artificial Intelligence Integration - Presentation:Sl...
 
SOLID WASTE MANAGEMENT SYSTEM OF FENI PAURASHAVA, BANGLADESH.pdf
SOLID WASTE MANAGEMENT SYSTEM OF FENI PAURASHAVA, BANGLADESH.pdfSOLID WASTE MANAGEMENT SYSTEM OF FENI PAURASHAVA, BANGLADESH.pdf
SOLID WASTE MANAGEMENT SYSTEM OF FENI PAURASHAVA, BANGLADESH.pdf
 
Uncommon Grace The Autobiography of Isaac Folorunso
Uncommon Grace The Autobiography of Isaac FolorunsoUncommon Grace The Autobiography of Isaac Folorunso
Uncommon Grace The Autobiography of Isaac Folorunso
 
Dreaming Music Video Treatment _ Project & Portfolio III
Dreaming Music Video Treatment _ Project & Portfolio IIIDreaming Music Video Treatment _ Project & Portfolio III
Dreaming Music Video Treatment _ Project & Portfolio III
 
BEAUTIFUL PLACES TO VISIT IN LESOTHO.pptx
BEAUTIFUL PLACES TO VISIT IN LESOTHO.pptxBEAUTIFUL PLACES TO VISIT IN LESOTHO.pptx
BEAUTIFUL PLACES TO VISIT IN LESOTHO.pptx
 
Digital collaboration with Microsoft 365 as extension of Drupal
Digital collaboration with Microsoft 365 as extension of DrupalDigital collaboration with Microsoft 365 as extension of Drupal
Digital collaboration with Microsoft 365 as extension of Drupal
 
BIG DEVELOPMENTS IN LESOTHO(DAMS & MINES
BIG DEVELOPMENTS IN LESOTHO(DAMS & MINESBIG DEVELOPMENTS IN LESOTHO(DAMS & MINES
BIG DEVELOPMENTS IN LESOTHO(DAMS & MINES
 

Indifference Curve

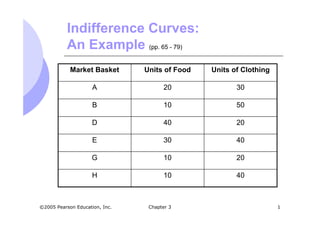
  • 1. Chapter 3 1©2005 Pearson Education, Inc. Indifference Curves: An Example (pp. 65 - 79) 4010H 2010G 4030E 2040D 5010B 3020A Units of ClothingUnits of FoodMarket Basket
  • 2. Chapter 3 2©2005 Pearson Education, Inc. Indifference Curves: An Example (pp. 65 - 79) Graph the points with one good on the x- axis and one good on the y-axis Plotting the points, we can make some immediate observations about preferences The more, the better
  • 3. Chapter 3 3©2005 Pearson Education, Inc. The consumer prefers A to all combinations in the yellow box, while all those in the pink box are preferred to A. Indifference Curves: An Example (pp. 65 - 79) Food 10 20 30 40 10 20 30 40 Clothing 50 G A EH B D
  • 4. Chapter 3 4©2005 Pearson Education, Inc. Indifference Curves: An Example (pp. 65 - 79) Points such as B & D have more of one good but less of another compared to A Need more information about consumer ranking Consumer may decide they are indifferent between B, A and D We can then connect those points with an indifference curve
  • 5. Chapter 3 5©2005 Pearson Education, Inc. •Indifferent between points B, A, & D •E is preferred to any points on the indifference curve U1 •Points on U1 are preferred to H & G Indifference Curves: An Example (pp. 65 - 79) Food 10 20 30 40 10 20 30 40 Clothing 50 U1G D A E H B
  • 6. Chapter 3 6©2005 Pearson Education, Inc. Indifference Curves (pp. 65 - 79) Any market basket lying northeast of an indifference curve is preferred to any market basket that lies on the indifference curve Points on the curve are preferred to points southwest of the curve
  • 7. Chapter 3 7©2005 Pearson Education, Inc. Indifference Curves (pp. 65 - 79) Indifference curves slope downward to the right If they sloped upward, they would violate the assumption that more is preferred to less
  • 8. Chapter 3 8©2005 Pearson Education, Inc. Indifference Curves (pp. 65 - 79) To describe preferences for all combinations of goods/services, we have a set of indifference curves – an indifference map Each indifference curve in the map shows the market baskets among which the person is indifferent
  • 9. Chapter 3 9©2005 Pearson Education, Inc. U2 U3 Indifference Map (pp. 65 - 79) Food Clothing U1 AB D Market basket A is preferred to B. Market basket B is preferred to D.
  • 10. Chapter 3 10©2005 Pearson Education, Inc. Indifference Maps (pp. 65 - 79) Indifference maps give more information about shapes of indifference curves Indifference curves cannot cross Violates assumption that more is better Why? What if we assume they can cross?
  • 11. Chapter 3 11©2005 Pearson Education, Inc. Indifference Maps (pp. 65 - 79) Food Clothing •B is preferred to D •A is indifferent to B & D •B must be indifferent to D but that can’t be if B is preferred to D. A contradiction •Other example: On a map, two contours never cross each other. U1 U1 U2 U2 A B D
  • 12. Chapter 3 12©2005 Pearson Education, Inc. Indifference Curves (pp. 65 - 79) The shapes of indifference curves describe how a consumer is willing to substitute one good for another A to B, give up 6 clothing to get 1 food D to E, give up 2 clothing to get 1 food The more clothing and less food a person has, the more clothing they will give up to get more food
  • 13. Chapter 3 13©2005 Pearson Education, Inc. A B D E G -1 -6 1 1 -4 -2 1 1 Observation: The amount of clothing given up for 1 unit of food decreases from 6 to 1 Indifference Curves (pp. 65 - 79) Food Clothing 2 3 4 51 2 4 6 8 10 12 14 16
  • 14. Chapter 3 14©2005 Pearson Education, Inc. Indifference Curves (pp. 65 - 79) We measure how a person trades one good for another using the marginal rate of substitution (MRS) It quantifies the amount of one good a consumer will give up to obtain more of another good, or the individual terms of trade From a geometric viewpoint, it is measured by the slope of the indifference curve
  • 15. Chapter 3 15©2005 Pearson Education, Inc. Marginal Rate of Substitution (pp. 65 - 79) Food 2 3 4 51 Clothing 2 4 6 8 10 12 14 16 A B D E G -6 1 1 1 1 -4 -2 -1 MRS = 6 MRS = 2 F CMRS Δ Δ−=
  • 16. Chapter 3 16©2005 Pearson Education, Inc. Marginal Rate of Substitution (pp. 65 - 79) From A to B, give up 6 clothing to get 1 food. That is, ΔF=2-1=1, ΔC=10-16 =-6; MRS=- ΔC / ΔF=6 From D to E, , give up 2 clothing to get 1 food; ΔF=4-3=1, ΔC=4-6 =-2; MRS =- ΔC / ΔF= 2
  • 17. Chapter 3 17©2005 Pearson Education, Inc. Marginal Rate of Substitution (pp. 65 - 79) Indifference curves are convex As more of one good is consumed, a consumer would prefer to give up fewer units of a second good to get additional units of the first one. As food becomes less scarce, he/she would give up less of clothing for an additional food. Consumers generally prefer a balanced market basket (preference for varieties; the Doctrine of the Mean in a Chinese classic)
  • 18. Chapter 3 18©2005 Pearson Education, Inc. Marginal Rate of Substitution (pp. 65 - 79) The MRS decreases as we move down the indifference curve Along an indifference curve there is a diminishing marginal rate of substitution. The MRS went from 6 to 4 to 1
  • 19. Chapter 3 19©2005 Pearson Education, Inc. Marginal Rate of Substitution (pp. 65 - 79) Indifference curves with different shapes imply a different willingness to substitute [That is, an indifference map is a concept to represent one’s preference for market baskets.] Two polar cases are of interest Perfect substitutes Perfect complements
  • 20. Chapter 3 20©2005 Pearson Education, Inc. Marginal Rate of Substitution (pp. 65 - 79) Perfect Substitutes Two goods are perfect substitutes when the marginal rate of substitution of one good for the other is constant Example: a person might consider apple juice and orange juice perfect substitutes They would always trade 1 glass of OJ for 1 glass of Apple Juice Find your own examples.
  • 21. Chapter 3 21©2005 Pearson Education, Inc. Consumer Preferences (pp. 65 - 79) Orange Juice (glasses) Apple Juice (glasses) 2 3 41 1 2 3 4 0 Perfect Substitutes
  • 22. Chapter 3 22©2005 Pearson Education, Inc. Consumer Preferences (pp. 65 - 79) Perfect Complements Two goods are perfect complements when the indifference curves for the goods are shaped as right angles Example: If you have 1 left shoe and 1 right shoe, you are indifferent between having more left shoes only Must have one right for one left. That’s why we always get a pair of shoes, not one by one. Find your own examples.
  • 23. Chapter 3 23©2005 Pearson Education, Inc. Consumer Preferences (pp. 65 - 79) Right Shoes Left Shoes 2 3 41 1 2 3 4 0 Perfect Complements
  • 24. Chapter 3 24©2005 Pearson Education, Inc. Consumer Preferences: An Application (pp. 65 - 79) In designing new cars, automobile executives must determine how much time and money to invest in restyling versus increased performance Higher demand for car with better styling and performance Both cost more to improve
  • 25. Chapter 3 25©2005 Pearson Education, Inc. Consumer Preferences: An Application (pp. 65 - 79) An analysis of consumer preferences would help to determine where to spend more on change: performance or styling Some consumers will prefer better styling and some will prefer better performance In recent years we have seen more and more SUVs on our roads. Certainly more owners/drivers prefer SUVs to other styles.
  • 26. Chapter 3 26©2005 Pearson Education, Inc. Consumer Preferences (pp. 65 - 79) The theory of consumer behavior does not required assigning a numerical value to the level of satisfaction. Can you tell the level of satisfaction from your monthly basket? Although ranking of market baskets is good, sometimes numerical value is useful
  • 27. Chapter 3 27©2005 Pearson Education, Inc. Consumer Preferences (pp. 65 - 79) Utility A numerical score (concept) representing the satisfaction that a consumer gets from a given market basket. The concept of utility was born before that of consumer preference. If buying 3 copies of Microeconomics makes you happier than buying one shirt, then we say that the books give you more utility than the shirt
  • 28. Chapter 3 28©2005 Pearson Education, Inc. Utility (pp. 65 - 79) Utility function Formula that assigns a level of utility to individual market baskets If the utility function is U(F,C) = F + 2C A market basket with 8 units of food and 3 units of clothing gives a utility of 14 = 8 + 2(3)
  • 29. Chapter 3 29©2005 Pearson Education, Inc. Utility - Example (pp. 65 - 79) 4 + 2(4) = 1244C 6 + 2(4) = 1446B 8 + 2(3) = 1438A UtilityClothingFoodMarket Basket Consumer is indifferent between A & B and prefers both to C.
  • 30. Chapter 3 30©2005 Pearson Education, Inc. Utility - Example (pp. 65 - 79) Baskets for each level of utility can be plotted to get an indifference curve To find the indifference curve for a utility of 14, we can change the combinations of food and clothing that give us a utility of 14
  • 31. Chapter 3 31©2005 Pearson Education, Inc. Utility - Another Example (pp. 65 - 79) Food 10 155 5 10 15 0 Clothing U1 = 25 U2 = 50 U3 = 100A B C Basket U = FC C 25 = 2.5(10) A 25 = 5(5) B 25 = 10(2.5)
  • 32. Chapter 3 32©2005 Pearson Education, Inc. Utility (pp. 65 - 79) Although we numerically rank baskets and indifference curves, numbers are ONLY for ranking A utility of 4 is not necessarily twice as good as a utility of 2. A umber assigned to a utility level DOES NOT have any meaning. There are two types of rankings Ordinal ranking; Ordinal Utility Function Think of a number on your ticket when you are in a waiting line. Cardinal ranking; Cardinal Utility Function Think of the total number of students in this class.
  • 33. Chapter 3 33©2005 Pearson Education, Inc. Budget Constraints (pp. 79 - 83) Preferences do not explain all of consumer behavior Budget constraints limit an individual’s ability to consume in light of the prices they must pay for various goods and services
  • 34. Chapter 3 34©2005 Pearson Education, Inc. Budget Constraints (pp. 79 - 83) The Budget Line (Constraint) Indicates all combinations of two commodities for which total money spent equals total income We assume only 2 goods are consumed, so we do not consider savings
  • 35. Chapter 3 35©2005 Pearson Education, Inc. The Budget Line (pp. 79 - 83) Let F equal the amount of food purchased, and C is the amount of clothing Price of food = PF and price of clothing = PC Then PFF is the amount of money spent on food, and PCC is the amount of money spent on clothing
  • 36. Chapter 3 36©2005 Pearson Education, Inc. ICPFP CF =+ The Budget Line (pp. 79 - 83) The budget line then can be written: All income is allocated to food (F) and/or clothing (C)
  • 37. Chapter 3 37©2005 Pearson Education, Inc. The Budget Line (pp. 79 - 83) Different choices of food and clothing can be calculated that use all income These choices can be graphed as the budget line Example: Assume income of $80/week, PF = $1 and PC = $2
  • 38. Chapter 3 38©2005 Pearson Education, Inc. Budget Constraints (pp. 79 - 83) $80080G $801060E $802040D $803020B $80400A Income I = PFF + PCC Clothing PC = $2 Food PF = $1 Market Basket
  • 39. Chapter 3 39©2005 Pearson Education, Inc. C F P P F C Slope - 2 1 - == Δ Δ = The Budget Line (pp. 79 - 83) 10 20 A B D E G (I/PC) = 40 Food 40 60 80 = (I/PF)20 10 20 30 0 Clothing
  • 40. Chapter 3 40©2005 Pearson Education, Inc. The Budget Line (pp. 79 - 83) As consumption moves along a budget line from the intercept, the consumer spends less on one item and more on the other The slope of the line measures the relative cost of food and clothing The slope is the negative of the ratio of the prices of the two goods
  • 41. Chapter 3 41©2005 Pearson Education, Inc. The Budget Line (pp. 79 - 83) The slope indicates the rate at which the two goods can be substituted without changing the amount of money spent It represents exchange ratio or terms of trade in market places. We can rearrange the budget line equation to make this more clear
  • 42. Chapter 3 42©2005 Pearson Education, Inc. The Budget Line (pp. 79 - 83) YX P P P I YPXPI YPXPI Y X Y YX YX =− =− +=