
Recomendados
Recomendados
Mais conteúdo relacionado
Destaque
Destaque (20)
Semelhante a Puddles
Semelhante a Puddles (20)
Último
Último (20)
Puddles
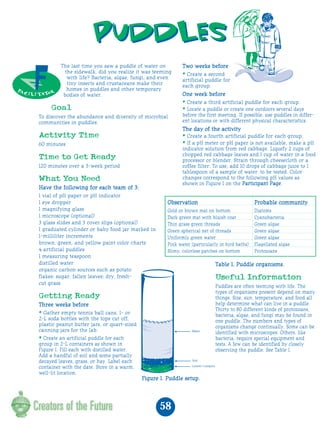
- 1. puddles The last time you saw a puddle of water on Two weeks before the sidewalk, did you realize it was teeming with life? Bacteria, algae, fungi, and even • Create a second artificial puddle for tiny insects and crustaceans make their each group. fa c homes in puddles and other temporary i li tato r bodies of water. One week before • Create a third artificial puddle for each group. Goal • Locate a puddle or create one outdoors several days To discover the abundance and diversity of microbial before the first meeting. If possible, use puddles in differ- communities in puddles. ent locations or with different physical characteristics. The day of the activity Activity Time • Create a fourth artificial puddle for each group. 60 minutes • If a pH meter or pH paper is not available, make a pH indicator solution from red cabbage. Liquefy 2 cups of chopped red cabbage leaves and 1 cup of water in a food Time to Get Ready processor or blender. Strain through cheesecloth or a 120 minutes over a 3-week period coffee filter. To use, add 10 drops of cabbage juice to 1 tablespoon of a sample of water to be tested. Color What You Need changes correspond to the following pH values as shown in Figure 1 on the Participant Page. Have the following for each team of 3: 1 vial of pH paper or pH indicator 1 eye dropper Observation Probable community 1 magnifying glass Gold or brown mat on bottom Diatoms 1 microscope (optional) Dark green mat with bluish coat Cyanobacteria 3 glass slides and 3 cover slips (optional) Thin grass green threads Green algae 1 graduated cylinder or baby food jar marked in Green spherical net of threads Green algae 1-milliliter increments Uniformly green water Green algae brown, green, and yellow paint color charts Pink water (particularly in bird baths) Flagellated algae 4 artificial puddles Slimy, colorless patches on bottom Protozoans 1 measuring teaspoon distilled water Table 1. Puddle organisms. organic carbon sources such as potato flakes; sugar; fallen leaves; dry, fresh- Useful Information cut grass Puddles are often teeming with life. The types of organisms present depend on many Getting Ready things. Size, sun, temperature, and food all Three weeks before help determine what can live in a puddle. Thirty to 80 different kinds of protozoans, • Gather empty tennis ball cans, 1- or bacteria, algae, and fungi may be found in 2-L soda bottles with the tops cut off, one puddle. The numbers and types of plastic peanut butter jars, or quart-sized organisms change continually. Some can be canning jars for the lab. identified with microscopes. Others, like • Create an artificial puddle for each bacteria, require special equipment and group in 2-L containers as shown in tests. A few can be identified by closely Figure 1. Fill each with distilled water. observing the puddle. See Table 1. Add a handful of soil and some partially decayed leaves, grass, or hay. Label each container with the date. Store in a warm, well-lit location. Figure 1. Puddle setup. 58
- 2. Suggestions to Modify the Activity for How to Start the Activity Those Who Are Exceptional Take the group to an outdoor puddle. Have them list the Specific modifications for this activity are found here. For features of the puddle. How did the water get there? Why is it common considerations when modifying activities for excep- still there? What lives in a puddle? What evidence of living tional participants, see page V of the Introduction. things do they see? How many different kinds of living things do they think can be found in this puddle? What limits the Blind or Visually Impaired variety or number of organisms found in a puddle? How will • Emphasize the discussions that are outlined in Useful this puddle change over time? Is this puddle different from Information and Introducing the Activity. They will be others? What factors affect living things or communities in very beneficial to the participant for comprehension of the puddles? What could they do to learn more about puddle material and purpose. organisms and how puddles change over time? • Emphasize that group discussions should include specific and detailed observations that use terms such as “fiery red” or Let’s Make a Hypothesis “green grass.” When discussing pH levels, refer often to the Discuss the following questions to help guide the partici- colors. Individuals who are blind have a good understanding pants to make hypotheses. of color and will appreciate the detailed observations. • Construct tactile diagrams of organisms found in the • What might affect the growth of microorganisms in our artificial puddles? puddles. Include detailed descriptions of each organism. • What do plant-like microorganisms need to live? Deaf or Hard-of-Hearing • What might bacteria feed on in natural environments? • See the General Modifications for Blind or Visually • What are some sources of carbon that we can provide for bacteria? Impaired listed in the Introduction, page V. • How do microorganisms get into puddles? Mobility Impaired • Locate puddles outside in accessible areas. What the Data Mean • Show slides of the microscopic view of organisms if the participant cannot comfortably work at the microscope 10 station. A magnifying glass is also an excellent adaptation. Physically Impaired 8 • Wrap an elastic band around the jar to provide the partici- pant better grasp. The larger the mouth is on the jar, the easi- 6 er it will be to manipulate and transfer material into it. • Show slides of microscopic views of the organisms if the 4 microscope station is not comfortable for the participant. A magnifying glass is also an excellent adaptation. 2 Cognitively Impaired • See the General Modifications for Cognitively Impaired 0 1 2 3 4 listed in the Introduction, page V. Figure 2. Graph of pH of artificial puddles over 3 weeks. For More Information pH decreased, possibly due to microbial activity. As microbes respire, they release carbon dioxide that reacts with water to Hampton, C.D. & C.H. (1994). Collecting and observing form carbonic acid, lowering pH. Acidic waste products from Protozoa. Classroom Creature Culture. Arlington, VA: NSTA microbial decay may also build up from decaying vegetation. Publications, 23-25. Ingram, M. (1993). Bottle Biology. Department of Plant 9 Pathology, College of AgriScience Institute: University of Wisconsin-Madison. 8 Kelly, S.G. & Post, F.J. (1989). Basic Microbiology Techniques. 7 Belmont, CA: Star Publishing Company, 12. Niederlehner, B.R. & Cairns, J. Puddles (Unpublished manu- 6 script). MINTS. Virginia Tech Museum of Natural History: 5 Virginia Tech, Blacksburg, VA. 4 Palmer, S. & Cairns, J. Microbes in the World Around Us: A Laboratory Guide for the Study of Microbes in Environmental 3 Samples (Unpublished manuscript). MINTS. Virginia Tech 2 Museum of Natural History, Virginia Tech, Blacksburg, VA. 1 0 0 1 2 3 Figure 3. Graph of turbidity or clearness in artificial puddles over 3 weeks. Turbidity was high after adding soil. As material settled, turbidity decreased in Week 1. As microorganisms grew and reproduced, turbidity increased. 59
- 3. puddles Questions to Think pa About rt ici pa n t Is there life in puddles? We have all splashed 4. Collect a sample of water from the middle of each through puddles after rainy days. Some are tem- artificial puddle. If the sample is very turbid, or porary and last only a few hours while others last cloudy, do serial dilutions until the water appears much longer. Does anything live in these puddles? If so, clear. The number of times the solution needs to be what? What environmental factors might affect what diluted before it appears clear is your measure of kind or how many organisms can live in a puddle? How turbidity. Use a graduated cylinder or baby food jar. do puddles change over time? How do organisms colo- Remove 1 part water from the puddle and add 1 part nize, or end up in puddles? How can you design artifi- distilled water and shake to mix. If the solution is cial puddles to answer these questions? still cloudy pour off half and add another 1 part dis- tilled water. Repeat until the solution is clear. If the sample requires 3 dilutions before it becomes clear, Safety Notes record a “3” as a measure of turbidity. Graph your • Food, drinks, and gum are not allowed. results. What factors might cause the water to • Wash hands at the completion of the activity. appear cloudy? Did the puddles’ turbidity change over time? Graph your results. • Avoid touching your mouth or eyes after handling water from puddles. 5. Use an eye dropper to remove a sample of water from each puddle. If a microscope is available, place What to Do a drop of water on a slide and count the number of organisms and/or different kinds of organisms in 1. Study your artificial puddles. Line them up accord- the field of view at low power. Figure 2 shows some ing to the dates they were created. How are they organisms that you may see. If no microscope is similar to the puddle you observed outdoors? How available, count the number of larger organisms you are they different? observe in a sample of known volume. Put this sam- 2. Use the paint color chart to record the colors of ple in the bottom of a baby food jar or a dish for each artificial puddle. Record the color at the bottom closer examination. Be sure to examine and sample as well as the middle of each water column. What do different parts of each puddle–the surface, middle, the colors suggest about the number or variety of and bottom of the water column. Did the populations organisms in the puddles? Can you determine what change over time? What factors caused these causes the colors on the bottom? Did the puddles’ changes? If available, use keys and field guides to colors change over time? identify the organisms. If you do not have keys, sketch each kind of organism and make your own 3. Use pH paper or the red cabbage indicator to classification guide. determine the pH of each puddle. See Figure 1 for red cabbage pH indicator colors. Graph your results. What might affect the pH in a puddle? Figure 1. Red cabbage pH indicator colors. 60
- 4. Diatoms What Did You Find Out By Doing the Activity? Before doing “Puddles,” did you know: • what can be found in puddles besides water? • how water gets into puddles? Cyanobacteria • how puddles can support life? From this activity, did you discover: • what different types of living organisms exist in puddles? • what factors affect an organisms survival in pud- dles? Green algae • how the living organisms in puddles can be iden- tified? • if the living organisms in different puddles vary? • how living organisms in the same puddle can change over time? • how you could create a community of living organisms in a puddle? Flagellated algae • what products you use that could reach living organisms in puddles and alter their ability to sur- vive? Protists Figure 2. Sketches of common organisms found in puddles. 6. What questions come from your results? To what other topics is this activity related? What did you learn from this activity? How does this activity relate to your life? What factors influence the populations of microorganisms? 7. How can you learn more about puddles? How can you learn more about what affects the populations of microorganisms in them? Could you study puddles out- doors? What factors could you manipulate to alter microbial populations? What factors might favor the growth of bacteria? of algae? of protozoans? Could you design an experiment to test a new hypothesis? What procedure would you use? What would you use for a control? What variables are important? How many trials would you include? What will you measure? Could you show your results in a graph? 61