Revenues and revenue curves
•Transferir como PPTX, PDF•
44 gostaram•39,992 visualizações

this is first attempt to share my slides on online media. Please suggests me how can i improve my presentation.

Recomendados
Mais conteúdo relacionado
Mais procurados
Mais procurados (20)
Semelhante a Revenues and revenue curves
Semelhante a Revenues and revenue curves (20)
Último
Último (20)
Revenues and revenue curves
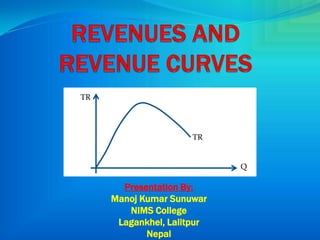
- 1. TR TR Q Presentation By: Manoj Kumar Sunuwar NIMS College Lagankhel, Lalitpur Nepal
- 2. General concept of total revenue, average revenue and marginal revenue. Derivation of TR, AR and MR Derivation of TR, AR and MR under perfect competitive and monopoly market structure. Relationship between TR, AR and MR.
- 3. Total amount of money value received by a firm or an industry by selling the goods and services is known as the revenue. For example if a firm produce 100 units of commodity per day and sells it at Rs.20 per unit then its total revenue is Rs. 2000 per day. The revenue can be classified into three category such as ; a. Total Revenue (TR). b. Average Revenue (AR). c. Marginal Revenue (MR). Each curve have different characteristics for different market structure.
- 4. Here we discuss characteristics of TR, AR and MR under perfect competitive and monopoly market structure. GENERAL CONCEPT OF TR, AR AND MR A. Total Revenue (TR): Total sum of money value received from the sales of various quantities of output of product produced during a given period of time at certain price level is known as total revenue of a firm or an industry for that time period. It can be obtained by multiplying total output sold (Q) by the corresponding price (P). i.e. TR = P × Q
- 5. B. Average Revenue (AR): Per unit revenue of a product is known as average revenue. We obtain AR by dividing (TR) by the corresponding quantity sold (Q). i.e. C. Marginal Revenue (MR): An additional amount of money received from the sells of one additional unit of a product or output. i.e.
- 6. Where, TRn is he total revenue obtained from the sales of nth unit of output and TRn-1 is the total revenue obtained from the sales of (n-1) th unit of output. In other words, marginal revenue is the change in total revenue due to change in the quantity sold on the market by one unit. i.e. Where, Δ = change Δ TR = change in total revenue Δ Q = change in quantity sold in the market.
- 7. Revenue Curves Under Perfect Competition Market Perfect competition is a market structure in which a large number of sellers sell the homogeneous product to a large number of buyers. There are large number of buyers and sellers so that no one individual buyer or seller can influence the smooth functioning of the market. That means neither individual seller nor buyer can change the price of the product. In this structure of the market firms are the price taker not price makers.
- 8. In perfectly competitive market a firm or an industry sell its output at given price. The price is determined by the market , i.e. the intersection of market demand and market supply curves . The total, average and marginal revenue of a competitive firm are illustrated as follows; a. Total Revenue (TR): Total amount of money value received by a producer by selling various quantities of the product in the market at constant price is known as TR in case of perfectly competitive market.
- 9. TR is obtained by multiplying amount of output sold by the given price determined in the market by intersection of market demand and market supply curve. i.e. TR = Q × P Where, Q= amount of product sale P= Market Price which is constant. TR increases at the same rate because, every additional unit of the commodity is sold at the same price. In this type of market firms are price taker not price maker. It can be explained with the help of following table and graph.
- 10. Total Revenue Under Perfect Competition Units of Output (Q) Per Unit Price (P) Total Revenue (TR) 0 10 0 1 10 10 2 10 20 3 10 30 4 10 40 5 10 50 • In above table total revenue (TR ) is obtained by multiplying output (Q) and Price (P). When output is zero TR also zero. TR is Rs. 10, 20, 30, 40 and 50 for the 1, 2, 3, 4 and 5 units of sale respectively, where price is constant at Rs. 10.
- 11. In the above table as increase in sell of output total revenue also increasing, but the rate of increase in total revenue is constant. TR TR Graphically, 50 40 30 20 10 O Output 1 2 3 4 5 6
- 12. b. Average Revenue (AR): Per unit revenue obtained by a seller by selling product at market price in the market in certain time period is known as AR for that time period of that seller or producer. It is calculated by dividing total revenue (TR) by corresponding quantity sold (Q) in the market at market price (P). i.e. AR = TR/Q i.e. AR =( P×Q)/Q i.e. AR = P Therefore, another name of AR is the average market price of the product. Since, price is constant in perfect competition market and hence, AR is also constant .
- 13. It can be explained with the help of following table; Average Revenue Under Perfect Competition Units of Per Unit Price Total Revenue Average Revenue Output (Q) (P) (TR) (AR) = TR/Q 0 10 0 - 1 10 10 10 2 10 20 10 3 10 30 10 4 10 40 10 5 10 50 10
- 14. In the above table as increase in sells of output of the product Average Revenue (AR) remains constant i.e. Rs. 10 for first unit to fifth unit of output. Above information shows that AR is constant and equal to the price for all level of output. In the following figure average revenue curve is found by plotting the combination of points of the quantity sold on the horizontal axis and corresponding AR on the vertical axis. AR curve is a horizontal straight line at the different level of output sold at given price. It shows that AR is constant and equal to the price for all level of output, i.e. AR = P.
- 15. Graphically, AR 50 40 30 20 10 AR O Output 1 2 3 4 5 6
- 16. c. Marginal Revenue (MR): Marginal revenue is the change in total revenue in response to the change in quantity sold. It is calculated by dividing the change in total revenue (ΔTR) by the change in quantity sold (ΔQ). In case of perfectly competitive market marginal revenue (MR) remains constant and equal to the market price for all level of output sold, i.e. MR = P. It can be explained with the help of following table and graph.
- 17. Marginal Revenue in Perfect Competition Units of Per Unit Price Total Revenue Average Marginal Output (Q) (P) (TR) = P × Q Revenue Revenue (AR) = TR/Q (MR) = ΔTR/ΔQ 0 10 0 - - 1 10 10 10 10 2 10 20 10 10 3 10 30 10 10 4 10 40 10 10 5 10 50 10 10 •In the above table as increase in output sold at market price TR increases at constant rate . But MR remains constant i.e. Rs. 10. which is equal to price. •Form above table we conclude that Price, AR and MR are same i.e. Rs. 10. that means P = AR = MR.
- 18. Graphically, MR 50 40 30 20 10 MR O Output 1 2 3 4 5 6
- 19. In the above figure MR is the slope of the TR. The MR curve is found by plotting the MR on y-axis and quantity sold on x-axis. The MR curve is also horizontal to the x-axis as of the AR. It shows that AR and MR are overlapped and equal to the price in perfectly competitive market. Relationship between TR, AR and MR under perfectly competitive market TR increases at the rate of AR or MR for all level of sales. AR and MR are equal and constant for all level of sales. AR and MR both are equal to the price.