1. 1. Scan Conversion
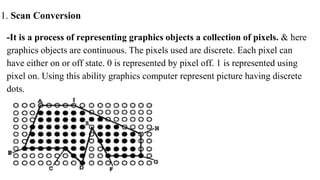
-It is a process of representing graphics objects a collection of pixels. & here
graphics objects are continuous. The pixels used are discrete. Each pixel can
have either on or off state. 0 is represented by pixel off. 1 is represented using
pixel on. Using this ability graphics computer represent picture having discrete
dots.
2.
3. Advantage of developing algorithms for scan conversion
1. Algorithms can generate graphics objects at a faster rate.
2. Using algorithms memory can be used efficiently.
3. Algorithms can develop a higher level of graphical objects.
4. The process of converting is also called as rasterization.
● It is converting a vector image (a mathematically defined image of points
and curves) to a raster image (a picture composed of discrete pixels).
● Rasterization is commonly used in real-time 3D graphics processing to
convert images quickly for display on a computer monitor.
5. Examples of objects which can be scan converted
1. Point
2. Line
3. Sector
4. Arc
5. Ellipse
6. Rectangle
7. Polygon
8. Characters
9. Filled Regions
6. 1.Scan Converting a Straight Line
A straight line may be defined by two endpoints & an equation. The equation of
the line is used to determine the x, y coordinates of all the points that lie between
these two endpoints.
7. Equation of a straight line, y = mx + b
Using the equation of a straight line, y = mx + b where
m = = (y2-y1) / (x2-x1)
b = the y intercept
8.
9. Properties of Good Line Drawing Algorithm
1. Line should appear Straight: We must appropriate the line by
choosing addressable points close to it. If we choose well, the line will
appear straight, if not, we shall produce crossed lines.
10. 2. Lines should terminate accurately: Unless lines are plotted accurately, they
may terminate at the wrong place.
3. Lines should have constant density: Line density is proportional to the no. of
dots displayed divided by the length of the line.
To maintain constant density, dots should be equally spaced.
11. 4. Line density should be independent of line length and angle
5. Line should be drawn rapidly
12. Algorithm for line Drawing
1. DDA (Digital Differential Analyzer)
2. Bresenham's Algorithm
13. 1) DDA (Digital Differential Analyzer)
-DDA stands for Digital Differential Analyzer. It is an incremental method of scan conversion of
line. In this method calculation is performed at each step but by using results of previous steps.
-Here difference in pixel point is to be analyzed according to that line can be drawn.
y=mx+b
m=(y2-y1)/(x2-x1)
m= dy/dx ……... (DDA algorithm is based on calculation of these values dy & dx)
14.
15. DDA Algorithm
Step1: Start Algorithm
Step2: Declare x1,y1,x2,y2,dx,dy,x,y as integer variables...(here we have declared
all values that requires for calculations)
Step3: accepting value of x1,y1,x2,y2.(means we are accepting our starting &
ending points of line )
Step4: Calculate dx = x2-xl (here we are find out horizontal difference between end points)
Step5: Calculate dy = y2-y1 (here we are find out vertical difference between end points)
Step6: If ABS (dx) > ABS (dy)
Then step = abs (dx) (here we are finding value of step)
else step = abs (dy)
16. Step7: x inc= dx/step (here we are calculating value of x increment )
yinc= dy / step (here we are calculating value of y increment )
assign x = x1
assign y = y1
Step 8: Set pixel (x, y) (setting values of x & y pixel)
Step 9: x = x + x inc (here we are goint to find out new value for x & we know value of x increment & old value of x already)
y = y + yinc (here we are goint to find out new value for y & we know value of y increment & old value of y already)
Set pixels (Round (x), Round (y)).......(here setting new values of x & y pixel, & we are
rounding the values becoz for calculation purpose we are using original value but for display
purpose we are rounding values)
Step 10: Repeat step 9 until x = x2
Step 11: End Algorithm.
17. Example 1 : Plot a line using DDA line generation algorithm from p1 (1,1) to p2 (5,3)
Solution : here x1=1, y1=1 & x2=5, y2=3
Dx = (x2-x1) = (5-1) = 4
Dy = (y2-y1) = (3-1) = 2
as |Dx| > |Dy|
step = abs(Dx) = 4
x inc= dx/step =4/4 = 1
y inc= dy / step = 2/4 = 0.5
first point we know that is (x1,y1) so plot it
Xnew = Xold +x inc Ynew = Yold + y inc
Xnew =1 + 1=2 Ynew = 1 + 0.5 = 1.5
Xnew = 2 Ynew = 2
18. For next iteration
xnew = Xold + x inc Ynew = Yold +y inc
Xnew = 2 + 1 Ynew = 1.5 + 0.5
Xnew = 3 Ynew = 2
after calculating values ,after 5 loops , we will get line as using plot values
values as below
I X Y Plot
1. 1 1 (1,1)
2. 2 2 (2,2)
3. 3 2 (3,2)
4. 4 3 (4,3)
5. 5 3 (5,3)
19. Example 2 : Plot a line using DDA line generation algorithm from p1 (5,8) to p2 (9,5)
Solution : here x1 = 5, y1 = 8 & x2 = 9, y2 = 5
Dx = (x2-x1) = (9-5) = 4
Dy = (y2-y1) = (5-8) = -3
as |Dx| > |Dy|
step = abs(Dx) = 4
x inc= dx/step =4/4 = 1
y inc= dy / step = -3/4 = -0.75
First point we know that is (x1,y1) so plot it
Xnew = Xold +x inc Ynew = Yold + y inc
Xnew =5 + 1=6 Ynew = 8 + (-0.75) = 7.25
Xnew = 6 Ynew = 7
20. For next iteration
xnew = Xold + x inc Ynew = Yold +y inc
Xnew = 6 + 1 Ynew = 7.25 +(- 0.75)
Xnew = 7 Ynew = 6.50 = 7
after calculating values ,after 5 loops , we will get line as using plot values
values as below
I X Y Plot
1. 5 8 (5 ,8)
2. 6 7 (6 ,7)
3. 7 7 (7 ,7)
4. 8 6 (8 ,6)
5. 9 5 (9 ,5)
21. Advantage:
-It is a faster method
-It allows us to detect the change in the value of x and y ,so plotting of same point twice is
not possible.
-It is an easy method because each step involves just two additions.
Disadvantage:
-Rounding off operations and floating point operations consumes a lot of time.