Baixar para ler offline

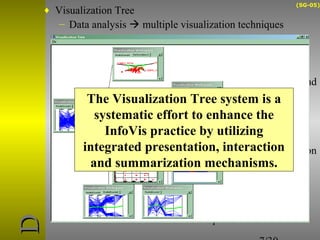
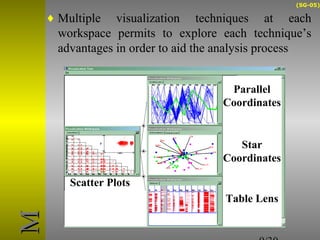
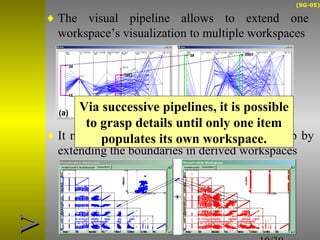
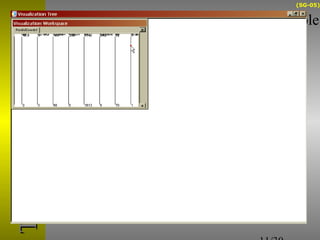
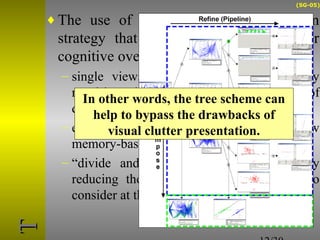
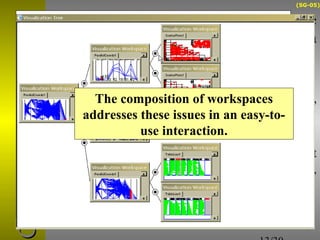
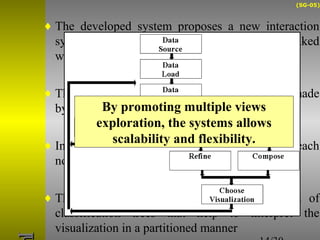
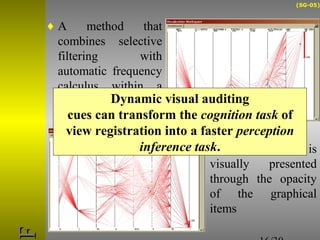
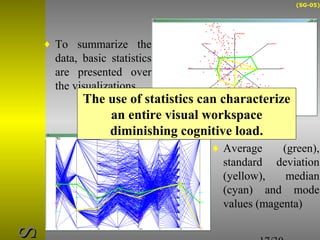
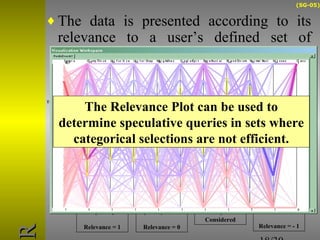
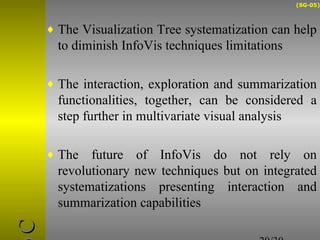


O documento descreve o sistema Visualization Tree, que utiliza uma abordagem baseada em árvore para explorar múltiplas técnicas de visualização ligadas e reduzir sobrecarga cognitiva. O sistema permite a composição flexível de visualizações, interação para criar árvores de classificação e recursos de sumarização como estatísticas e relevância de pontos de dados.