SlideShare uma empresa Scribd logo
I
INTEGRATION OF IOT FOR ENHANCED
GAS AND OIL MONITORING IN
INDUSTRIAL ENVIRONMENT
A PROJECT REPORT
Submitted by
M. KARTHIKEYAN (720320104013)
S. PRANESH (720320104025)
K. RAGUL (720320104028)
R. VIMAL ANAND (720320104309)
in partial fulfillment for the award of the degree
of
BACHELOR OF ENGINEERING
in
COMPUTER SCIENCE AND ENGINEERING
AKSHAYA COLLEGE OF ENGINEERING AND TECHNOLOGY
COIMBATORE - 642109
ANNA UNIVERSITY: CHENNAI 600 025
MAY 2024
II
ANNA UNIVERSITY: CHENNAI 600 025
BONAFIDE CERTIFICATE
Certified that this project report “INDUSTRIAL POLLUTION MONITORING
USING IOT” is the Bonafide work of “M. KARTHIKEYAN (720320104013),
S.PRANESH (720320104025), K.RAGUL (720320104028), R.VIMALANAND
(720320104040)” who carried out the project work under my supervision.
SIGNATURE
Mrs. M. Nisha, M.E., (Ph.D.),
HEAD OF THE DEPARTMENT
Assistant Professor (SG),
Department Of Computer Science
and Engineering,
Akshaya college of Engineering and
Technology, Kinathukadavu,
Coimbatore-642109.
SIGNATURE
Mr. V. Balamurugan, M.E.,
SUPERVISOR
Assistant Professor (Sr.G),
Department Of Computer Science
and Engineering,
Akshaya college of Engineering and
Technology, Kinathukadavu,
Coimbatore-642109
Submitted for the Anna University project viva-voce exam, held on ………………
INTERNAL EXAMINAR EXTERNAL EXAMINAR
III
ACKNOWLEDGEMENT
The success of a project depends greatly on its terms and the cooperation it
receives. We take this opportunity to express our gratitude and sincere thanks to
everyone who assisted us in our project. First and foremost, we would like to thank
our management for the excellent infrastructure, facilities, and support provided for
the successful implementation of the project
We are indebted to the Director, Dr. K. THANUSHKODI, M.Sc., Ph.D., for
hiscontinuous motivation, inspiring words and guidance throughout this project.
We express our sincere thanks to the Joint Director, Dr. N. SUGUNA, M.E.,
Ph.D., for her valuable guidance and support.
We express our heartfelt thanks and deep sense of gratitude to the
Principal,
Dr. R. RAVINDRAN, M.Tech., Ph.D., for the continuous encouragement, guidance
and support.
We express our sincere thanks to the Vice Principal Dr. K. SIVASANKARI,
M.E., PhD., for her insightful comments and practical advice.
Our special thanks to Mrs. M. NISHA, M.E., (Ph.D.), Assistant Professor (S.G)
and Head of the Department of Computer Science and Engineering for her valuable
guidance, continuous support and suggestions to improve the quality of the project
work.
We express our sincere thanks to our guide
Mr. V. BALAMURUGAN, M.E., Assistant Professor (Sr.G) , Department of
Computer Science and Engineering, for her valuable guidance, insightful comments
and continuous support to carry out the project work.
Our sincere thanks to our faculty members, family members and friends for their
support and motivation to carry out the project successfully.
IV
ABSTRACT
The Industrial Pollution Monitoring Using IoT project aims to address the
pressing environmental concerns related to industrial pollution by leveraging the
capabilities of Internet of Things (IoT) technology. Industrial activities contribute
significantly to air, water, and soil pollution, posing risks to human health and
ecosystems. Therefore, effective monitoring and management of industrial
pollution are essential for sustainable development and environmental protection.
This project proposes the deployment of IoT-based sensor networks in industrial
facilities to continuously monitor key pollutants, such as particulate matter (PM),
volatile organic compounds (VOCs), sulfur dioxide (SO2), nitrogen oxides (NOx),
carbon monoxide (CO), and ozone (O3). These sensors will be strategically
installed at various points within industrial premises to capture real-time data on
pollutant concentrations and emission levels. The collected data will be
transmitted wirelessly to a central IoT platform for aggregation, analysis, and
visualization. Advanced analytics techniques, including machine learning
algorithms, will be employed to process the data and identify patterns, trends, and
anomalies in pollutant levels. Decision support systems will provide actionable
insights to industrial stakeholders, enabling proactive pollution management and
mitigation strategies. Furthermore, the IoT platform will facilitate real-time
monitoring and remote access to pollution data for regulatory authorities,
environmental agencies, and the general public. Transparency and accountability
will be enhanced through data sharing and public disclosure of pollution
information, fostering community engagement and environmental stewardship.
The Industrial Pollution Monitoring Using IoT project aims to promote
environmental sustainability, improve public health, and drive responsible
industrial practices through the effective monitoring and management of pollution
emissions.
V
TABLE OF CONTENTS
CHAPTER TITLE PAGE
NO
ABSTARCT
NO
v
LIST OF FIGURE viii
LIST OF ABBREVIATIONS ix
PROBLEM STATEMENT x
1 INTRODUCTION 1
1.1 Objectives 2
2 LITERATURE REVIEW 4
3 EXISTING SYSTEM 10
3.1 Introduction 10
3.2 Working 10
3.3 Drawbacks 11
4 PROPOSED SYSTEM 12
4.1 Introduction 12
4.2 Block Diagram 13
4.3 Methodology 15
4.4 Advantages 16
5 HARDWARE REQUIREMENT 17
5.1 Noise Sensor 17
5.2 Temperature Sensor 19
5.3 Humidity Sensor 20
5.4 Gas Sensor 22
5.5 Ultra Sonic Sensor 23
5.6 Bread Board Power Supply 25
5.7 Jumper Wires 26
VI
5.8 9V Battery 27
5.9 Microcontroller Arduino UNO 29
5.10 LED Display 30
5.11 Buzzer 31
5.12 I2C 32
6 RESULT AND DISCUSSION 34
6.1 Explanation 34
6.2 Screenshots 35
7 CONCLUSION AND FUTURE ENHANCEMENT 36
7.1 Conclusion 36
7.2 Future Enhancement 37
APPENDIX 39
REFERENCES 52
VII
LIST OF FIGURES
S.NO FIGURE PAGE NO
13
4.1 Block Diagram
4.2 Pin Diagram Of Arduino Uno 14
5.1 Noise Sensor 17
5.2 Temperature Sensor 19
5.3 Humidity Sensor 20
5.4 Gas Sensor 22
5.5 Ultra Sonic Sensor 23
5.6 Bread Board Power Supply 25
5.7 Jumper Wires 26
5.8 9V Battery 27
5.9 Microcontroller Arduino UNO 29
5.10 LED Display 30
5.11 Buzzer 31
5.12 I2C 32
34
6.1 Implementation
35
6.2 Result
VIII
LIST OF ABBREVIATION
ABBREVIATION DESCRIPTION
GSM Global System for Mobile Communication
IoT Internet of Things
LED Light-Emitting Diodes
I2C Inter Integrated Circuit
PPE Personal Protective Equipment
PID Photoionization Detectors
VOC Volatile Organic Compounds
SMS Short Message Service
IX
PROBLEM STATEMENT
The project aims to implement IoT technology for real-time gas monitoring
in industrial settings, addressing the need for improved safety and efficiency. By
integrating sensors with a centralized data analytics platform, the system will
provide timely insights and alerts to prevent potential hazards and optimize
operational processes.
1
CHAPTER 1
INTRODUCTION
Industrial activities play a crucial role in driving economic growth and
technological advancement, but they also pose significant challenges to
environmental sustainability and public health due to the release of pollutants into
the air, water, and soil. Industrial pollution, resulting from processes such as
manufacturing, energy production, and waste disposal, has become a pressing
global concern with far-reaching environmental and socioeconomic impacts. The
introduction of the Industrial Pollution Monitoring Using IoT project addresses
this challenge by leveraging the transformative potential of Internet of Things
(IoT) technology to monitor and manage industrial pollution effectively.
By deploying IoT-based sensor networks in industrial facilities, this project
aims to provide real-time monitoring of key pollutants and empower stakeholders
with actionable insights for pollution control and mitigation. This introduction sets
the stage for understanding the significance of industrial pollution, the limitations
of traditional monitoring methods, and the potential of IoT technology to
revolutionize pollution monitoring and management. It highlights the need for
proactive and data-driven approaches to address industrial pollution, protect the
environment, and safeguard public health. Additionally, it outlines the objectives,
scope, and expected outcomes of the Industrial Pollution Monitoring Using IoT
project, laying the groundwork for further exploration and discussion in the
subsequent sections.
2
1.1 OBJECTIVE
Objectives for the project "Industrial Pollution Monitoring Using IoT":
Develop and deploy IoT-based sensor networks to enable real-time monitoring
of key pollutants emitted by industrial facilities, including particulate matter (PM),
volatile organic compounds (VOCs), sulfur dioxide (SO2), nitrogen oxides (NOx),
carbon monoxide (CO), and ozone (O3). Collect and aggregate pollution data
from distributed sensors deployed at various points within industrial premises,
ensuring comprehensive coverage and accurate measurement of pollutant
concentrations and emission levels. Implement advanced analytics techniques,
including machine learning algorithms, to process and analyze the collected data,
identify patterns, trends, and anomalies in pollutant levels, and visualize the
results in an intuitive and informative manner. Develop decision support systems
that provide actionable insights to industrial stakeholders, regulatory authorities,
and environmental agencies, enabling proactive pollution management and
mitigation strategies based on real-time monitoring data. Enable remote access
and monitoring of pollution data through an IoT platform, allowing
stakeholders to access real-time data, historical trends, and predictive analytics
from anywhere, anytime, via web-based interfaces or mobile applications. Promote
transparency and accountability in pollution management by sharing pollution
data with the public, regulatory agencies, and environmental organizations,
fostering community engagement and environmental stewardship. Ensure
alignment with existing regulatory frameworks and environmental standards
governing industrial pollution, facilitating compliance monitoring, reporting, and
enforcement activities. Design the monitoring system to be scalable and adaptable
to different industrial settings, allowing for easy deployment, expansion, and
customization to meet the specific requirements and challenges of diverse
industries and regions. Conduct environmental impact assessments based on the
collected pollution data, evaluate the effectiveness of pollution control measures,
3
and identify areas for improvement to minimize environmental harm and enhance
sustainability. Provide training and capacity-building initiatives to industrial
stakeholders, environmental professionals, and community members on the use of
IoT technology for pollution monitoring and management, fostering knowledge
sharing and collaboration in environmental sustainability efforts.
4
CHAPTER 2
LITERATURE REVIEW
1. “Design and Implementation of Smart Home Control Systems Based on
Wireless Sensor Networks and Power Line Communications- Mingfu Li
and Hung-Ju Lin”
Wireless sensor networks (WSNs) and power line communications (PLCs) are
used in this work to implement a smart home control network. The goals are to
reduce the impact of wireless interference on a smart home control network and
unnecessary energy consumption of a smart home. An isolated WSN with one
coordinator, which is integrated into the PLC transceiver, is established in each
room. The coordinator is responsible for transferring environmental parameters
obtained by WSNs to the management station via PLCs. The control messages for
home appliances are directly transferred using PLCs rather than WSNs. According
to the experimental results, the impact of wireless interference on the proposed
smart home control network is substantially mitigated. Additionally, a smart
control algorithm for lighting systems and an analysis of the illumination of a
fluorescent lamp were presented. The energy saving of lighting systems relative to
those without smart control was evaluated. Numerical results indicate that the
electricity consumption on a sunny or cloudy day can be reduced by at least 40%
under the smart control. Moreover, a prototype for the proposed smart home
control network with the smart control algorithm was implemented. Experimental
tests demonstrate that the proposed system for smart home control networks is
practically feasible and performs well.
5
Pros:





Cons:





Security Concerns
Interoperability Challenges
Limited Range
Complexity
Infrastructure Dependency
Practical Feasibility
Direct PLC Communication
Isolated WSNs
Energy Efficiency
Reduced Wireless Interference
6
 Decentralized Approach
2. “A Decentralized Damage Detection System for Wireless Sensor and
Actuator Networks- Igor L. Santos, Luci Pirmez, Luiz R. Carmo, Paulo F.
Pires, Flávia C. Delicato and Samee U. Khan”
The unprecedented capabilities of monitoring and responding to stimuli in the
physical world of wireless sensor and actuator networks (WSAN) enable these
networks to provide the underpinning for several Smart City applications, such as
structural health monitoring (SHM). In such applications, civil structures,
endowed with wireless smart devices, are able to self-monitor and autonomously
respond to situations using computational intelligence. This work presents a
decentralized algorithm for detecting damage in structures by using a WSAN. As
key characteristics, beyond presenting a fully decentralized (in-network) and
collaborative approach for detecting damage in structures, our algorithm makes
use of cooperative information fusion for calculating a damage coefficient. We
conducted experiments for evaluating the algorithm in terms of its accuracy and
efficient use of the constrained WSAN resources. We found that our collaborative
and information fusion-based approach ensures the accuracy of our algorithm and
that it can answer promptly to stimuli (1.091 s), triggering actuators. Moreover,
for 100 nodes or less in the WSAN, the communication overhead of our algorithm
is tolerable and the WSAN running our algorithm, operating system and protocols
can last as long as 468 days.
Pros:


 Resource Efficiency
 Prompt Response Time
 Longevity
Cooperative Information Fusion
Autonomous Response
7
Cons:









3. “Wireless sensor networks: A survey on recent developments and
potential synergies- Priyanka Rawat”
Wireless sensor network (WSN) has emerged as one of the most promising
technologies for the future. This has been enabled by advances in technology and
availability of small, inexpensive, and smart sensors resulting in cost effective and
easily deployable WSNs. However, researchers must address a variety of
challenges to facilitate the widespread deployment of WSN technology in real-
world domains. In this survey, we give an overview of wireless sensor networks
and their application domains including the challenges that should be addressed in
order to push the technology further. Then we review the recent technologies and
testbeds for WSNs. Finally, we identify several open research issues that need to
be investigated in future. Our survey is different from existing surveys in that we
focus on recent developments in wireless sensor network technologies. We review
the leading research projects, standards and technologies, and platforms.
Moreover, we highlight a recent phenomenon in WSN research that is to explore
synergy between sensor networks and other technologies and explain how this can
help sensor networks achieve their full potential. This paper intends to help new
researchers entering the domain of WSNs by providing a comprehensive survey
on recent developments.
Security Concerns
Maintenance Requirements
Scalability
Accuracy Dependencies
Coordination Challenges
Complexity
8
Pros:

 Ease of deployment
 Versatility
 Real-time monitoring
 Scalability
 Integration with other technologies
Cons:
 Limited power
 Data security and privacy concerns
 Reliability and robustness
 Complexity
 Maintenance challenges



4. “Enhancing Security and Efficiency in IoT-Based Oil & Gas Pipeline
Monitoring Systems with a Novel Lightweight Cryptography Framework -
Zaria, Kaduna, Nigeria”
The oil and gas industry relies heavily on the seamless and secure operation of
pipelines to transport valuable resources. In this context, the integration of Internet of
Things (IoT) technologies offers the potential to enhance monitoring systems, providing
real-time insights and data-driven decision-making. This study presents a novel
framework for IoT-based oil and gas pipeline monitoring, designed to bolster security,
data accuracy, and operational efficiency. The framework encompasses strategic sensor
placement, a rotational cluster head selection scheme, efficient data aggregation, and
robust data encryption using the ASCON-128 Cipher. By strategically positioning IoT
sensors and employing advanced data aggregation techniques, redundant data
transmission is minimized, significantly improving the accuracy and efficiency of data
Standardization and interoperability
Cost-effectiveness
9
collection. Additionally, the rotational cluster head selection scheme optimizes power
consumption, extending the operational lifespan of IoT devices. While this framework is
currently in the conceptual phase, it holds great promise for addressing industry-specific
challenges. Future work should focus on practical implementations, security protocol
development, performance evaluations, scalability assessments, user authentication
enhancements, and system integration.
Pros:





Cons:





Regulatory Compliance
Maintenance Requirements
Scalability Challenges
Security Risks
Complex Implementation
Industry-specific Customization
Operational Efficiency
Enhanced Security
Improved Data Accuracy
Enhanced Monitoring Capabilities
10

CHAPTER 3
EXISTING SYSTEM
3.1 INTRODUCTION
In the existing system of industrial pollution monitoring, traditional
methods are predominantly used, which often rely on periodic manual sampling
and laboratory analysis.
3.2WORKING
1. MANUAL SAMPLING
Industrial pollution monitoring in many regions is primarily conducted
through manual sampling methods, where environmental agencies or regulatory
bodies collect samples of air, water, or soil from industrial sites at predetermined
intervals.
2. LABORATORY ANALYSIS
The collected samples are then transported to laboratories for analysis, where
specialized equipment and techniques are used to measure pollutant
concentrations and identify contaminants.
3. FIXED MONITORING STATIONS
Some industrial areas may have fixed monitoring stations installed by
regulatory authorities to continuously monitor air quality, water quality, or other
environmental parameters. These stations typically use conventional monitoring
instruments such as gas analyzers, particulate samplers, and weather sensors.
11
4. DATA REPORTING AND COMPLIANCE
The data collected through manual sampling or fixed monitoring stations are
reported to regulatory agencies for compliance monitoring and enforcement
purposes. Industries are required to adhere to environmental regulations and
emission standards set by government authorities.
3.3 DRAWBACKS
Despite its widespread use, the existing system of industrial pollution
monitoring has several limitations. Manual sampling methods are labor-intensive,
time-consuming, and often provide only snapshot data, which may not accurately
reflect real-time pollution levels. Fixed monitoring stations have limited coverage
and may not capture localized pollution hotspots or dynamic changes in pollutant
concentrations.
1. LIMITED ACCESSIBILITY
Additionally, data from traditional monitoring methods may not be
easily accessible to the public or other stakeholders, limiting transparency and
community engagement in pollution management efforts.
2. REGULATORY COMPLIANCE
Industries may struggle to comply with environmental regulations
due to the challenges associated with monitoring and managing pollution
effectively using conventional methods. Lack of real-time data and actionable
insights may hinder proactive pollution control measures.
12
CHAPTER 4
PROPOSED SYSTEM
4.1 INTRODUCTION
The proposed system for industrial pollution monitoring aims to overcome
the limitations of the existing system by leveraging Internet of Things (IoT)
technology to enable real-time monitoring, data analytics, and decision support.
IoT sensors have the ability to continuously monitor a variety of contaminants in
real-time, giving immediate input on the levels of pollution. This makes it possible
to identify any unusual emissions or environmental disruptions quickly and to take
appropriate action to stop any potential harm. Advanced analytics methods can be
used to examine the data gathered by IoT sensors. Large data sets can be
processed to find patterns, trends, and correlations that aid in a more thorough
understanding of the sources of pollutants, patterns of emissions, and the effects
these have on the environment. Industrial equipment predictive maintenance can
also be facilitated by IoT-enabled devices. Through real-time monitoring of
parameters like temperature, pressure, and performance indicators, equipment
breakdowns can be detected in advance, minimizing downtime and averting
unintentional pollution releases. With the use of Internet of Things (IoT)
technologies, operators may monitor pollution levels and operate equipment
remotely from any location with an internet connection. This adaptability
improves operational effectiveness and facilitates prompt resolution of any new
problems. Regulatory rules and environmental models can be integrated with IoT
data to create decision support systems. These systems give stakeholders useful
information and suggestions that they may use to reduce pollution, follow rules,
and enhance environmental performance in general.
13
4.2 BLOCK DIAGRAM
Figure 4.1 Block diagram of proposed system
14
Figure 4.2 Pin Diagram Of Arduino Uno
15
4.3 METHODOLOGY
Deploy IoT-based sensor networks in industrial facilities to continuously
monitor key pollutants, including particulate matter (PM), volatile organic
compounds (VOCs), sulfur dioxide (SO2), nitrogen oxides (NOx), carbon
monoxide (CO), and ozone (O3). These sensors will be strategically installed at
various points within industrial premises to capture real-time data on pollutant
concentrations and emission levels. Utilize wireless connectivity technologies
such as Wi-Fi, LoRaWAN, or cellular networks to transmit pollution data from the
sensors to a central IoT platform for aggregation and analysis. This enables
seamless communication between distributed sensors and centralized data
management systems, ensuring comprehensive coverage and timely data
collection. Implement advanced data analytics techniques, including machine
learning algorithms and statistical modeling, to process and analyze the collected
data. Identify patterns, trends, and anomalies in pollutant levels, and visualize the
results through interactive dashboards and reports. This provides stakeholders with
actionable insights for pollution control and mitigation strategies. Develop
decision support systems that integrate real-time pollution data with
environmental regulations, emission standards, and industry best practices.
Provide stakeholders, including industrial managers, regulatory authorities, and
environmental agencies, with personalized recommendations and alerts to
facilitate proactive pollution management and compliance monitoring. Enable
remote monitoring and access to pollution data through web-based interfaces or
mobile applications. Stakeholders can access real-time data, historical trends, and
predictive analytics from anywhere, anytime, facilitating informed decision-
making and rapid response to pollution events. Integrate the IoT pollution
monitoring system with existing environmental management systems, including
air quality monitoring networks, water quality monitoring stations, and
meteorological data sources. This enables cross-domain data integration and
16
holistic environmental assessment, supporting comprehensive pollution
monitoring and management efforts. Foster community engagement and
transparency in pollution management by sharing pollution data with the public
through open data platforms, interactive maps, and public awareness campaigns.
Empower citizens to actively participate in environmental stewardship and
advocacy efforts. Design the IoT pollution monitoring system to be scalable and
adaptable to different industrial settings, allowing for easy deployment, expansion,
and customization. Ensure interoperability with existing infrastructure and
compatibility with emerging IoT technologies to future-proof the system.
4.4 ADVANTAGES
 Real-time monitoring
 Comprehensive data collection
 Advanced analytics
 Cost-effectiveness
 Remote access
 Compliance support
 Improved environmental management
17
CHAPTER 5
HARDWARE REQUIREMENT
 Noise Sensor
 Temperature Sensor
 Humidity Sensor
 Gas Sensor
 Ultrasonic Sensor
 Float Sensor
 Bread Board Power Supply
 Jummper Wires
 9v Battery
 Microcontroller Arduino UNO
 LED Display
 Buzzer
 I2C
5.1 NOISE SENSOR
Figure 5.1 Noise Sensor
A noise sensor, also known as a sound sensor or acoustic sensor, is a device
that detects and measures sound levels in its environment. Noise sensors typically
work by converting sound waves into electrical signals. They contain a
18
microphone or transducer that converts variations in air pressure caused by
sound waves into electrical signals, which are then processed and analyzed to
determine the intensity or level of sound. Noise sensors are capable of detecting
sound levels across a wide range, from low-level ambient noise to high-intensity
sounds such as explosions or machinery operation. The detection range
depends on factors such as the sensitivity of the sensor and the frequency range it
is designed to detect. Noise sensors can be designed to respond to specific
frequency ranges of sound waves, such as infrasound (below 20 Hz), audible
sound (20 Hz to 20 kHz), or ultrasound (above 20 kHz). The frequency response
of the sensor determines its suitability for different applications and environments.
Noise sensors typically provide an output signal proportional to the sound level
detected in decibels (dB). This output signal can be analog (e.g., voltage or
current) or digital (e.g., pulse- width modulation or serial data), depending on the
sensor's design and interface requirements. Noise sensors find applications in
various industries and scenarios, including environmental monitoring, industrial
hygiene, occupational safety, transportation, smart cities, and home automation.
They are used to measure noise pollution levels, monitor machinery operation,
detect alarm signals, and trigger automated responses based on sound events.
Noise sensors can be interfaced with microcontrollers, data loggers, or other
electronic devices using analog or digital input pins. They require minimal
external components and can be integrated into existing systems with relative ease.
Some noise sensors may require calibration to ensure accurate measurement of
sound levels. Calibration procedures typically involve comparing the sensor's
output to reference standards or calibrated sound sources and adjusting calibration
factors accordingly. Environmental factors such as temperature, humidity, and air
pressure can affect the performance of noise sensors. Some sensors may include
compensation algorithms or environmental enclosures to minimize the impact of
environmental conditions on measurement accuracy.
19
5.2 TEMPERATURE SENSOR
Figure 5.2 Temperature Sensor
A temperature sensor is a device that measures ambient temperature and
converts it into an electrical signal. Temperature sensors operate based on various
principles, including resistance, voltage, capacitance, and infrared radiation. The
most common types of temperature sensors include thermocouples, resistance
temperature detectors (RTDs), thermistors, and integrated circuit (IC) temperature
sensors. Each type of sensor has its own working principle and characteristics.
Temperature sensors are capable of measuring temperatures across a wide range,
from sub-zero temperatures to high temperatures encountered in industrial
processes. The detection range depends on the type of sensor and its
specifications. The accuracy and precision of temperature sensors vary depending
on factors such as sensor type, calibration, and environmental conditions. High-
precision sensors are capable of providing accurate temperature measurements
with minimal error, making them suitable for applications where precise
temperature control is critical. Temperature sensors typically provide an output
signal proportional to the temperature being measured. This output signal can be
analog (e.g., voltage or resistance) or digital (e.g., serial data or pulse-width
modulation), depending on the sensor's design and interface requirements.
Temperature sensors find applications in various industries and scenarios,
including HVAC (heating, ventilation, and air conditioning) systems, automotive,
aerospace, medical devices, food processing, and environmental monitoring.
They are used for temperature control, monitoring, and safety purposes in
20
equipment, processes, and environments. Temperature sensors can be interfaced
with microcontrollers, data loggers, or other electronic devices using analog or
digital input pins. They require minimal external components and can be
integrated into existing systems with relative ease. Calibration is essential to
ensure the accuracy and reliability of temperature measurements. Temperature
sensors may require periodic calibration to maintain their performance over time.
Calibration procedures involve comparing the sensor's output to reference
standards or calibrated temperature sources and adjusting calibration factors
accordingly. Environmental factors such as temperature gradients, humidity, and
electromagnetic interference can affect the performance of temperature sensors.
Some sensors may include compensation algorithms or environmental enclosures
to minimize the impact of environmental conditions on measurement accuracy.
5.3 HUMIDITY SENSOR
Figure 5.3 Humidity Sensor
A humidity sensor, also known as a hygrometer, is a device that measures
the moisture content or relative humidity (RH) in the air. Humidity sensors
operate based on various principles, including capacitive, resistive, and thermal
conductivity. The most common type of humidity sensor is the capacitive
humidity sensor, which measures changes in capacitance caused by water vapor
adsorption or absorption on a sensing element. Humidity sensors are capable of
21
measuring relative humidity across a wide range, typically from 0% to 100% RH.
The detection range depends on the type of sensor and its specifications. The
accuracy and precision of humidity sensors vary depending on factors such as
sensor type, calibration, and environmental conditions. High-precision sensors are
capable of providing accurate humidity measurements with minimal error, making
them suitable for applications where precise humidity control is critical. Humidity
sensors typically provide an output signal proportional to the relative humidity
being measured. This output signal can be analog (e.g., voltage or resistance) or
digital (e.g., serial data or pulse-width modulation), depending on the sensor's
design and interface requirements. Humidity sensors find applications in various
industries and scenarios, including HVAC (heating, ventilation, and air
conditioning) systems, weather monitoring, agriculture, pharmaceuticals, and
industrial processes. They are used for humidity control, comfort monitoring, and
safety purposes in environments where humidity levels need to be regulated.
Humidity sensors can be interfaced with microcontrollers, data loggers, or other
electronic devices using analog or digital input pins. They require minimal
external components and can be integrated into existing systems with relative
ease. Calibration is essential to ensure the accuracy and reliability of humidity
measurements. Humidity sensors may require periodic calibration to maintain
their performance over time. Calibration procedures involve exposing the
sensor to reference humidity sources at known humidity levels and adjusting
calibration factors accordingly. Environmental factors such as temperature, air
flow, and chemical exposure can affect the performance of humidity sensors.
Some sensors may include compensation algorithms or environmental enclosures
to minimize the impact of environmental conditions on measurement accuracy.
22
5.4 GAS SENSOR
Figure 5.4 Gas Sensor
A gas sensor is a device that detects the presence or concentration of gases
in the surrounding environment. Gas sensors are used in various applications,
including industrial safety, environmental monitoring, air quality assessment, and
indoor/outdoor air pollution detection. Gas sensors operate based on different
principles depending on the type of gas being detected. Common gas sensing
principles include. Gas sensors based on chemical reactions involve a reaction
between the gas molecules and a sensing material, resulting in a change in
electrical conductivity or other measurable properties. Electrochemical gas sensors
use electrodes immersed in an electrolyte to detect gases through chemical
reactions that produce an electric current proportional to the gas concentration.
Semiconductor gas sensors rely on the change in electrical conductivity of a
semiconductor material when exposed to gas molecules, leading to a measurable
change in resistance. Optical gas sensors detect gases by measuring the absorption
or scattering of light by gas molecules. This principle is often used in infrared (IR)
gas sensors and laser-based gas detectors. Gas sensors are capable of detecting a
wide range of gases, including toxic gases, combustible gases, and environmental
pollutants. The detection range depends on the type of sensor and the specific gas
being detected, with some sensors specialized for specific gases while others are
more general-purpose. The accuracy and sensitivity of gas sensors vary depending
on factors such as sensor type, calibration, and environmental conditions. High-
23
quality sensors are capable of providing accurate and reliable measurements with
minimal false alarms and detection limits. Gas sensors typically provide an output
signal proportional to the gas concentration being measured. This output signal
can be analog (e.g., voltage or current) or digital (e.g., serial data or pulse-width
modulation), depending on the sensor's design and interface requirements. Gas
sensors find applications in various industries and scenarios, including industrial
safety (e.g., gas leak detection in chemical plants), environmental monitoring
(e.g., detecting air pollutants in urban areas), automotive (e.g., vehicle emissions
monitoring), and indoor air quality assessment (e.g., detecting carbon monoxide in
homes). Gas sensors can be interfaced with microcontrollers, data loggers, or other
electronic devices using analog or digital input pins. They require minimal
external components and can be integrated into existing systems with relative
ease. Calibration is essential to ensure the accuracy and reliability of gas sensor
measurements. Gas sensors may require periodic calibration to maintain their
performance over time. Calibration procedures involve exposing the sensor to
known gas concentrations and adjusting calibration factors accordingly.
Environmental factors such as temperature, humidity, and cross-sensitivity to
other gases can affect the performance of gas sensors. Some sensors may include
compensation algorithms or environmental enclosures to minimize the impact of
environmental conditions on measurement accuracy.
5.5 ULTRA SONIC SENSOR
Figure 5.5 Ultra Sonic Sensor
An ultrasonic sensor is a device that measures distances to objects by
emitting ultrasonic sound waves and analyzing the time it takes for the sound
waves to bounce back. Ultrasonic sensors operate based on the principle of
24
echolocation, similar to how bats navigate in the dark. The sensor emits high-
frequency sound waves (typically ultrasonic waves with frequencies above the
range of human hearing, around 20 kHz to 200 kHz) towards the target object.
These sound waves propagate through the air until they encounter an object in
their path. Upon striking the object, the sound waves are reflected back towards
the sensor. Ultrasonic sensors can measure distances ranging from a few
centimeters to several meters, depending on the sensor's design and
specifications. Short-range sensors are commonly used for proximity sensing and
obstacle detection in robotics and automation applications, while long-range
sensors are used for distance measurement in industrial and automotive systems.
The accuracy and precision of ultrasonic sensors depend on factors such as the
sensor's resolution, beam width, and environmental conditions. High-quality
sensors with narrow beam widths and advanced signal processing algorithms can
provide precise distance measurements with minimal errors. Ultrasonic sensors
typically provide an output signal proportional to the distance to the target object.
This output signal can be analog (e.g., voltage or current) or digital (e.g., pulse-
width modulation or serial data), depending on the sensor's design and interface
requirements. Ultrasonic sensors find applications in various industries and
scenarios, including robotics, industrial automation, automotive parking assistance
systems, object detection and tracking, liquid level measurement, and presence
detection in security systems. They are used for proximity sensing, collision
avoidance, distance measurement,and object localization in diverse environments.
Ultrasonic sensors can be interfaced with microcontrollers, data loggers, or other
electronic devices using analog or digital input pins. They require minimal
external components and can be integrated into existing systems with relative ease.
Environmental factors such as temperature, humidity, and air pressure can affect
the performance of ultrasonic sensors. Some sensors may include compensation
algorithms or environmental enclosures to minimize the impact of environmental
conditions.
25
5.6 BREAD BOARD POWER SUPPLY
Figure 5.6 Bread Board Power Supply
The breadboard is a fundamental tool used in electronics prototyping and
circuit design. A breadboard is typically a rectangular plastic board with a grid of
holes arranged in rows and columns. The holes are interconnected internally in a
specific pattern, allowing components to be easily inserted and connected without
soldering. The breadboard consists of multiple terminal strips arranged in parallel
rows. Each terminal strip typically contains multiple interconnected holes, usually
grouped in sets of five, known as "tie points." In addition to the terminal strips,
the breadboard often includes one or more pairs of horizontal bus strips running
along the length of the board. These bus strips provide additional connections for
power (usually labeled as + and -) and ground (usually labeled as GND).
Electronic components such as resistors, capacitors, integrated circuits, and
jumper wires are inserted into the holes on the breadboard. Components with two
or more leads (pins) are usually inserted across adjacent tie points to establish
electrical connections. When components are inserted into the breadboard, their
leads make electrical contact with the metal clips or springs inside the holes,
establishing connections between them. This allows components to be easily
interconnected without the need for soldering. Breadboards are commonly used
for prototyping and testing electronic circuits before they are soldered onto a more
permanent circuit board. Components can be easily added, removed, and
26
rearranged on the breadboard, facilitating iterative design and experimentation.
One of the key advantages of breadboards is that they are reusable. Components
can be inserted and removed multiple times without damaging the board, making
breadboards ideal for rapid prototyping and experimentation. While breadboards
are great for prototyping, they have limitations in terms of high-frequency
operation, reliability, and durability compared to soldered circuits. Therefore,
breadboards are typically used for low-frequency circuits, testing, and educational
purposes.
5.7 JUMPER WIRES
Figure 5.7 Jumper Wires
Jumper wires are essential components in electronics prototyping and
circuit building. Jumper wires are used to create electrical connections between
various components on a breadboard or between different points on a circuit
board. They allow for easy and temporary connections without the need for
soldering. Jumper wires consist of insulated wire with a solid core or stranded
core. The insulation material can be plastic or silicone, providing electrical
insulation and flexibility. Jumper wires typically have connector pins or clips at
each end. The most common types of connectors are male pins, female sockets,
and alligator clips. These connectors allow jumper wires to be easily plugged into
or clipped onto components or connection points. Jumper wires come in various
lengths, ranging from a few centimeters to several inches or longer. They are
often color-coded to aid in organization and identification of connections within a
circuit. Common colors include red, black, blue, green, yellow, and white. Jumper
27
wires are flexible and bendable, allowing them to be routed and manipulated to
make connections in tight spaces or complex circuits. The flexibility of jumper
wires makes them versatile for use in a wide range of electronic projects. Jumper
wires are reusable and can be easily disconnected and reconnected as needed. This
makes them ideal for prototyping, experimentation, and iterative design in
electronics projects.
TYPES OF JUMPER WIRES:
Male-to-Male: Both ends of the wire have male pins, suitable for connecting
components with female headers or sockets.
Male-to-Female: One end has male pins, and the other end has female
sockets, allowing for connections between components with different types of
connectors.
Female-to-Female: Both ends have female sockets, useful for extending the
reach of male headers or sockets.
Jumper wires are commonly used in bread boarding, circuit prototyping,
Arduino projects, Raspberry Pi projects, robotics, and educational electronics.
They enable quick and temporary connections between components, facilitating
the testing and development of electronic circuits.
5.8 9V BATTERY
Figure 5.8 9V Battery
A 9V battery is a compact and commonly used power source in electronics for
28
providing portable and easy-to-use power to various devices. As the name
suggests, the 9V battery provides a nominal voltage of 9 volts. This voltage is
higher than typical AA or AAA batteries, making it suitable for devices that
require higher operating voltages. The most common type of 9V battery is the
rectangular-shaped "transistor" battery, which typically uses six cylindrical cells
connected in series. These cells are often zinc-carbon (carbon-zinc) or alkaline
chemistry, although rechargeable nickel-metal hydride (NiMH) and lithium-ion(Li-
ion) 9V batteries are also available. The 9V battery is characterized by its
rectangular shape with a snap connector on the top. It is commonly used in
devices such as smoke detectors, multimeters, wireless microphones, guitar
pedals, and various small electronic gadgets. The capacity of a 9V battery refers to
the amount of electrical charge it can store and deliver. This capacity is typically
measured in milliamp ere-hours (mAh) or ampere-hours (Ah) and varies
depending on the battery chemistry and manufacturer. Alkaline 9V batteries
typically have higher capacities compared to carbon-zinc batteries. 9V batteries
are widely used in applications where a compact and portable power source is
required. They are often used in devices that do not require continuous high
current draw but instead rely on intermittent or low-power operation. When a 9V
battery is depleted, it should be replaced with a new battery of the same type and
chemistry. Used batteries should be disposed of properly according to local
regulations, as they may contain hazardous materials. Rechargeable 9V batteries
are available in nickel-metal hydride (NiMH) and lithium-ion (Li-ion)
chemistries. These rechargeable batteries can be recharged using compatible
battery chargers, offering a more cost-effective and environmentally friendly
alternative to single- use batteries. When using 9V batteries, it's essential to
consider factors such as voltage compatibility with the device, battery life, and the
cost-effectiveness of rechargeable options, especially for high-drain applications
or devices that require frequent battery replacement.
29
5.9 MICROCONTROLLER ARDUINO UNO
Figure 5.9 Microcontroller Arduino UNO
Arduino UNO is a microcontroller board based on the ATmega328P. It
has 14 digital input/output pins (of which 6 can be used as PWM outputs), 6
analog inputs, a 16 MHz ceramic resonator, a USB connection, a power jack, an
ICSP header and a reset button. Arduino UNO is a low-cost, flexible, and easy- to-
use programmable open-source microcontroller board that can be integratedinto a
variety of electronic projects. This board can be interfaced with other Arduino
boards, Arduino shields, Raspberry Pi boards and can control relays,LEDs, servos,
and motors as an output. The Arduino board can be powered usinga USB cable
from a computer or AC mains power supply by connecting it to the Barrel Jack.
The voltage regulator controls the voltage given to the board and stabilizes the DC
voltages used by the processor and other elements. The crystal oscillator helps
Arduino deal with time issues, with a frequency of 16,000,000 Hertz or 16 MHz.
To reset the Arduino board, use the reset button on the board or connect an external
reset button to the RESET pin. The board has six analog input pins A0 through A5,
which can read signals from analog sensors and convert them into digital values.
Each Arduino board has its own main microcontroller, which is usually of the
ATMEL Company. The ICSP pin, a tiny programming header for the Arduino, is
often referred to as an SPI (Serial Peripheral Interface), which is an "expansion"
of the output.The power LED indicator should light up when plugged into a power
source to indicate the board is powered up correctly. The TX
30
and RX LEDs, labeled TX (transmit) and RX (receive), flash at different speeds
during serial communication. Digital I/O is a crucial component of the Arduino
board, allowing the board to communicate with the microprocessor. The Arduino
UNO board has 14 digital I/O pins (15) (of which 6 provide PWM (Pulse Width
Modulation) output. These pins can be configured to work as input digital pins to
read logic values (0 or 1) or as digital output pins to drive different modules like
LEDs, relays, etc. The pins labeled “~” can be used to generate PWM. AREF
stands for Analog Reference. It is sometimes, used to set an external reference
voltage (between 0 and 5 Volts) as the upper limit for the analog input pins.
5.10 LED DISPLAY
Figure 5.10 LED Display
A LED (Light Emitting Diode) display is a revolutionary visual technology
that utilizes an array of LEDs to produce images, text, or videos. Its fundamental
components are semiconductor diodes that emit light when an electric current
passes through them. These displays offer several advantages over traditional
technologies, including superior brightness, vibrant colors, energy efficiency, and
durability. LED displays are commonly used in various applications, such as
outdoor advertising billboards, stadium scoreboards, indoor digital signage, and
large-scale video walls. One of the key benefits of LED displays is their high
brightness, which ensures excellent visibility even in brightly lit environments or
during daylight. Their vibrant colors and dynamic contrast ratio make them
particularly eye-catching, capturing the attention of audiences effectively.
Moreover, LED technology is inherently energy-efficient, consuming significantly
31
less power compared to conventional display technologies like incandescent bulbs
or fluorescent tubes. This not only reduces operating costs but also contributes to
environmental sustainability. Another advantage of LED displays is their
durability and longevity. LED diodes have a longer lifespan and are more resistant
to shock, vibration, and temperature fluctuations than traditional display elements.
Additionally, LED displays are often designed with modular panels, allowing for
easy maintenance and repair. This modular design also offers flexibility in size
and shape, enabling the creation of custom display configurations to suit specific
needs. Advanced control systems manage the content displayed on LED screens,
enabling dynamic and interactive visual experiences. These systems can integrate
with various input sources, including computers, media players, and sensors,
allowing for real-time updates and customization of content. With ongoing
technological advancements, LED displays continue to evolve, offering higher
resolutions, improved color accuracy, and enhanced functionalities, driving their
widespread adoption in diverse industries worldwide.
5.11BUZZER
Figure 5.11 Buzzer
A buzzer is an electromechanical device that generates sound when an
electrical signal is applied to it. It typically consists of a coil of wire
(electromagnet) attached to a diaphragm or a piezoelectric element. When an
electrical current passes through the coil, it creates a magnetic field that causes the
diaphragm to vibrate, producing sound waves. Buzzer designs vary based on their
intended application and the desired sound output. Some buzzers are simple and
32
produce a single tone, while others are more complex and can generate a variety
of tones, melodies, or even voice messages. The frequency and intensity of the
sound produced by a buzzer can often be controlled by adjusting the voltage or
frequency of the electrical signal applied to it. Buzzers are commonly used in a
wide range of electronic devices and systems for various purposes. In consumer
electronics, they are found in devices such as alarm clocks, timers, and household
appliances to provide audible alerts or notifications. In industrial applications,
buzzers are often used as warning signals or indicators to alert operators of
potential hazards, equipment malfunctions, or process completion. Additionally,
buzzers are frequently employed in electronic games and toys to provide audio
feedback and enhance the user experience. They are also used in security systems,
automotive electronics, medical devices, and telecommunications equipment,
among many other applications. Overall, buzzers play a vital role in providing
auditory feedback and alerts in numerous electronic devices and systems,
contributing to their functionality, safety, and usability.
5.12 I2C
Figure 5.12 I2C
I2C, short for Inter-Integrated Circuit, is a widely used serial
communication protocol in the realm of electronics. Developed by Philips
Semiconductor, now NXP Semiconductors, in the early 1980s, it has become a
cornerstone for connecting integrated circuits in various applications. The
simplicity and efficiency of I2C stem from its utilization of only two wires: a
33
serial data line (SDA) and a serial clock line (SCL). This minimalist approach
enables seamless communication between devices while conserving valuable
resources such as pins and board space. I2C operates on a master-slave
architecture, where a master device initiates and controls communication with one
or more slave devices. Each slave device on the bus is assigned a unique address,
allowing the master to address specific slaves for data exchange. The versatility of
I2C makes it invaluable across a spectrum of applications. One prominent use of
I2C is in sensor interfacing. Many sensors, such as temperature sensors,
accelerometers, and gyroscopes, utilize I2C for transmitting data to
microcontrollers or other processing units. Additionally, I2C is commonly
employed in memory storage devices like EEPROMs (Electrically Erasable
Programmable Read-Only Memory) for configuration and data storage purposes.
Moreover, I2C finds extensive use in controlling peripheral devices such as LCD
displays, motor drivers, and LED controllers. Its ability to connect multiple
devices using minimal wiring makes it particularly suitable for complex systems
where space and wiring constraints are critical considerations. Overall, I2C's
simplicity, efficiency, and versatility have made it a preferred choice for
communication between integrated circuits in a diverse range of applications,
spanning from consumer electronics to industrial automation and beyond.
34
CH
C
A
H
PA
TE
PR
TE
6R 6
RESULT AND DISCUSSION
6.1EXPLANATION
The aim of this system is to aid in reducing respiratory problems due to
industrial activities and to monitor the level of air pollution. The main focus is on
finding solutions to the increasing problem of harmful gasses amounting from
industrial practices in the country. In our research, we implemented sensors to be
used to detect the presence of undesired gases in the air of residential areas near
factories and industrial activities. The sensors provide continuous monitoring and
record data for air pollution continuously, where these results are reported and
analyzed using Internet of Things technology.
Figure 6.1 Implementation
35
6.2SCREENSHOTS
Figure 6.2 Result
36
CHAPTER 7
CONCLUSION AND FUTURE ENHANCEMENT
7.1 CONCLUSION
The proposed system for industrial pollution monitoring using Internet of
Things (IoT) technology represents a significant advancement in environmental
monitoring and management. By leveraging IoT sensor networks, wireless
connectivity, and advanced data analytics, the proposed system offers real-time
monitoring, actionable insights, and enhanced transparency in pollution control
and mitigation efforts. The integration of IoT technology enables continuous
monitoring of key pollutants in industrial facilities, providing stakeholders with
timely and accurate data on pollution levels. This facilitates proactive decision-
making, rapid response to pollution events, and improved regulatory compliance.
Additionally, the proposed system promotes community engagement and
transparency by sharing pollution data with the public and fostering environmental
awareness and advocacy. Overall, the proposed system has the potential to
revolutionize industrial pollution monitoring and management practices, leading
to cleaner environments, healthier communities, and sustainable industrial
development. By embracing IoT technology and innovative approaches to
pollution control, industrial stakeholders can contribute to a greener and more
sustainable future for generations to come.
37
7.2FUTURE ENHANCEMENT
The future scope of industrial pollution monitoring using IoT technology holds
immense potential for further advancements and applications. Continued
advancements in sensor technology, including miniaturization, improved
sensitivity, and multi-parameter sensing capabilities, will enhance the accuracy
and efficiency of pollution monitoring systems. Integration of emerging sensor
technologies such as nano sensors and biosensors could enable real-time detection
of a broader range of pollutants with higher precision. Integration of edge
computing and artificial intelligence (AI) techniques, such as machine learning
and deep learning algorithms, will enable real-time data processing and analysis at
the edge of the network. This will reduce latency, optimize bandwidth usage, and
enable more intelligent decision-making capabilities directly at the sensor nodes.
The use of predictive analytics models will enable the prediction of future
pollution trends and identification of potential pollution hotspots based on
historical data, environmental parameters, and weather forecasts. This proactive
approach will facilitate early intervention and preventive measures to mitigate
pollution risks and protect ecosystems. Integration of industrial pollution
monitoring systems with smart city initiatives will enable holistic environmental
monitoring and management at the urban scale. Data integration from various
sources, including traffic monitoring, weather stations, and air quality sensors, will
provide comprehensive insights into the environmental health of cities and support
evidence-based policymaking. The use of blockchain technology will enhance
data security, integrity, and transparency in pollution monitoring systems.
Blockchain-based solutions can provide immutable records of pollution data,
enabling stakeholders to verify the authenticity and traceability of environmental
data, while ensuring data privacy and confidentiality. Development of
collaborative platforms and data-sharing initiatives among industrial stakeholders,
regulatory agencies, academic institutions, and communities will promote
knowledge exchange, best practices sharing, and collective action for pollution
38
control and environmental sustainability. Citizen science initiatives and
crowdsourced pollution monitoring programs will empower citizens to actively
participate in environmental monitoring and advocacy efforts. Mobile apps,
citizen science platforms, and community-driven monitoring projects will engage
citizens in data collection, analysis, and reporting, fostering environmental
awareness and civic engagement. Establishment of global monitoring networks
and interoperable standards for pollution monitoring data exchange will facilitate
cross-border collaboration, harmonization of monitoring protocols, and
benchmarking of pollution levels on a global scale. This will enable coordinated
efforts to address transboundary pollution challenges and achieve global
environmental goals.
39
APPENDIX
Arduino Coding to connect Noise Sensor:
// Analog noise sensor connected to analog pin A0
const int noiseSensorPin = A0;
// Digital noise sensor connected to digital pin 2 const
int digitalNoiseSensorPin = 2;
void setup() {
Serial.begin(9600); // Initialize serial communication for debugging
}
void loop() {
// Read analog value from the noise sensor
int analogNoiseValue = analogRead(noiseSensorPin);
// Read digital value from the noise sensor
int digitalNoiseValue = digitalRead(digitalNoiseSensorPin);
// Print the values to serial monitor
Serial.print("Analog Noise Value: ");
Serial.println(analogNoiseValue);
Serial.print("DigitalNoise Value: ");
40
APPENDIX
Arduino Coding to connect Temperature Sensor:
#include <OneWire.h>
#include <DallasTemperature.h>
// Data wire is connected to pin 2 on the Arduino
#define ONE_WIRE_BUS 2
// Setup a oneWire instance to communicate with any OneWire devices
OneWire oneWire(ONE_WIRE_BUS);
// Pass our oneWire reference to Dallas Temperature sensor
DallasTemperature sensors(&oneWire);
void setup() { Serial.begin(9600);
sensors.begin(); // Initialize the sensor
}void loop() {
sensors.requestTemperatures(); // Request temperature readings
float temperatureC = sensors.getTempCByIndex(0); // Get temperature in Celsius
Serial.print("Temperature: ");
Serial.print(temperatureC);
41
APPENDIX
Arduino Coding to connect Ultra Sonic Sensor:
// Define pins for ultrasonic sensor
const int trigPin = 7;
// Trigger pin
const int echoPin =6; // Echo pin void
setup() {
Serial.begin(9600); // Initialize serial communication for debugging
pinMode(trigPin, OUTPUT);
pinMode(echoPin, INPUT);
}
void loop() {
long duration, distance;
// Send a 10us pulse to trigger pin
digitalWrite(trigPin, LOW);
delayMicroseconds(2);
digitalWrite(trigPin, HIGH);
delayMicroseconds(10);
digitalWrite(trigPin, LOW);
42
duration = pulseIn(echoPin, HIGH);
// Calculate distance in cm distance =
duration * 0.034 / 2;
// Print distance to serial monitor
Serial.print("Distance: ");
Serial.print(distance); Serial.println(" cm"); delay(1000); // Delay for stability
}
43
APPENDIX
Arduino coding to connect Gas Sensor:
// Define pin connections
const int AOUT_pin = A0; // Analog output pin
const int DOUT_pin = 2; // Digital output pin void
setup() {
Serial.begin(9600); // Initialize serial communication for debugging
pinMode(DOUT_pin, INPUT); // Set digital pin as input
}
void loop() {
// Read analog value from the sensor
int sensorValue = analogRead(AOUT_pin);
// Read digital value from the sensor
int digitalValue = digitalRead(DOUT_pin);
// Print values to serial monitor
Serial.print("Analog Value: ");
Serial.print(sensorValue);
Serial.print("tDigital Value: ");
44
// Interpret digital value
if (digitalValue == HIGH) { Serial.println("Gas detected!");
} else {
Serial.println("No gas detected.");
}
// Delay before next reading
delay(1000);
}
45
APPENDIX
Arduino coding to connect Humidity Sensor:
#include <DHT.h>
#define DHT_PIN 2 // Pin connected to the DHT sensor
// Uncomment one of the lines below corresponding to your sensor type
//#define DHT_TYPE DHT11 // DHT 11
#define DHT_TYPE DHT22 // DHT 22 (AM2302)
//#define DHT_TYPE DHT21 // DHT 21 (AM2301)
DHT dht(DHT_PIN, DHT_TYPE);
void setup() {
Serial.begin(9600); // Initialize serial communication
dht.begin(); // Initialize DHT sensor
}
void loop() {
delay(2000); // Delay between sensor readings
// Read temperature (in Celsius) from the sensor float
temperature = dht.readTemperature();
// Read humidity (%) from the sensor float
humidity = dht.readHumidity();
46
// Check if any reads failed and exit early (to try again). if
(isnan(temperature) || isnan(humidity)) {
Serial.println("Failed to read from DHT sensor!"); return;
}
// Print temperature and humidity to Serial Monitor Serial.print("Temperature: ");
Serial.print(temperature);
Serial.print("°Ct"); Serial.print("Humidity: ");
Serial.print(humidity); Serial.println("%");
}
47
APPENDIX
#include <DHT.h> #include
<Wire.h>
#include <LiquidCrystal_I2C.h>
#define DHT_PIN 2
// Pin connected to the DHT sensor #define
MQ2_PIN A0
// Analog pin connected to MQ2 gas sensor
#define TRIG_PIN 7
// Trigger pin of the ultrasonic sensor
#define ECHO_PIN 6
// Echo pin of the ultrasonic sensor #define LM35_PIN A1
// Analog pin connected to LM35 temperature sensor
#define NOISE_PIN A2
// Analog pin connected to noise sensor
#define LED_PIN 8
// Digital pin connected to LED
#define BUZZER_PIN 9
// Digital pin connected to buzzer
48
#define DHT_TYPE DHT22
// DHT22 sensor type
DHT dht(DHT_PIN, DHT_TYPE);
LiquidCrystal_I2C lcd(0x27, 16, 2);
// Address 0x27 for a 16x2 display
void setup() {
Serial.begin(9600);
// Initialize serial communication
dht.begin();
// Initialize DHT sensor lcd.begin();
// Initialize LCD lcd.backlight();
// Turn on LCD backlight
pinMode(TRIG_PIN, OUTPUT);
pinMode(ECHO_PIN, INPUT);
pinMode(LED_PIN, OUTPUT);
pinMode(BUZZER_PIN, OUTPUT);
}
void loop() {
// Read temperature and humidity from DHT22 sensor float
49
temperature = dht.readTemperature();
float humidity = dht.readHumidity();
// Read analog value from MQ2 gas sensor int
mq2Value = analogRead(MQ2_PIN);
// Read distance from ultrasonic sensor long duration, distance;
digitalWrite(TRIG_PIN,LOW); delayMicroseconds(2); digitalWrite(TRIG_PIN,
HIGH); delayMicroseconds(10); digitalWrite(TRIG_PIN, LOW); duration =
pulseIn(ECHO_PIN, HIGH); distance = duration * 0.034 / 2;
// Read temperature from LM35 sensor
int lm35Value = analogRead(LM35_PIN);
float temperature_lm35 = (lm35Value * 0.004882814) * 100;
// Convert to Celsius
// Read noise level
int noiseValue = analogRead(NOISE_PIN);
// Print sensor readings to serial monitor
Serial.print("Temperature (DHT22): ");
Serial.print(temperature);
Serial.println("°C"); Serial.print("Humidity
(DHT22): "); Serial.print(humidity);
Serial.println("%");
50
Serial.print("MQ2 Value: ");
Serial.println(mq2Value);
Serial.print("Ultrasonic Distance: ");
Serial.print(distance); Serial.println("
cm");
Serial.print("Temperature (LM35): "); Serial.print(temperature_lm35);
Serial.println("°C"); Serial.print("Noise Level: ");
Serial.println(noiseValue);
// Display sensor readings on LCD
lcd.clear();
lcd.setCursor(0, 0);
lcd.print("Temp: ");
lcd.print(temperature); lcd.print("
C"); lcd.setCursor(0, 1);
lcd.print("Humidity: ");
lcd.print(humidity); lcd.print("%");
// Trigger LED and buzzer based on sensor readings
if (temperature > 25 || humidity > 70 || mq2Value > 500 || distance < 50 ||
noiseValue > 500) {
digitalWrite(LED_PIN, HIGH);
51
// Turn on LED tone(BUZZER_PIN,1000);
// Activate buzzer
} else {
digitalWrite(LED_PIN, LOW);
// Turn off LED
noTone(BUZZER_PIN);
// Deactivate buzzer
}
// Add a delay before next sensor readings
delay(2000);
}
52
REFERENCES
1. Gopal, M.; Singh, V. Control Systems Engineering; Wiley: New York, NY,
USA, 2008; Volume SMC-6, No. 9. [Google Scholar]
2. Li, M.; Lin, H.J. Design and Implementation of Smart Home Control Systems
Based on Wireless Sensor Networks and Power Line Communications. IEEE
Trans. Ind. Electron. 2015, 62, 4430–4442. [Google Scholar] [CrossRef]
3. Santos, I.L.; Pirmez, L.; Carmo, L.R.; Pires, P.F.; Delicato, F.C.; Khan, S.U.;
Zomaya, A.Y. A Decentralized Damage Detection System for Wireless
Sensor and Actuator Networks. IEEE Trans. Comput. 2016, 65, 1363–1376.
[Google Scholar] [CrossRef]
4. Rawat, P.; Singh, K.D.; Chaouchi, H.; Bonnin, J.M. Wireless sensor networks:
A survey on recent developments and potential synergies. J. Supercomput.
2014, 68, 1–48. [Google Scholar] [CrossRef]
5. Borges, L.M.; Velez, F.J.; Lebres, A.S. Survey on the characterization and
classification of wireless sensor network applications. IEEE Commun. Surv.
Tutor. 2014, 16, 1860–1890. [Google Scholar] [CrossRef].
6. Akyildiz and I. Kasimoglu, "Wireless sensor and actor networks: Research
challenges", Ad Hoc Netw., vol. 2, no. 4, pp. 351-367, Oct. 2004.
7. G. Hackmann, F. Sun, N. Castaneda, C. Lu and S. Dyke, "A holistic approach
to decentralized structural damage localization using wireless sensor
networks", Comput. Commun., vol. 36, no. 1, pp. 29-41, Dec. 2012.
8. D. M. Han and J. H. Lim, "Smart home energy management system using
IEEE 802.15.4 and Zigbee", IEEE Trans. Consum. Electron., vol. 56, no. 3,
pp. 1403-1410, Aug. 2010.
9. H. Wang and J. Wang, "Design and implementation of a smart home based on
WSN and AMR", Appl. Mech. Mater., vol. 271-272, pp. 1485-1489, 2013.
53
54
55
56

Mais conteúdo relacionado

Semelhante a karthi batch.docx project documentation

IOT BASED RIVER WATER QUALITY MONITORING SYSTEM USING NODE MCU
IOT BASED RIVER WATER QUALITY MONITORING SYSTEM USING NODE MCUIOT BASED RIVER WATER QUALITY MONITORING SYSTEM USING NODE MCU
IOT BASED RIVER WATER QUALITY MONITORING SYSTEM USING NODE MCUIRJET Journal
 
IRJET- IoT based Air Pollution Monitoring System to Create a Smart Environment
IRJET- IoT based Air Pollution Monitoring System to Create a Smart EnvironmentIRJET- IoT based Air Pollution Monitoring System to Create a Smart Environment
IRJET- IoT based Air Pollution Monitoring System to Create a Smart EnvironmentIRJET Journal
 
IRJET - Study on Smart Air Pollution Monitoring System based on IoT
IRJET - Study on Smart Air Pollution Monitoring System based on IoTIRJET - Study on Smart Air Pollution Monitoring System based on IoT
IRJET - Study on Smart Air Pollution Monitoring System based on IoTIRJET Journal
 
IRJET- IOT Based Air and Sound Pollution Monitoring System
IRJET-  	  IOT Based Air and Sound Pollution Monitoring SystemIRJET-  	  IOT Based Air and Sound Pollution Monitoring System
IRJET- IOT Based Air and Sound Pollution Monitoring SystemIRJET Journal
 
Btechseminar 190826153808
Btechseminar 190826153808Btechseminar 190826153808
Btechseminar 190826153808njugrwfn
 
Latex Beamer Presentation, Smart Wearable Sensor
Latex Beamer Presentation, Smart Wearable Sensor Latex Beamer Presentation, Smart Wearable Sensor
Latex Beamer Presentation, Smart Wearable Sensor FathimaCec
 
CHSN Conference PPTCHSN Confe CHSN Conference PPTCHSN Con...
CHSN Conference PPTCHSN Confe                     CHSN Conference PPTCHSN Con...CHSN Conference PPTCHSN Confe                     CHSN Conference PPTCHSN Con...
CHSN Conference PPTCHSN Confe CHSN Conference PPTCHSN Con...GorreNarsimhulu
 
IRJET- An IoT based Low Cost Air Pollution Monitoring System
IRJET- An IoT based Low Cost Air Pollution Monitoring SystemIRJET- An IoT based Low Cost Air Pollution Monitoring System
IRJET- An IoT based Low Cost Air Pollution Monitoring SystemIRJET Journal
 
IRJET - Solid Waste Monitoring using IoT
IRJET - Solid Waste Monitoring using IoTIRJET - Solid Waste Monitoring using IoT
IRJET - Solid Waste Monitoring using IoTIRJET Journal
 
HOSTILE GAS MONITORING SYSTEM USING IoT
HOSTILE GAS MONITORING SYSTEM USING IoTHOSTILE GAS MONITORING SYSTEM USING IoT
HOSTILE GAS MONITORING SYSTEM USING IoTIRJET Journal
 
IRJET- Air and Sound Pollution Monitoring System using IoT
IRJET- Air and Sound Pollution Monitoring System using IoTIRJET- Air and Sound Pollution Monitoring System using IoT
IRJET- Air and Sound Pollution Monitoring System using IoTIRJET Journal
 
A SURVEY APPLICATION OF IOT
A SURVEY  APPLICATION OF IOTA SURVEY  APPLICATION OF IOT
A SURVEY APPLICATION OF IOTRick Vogel
 
A Survey: Application of IOT
A Survey: Application of IOTA Survey: Application of IOT
A Survey: Application of IOTIRJET Journal
 
IRJET- A Review on WSN based Water Quality Monitoring System
IRJET- A Review on WSN based Water Quality Monitoring SystemIRJET- A Review on WSN based Water Quality Monitoring System
IRJET- A Review on WSN based Water Quality Monitoring SystemIRJET Journal
 
An Efficient Tracking System for Air and Sound.pdf
An Efficient Tracking System for Air and Sound.pdfAn Efficient Tracking System for Air and Sound.pdf
An Efficient Tracking System for Air and Sound.pdfAakash Sheelvant
 
IoT Application in Manufacturing & Advantage , Disadvantage.
IoT Application in Manufacturing & Advantage , Disadvantage.IoT Application in Manufacturing & Advantage , Disadvantage.
IoT Application in Manufacturing & Advantage , Disadvantage.GHANASHYAM19
 
An Automated Machine Learning Approach For Smart Waste Management System
An Automated Machine Learning Approach For Smart Waste Management SystemAn Automated Machine Learning Approach For Smart Waste Management System
An Automated Machine Learning Approach For Smart Waste Management SystemIRJET Journal
 
IRJET- IoT based Greenhouse Monitoring using PIC16F877A
IRJET- IoT based Greenhouse Monitoring using PIC16F877AIRJET- IoT based Greenhouse Monitoring using PIC16F877A
IRJET- IoT based Greenhouse Monitoring using PIC16F877AIRJET Journal
 
Air Quality Monitoring and Control System in IoT
Air Quality Monitoring and Control System in IoTAir Quality Monitoring and Control System in IoT
Air Quality Monitoring and Control System in IoTijtsrd
 

Semelhante a karthi batch.docx project documentation (20)

IOT BASED RIVER WATER QUALITY MONITORING SYSTEM USING NODE MCU
IOT BASED RIVER WATER QUALITY MONITORING SYSTEM USING NODE MCUIOT BASED RIVER WATER QUALITY MONITORING SYSTEM USING NODE MCU
IOT BASED RIVER WATER QUALITY MONITORING SYSTEM USING NODE MCU
 
IRJET- IoT based Air Pollution Monitoring System to Create a Smart Environment
IRJET- IoT based Air Pollution Monitoring System to Create a Smart EnvironmentIRJET- IoT based Air Pollution Monitoring System to Create a Smart Environment
IRJET- IoT based Air Pollution Monitoring System to Create a Smart Environment
 
IRJET - Study on Smart Air Pollution Monitoring System based on IoT
IRJET - Study on Smart Air Pollution Monitoring System based on IoTIRJET - Study on Smart Air Pollution Monitoring System based on IoT
IRJET - Study on Smart Air Pollution Monitoring System based on IoT
 
IRJET- IOT Based Air and Sound Pollution Monitoring System
IRJET-  	  IOT Based Air and Sound Pollution Monitoring SystemIRJET-  	  IOT Based Air and Sound Pollution Monitoring System
IRJET- IOT Based Air and Sound Pollution Monitoring System
 
Btechseminar 190826153808
Btechseminar 190826153808Btechseminar 190826153808
Btechseminar 190826153808
 
Latex Beamer Presentation, Smart Wearable Sensor
Latex Beamer Presentation, Smart Wearable Sensor Latex Beamer Presentation, Smart Wearable Sensor
Latex Beamer Presentation, Smart Wearable Sensor
 
CHSN Conference PPTCHSN Confe CHSN Conference PPTCHSN Con...
CHSN Conference PPTCHSN Confe                     CHSN Conference PPTCHSN Con...CHSN Conference PPTCHSN Confe                     CHSN Conference PPTCHSN Con...
CHSN Conference PPTCHSN Confe CHSN Conference PPTCHSN Con...
 
IRJET- An IoT based Low Cost Air Pollution Monitoring System
IRJET- An IoT based Low Cost Air Pollution Monitoring SystemIRJET- An IoT based Low Cost Air Pollution Monitoring System
IRJET- An IoT based Low Cost Air Pollution Monitoring System
 
IRJET - Solid Waste Monitoring using IoT
IRJET - Solid Waste Monitoring using IoTIRJET - Solid Waste Monitoring using IoT
IRJET - Solid Waste Monitoring using IoT
 
HOSTILE GAS MONITORING SYSTEM USING IoT
HOSTILE GAS MONITORING SYSTEM USING IoTHOSTILE GAS MONITORING SYSTEM USING IoT
HOSTILE GAS MONITORING SYSTEM USING IoT
 
IRJET- Air and Sound Pollution Monitoring System using IoT
IRJET- Air and Sound Pollution Monitoring System using IoTIRJET- Air and Sound Pollution Monitoring System using IoT
IRJET- Air and Sound Pollution Monitoring System using IoT
 
A SURVEY APPLICATION OF IOT
A SURVEY  APPLICATION OF IOTA SURVEY  APPLICATION OF IOT
A SURVEY APPLICATION OF IOT
 
Research Valorisation
Research ValorisationResearch Valorisation
Research Valorisation
 
A Survey: Application of IOT
A Survey: Application of IOTA Survey: Application of IOT
A Survey: Application of IOT
 
IRJET- A Review on WSN based Water Quality Monitoring System
IRJET- A Review on WSN based Water Quality Monitoring SystemIRJET- A Review on WSN based Water Quality Monitoring System
IRJET- A Review on WSN based Water Quality Monitoring System
 
An Efficient Tracking System for Air and Sound.pdf
An Efficient Tracking System for Air and Sound.pdfAn Efficient Tracking System for Air and Sound.pdf
An Efficient Tracking System for Air and Sound.pdf
 
IoT Application in Manufacturing & Advantage , Disadvantage.
IoT Application in Manufacturing & Advantage , Disadvantage.IoT Application in Manufacturing & Advantage , Disadvantage.
IoT Application in Manufacturing & Advantage , Disadvantage.
 
An Automated Machine Learning Approach For Smart Waste Management System
An Automated Machine Learning Approach For Smart Waste Management SystemAn Automated Machine Learning Approach For Smart Waste Management System
An Automated Machine Learning Approach For Smart Waste Management System
 
IRJET- IoT based Greenhouse Monitoring using PIC16F877A
IRJET- IoT based Greenhouse Monitoring using PIC16F877AIRJET- IoT based Greenhouse Monitoring using PIC16F877A
IRJET- IoT based Greenhouse Monitoring using PIC16F877A
 
Air Quality Monitoring and Control System in IoT
Air Quality Monitoring and Control System in IoTAir Quality Monitoring and Control System in IoT
Air Quality Monitoring and Control System in IoT
 

Mais de BalamuruganV28

Final DBMS Manual (2).pdf final lab manual
Final DBMS Manual (2).pdf final lab manualFinal DBMS Manual (2).pdf final lab manual
Final DBMS Manual (2).pdf final lab manualBalamuruganV28
 
Student manual CSBS (2).pdf for operating systems lab
Student manual CSBS (2).pdf for operating systems labStudent manual CSBS (2).pdf for operating systems lab
Student manual CSBS (2).pdf for operating systems labBalamuruganV28
 
KNN.pdf k nearest neghnor classifier in machine
KNN.pdf k nearest neghnor classifier in machineKNN.pdf k nearest neghnor classifier in machine
KNN.pdf k nearest neghnor classifier in machineBalamuruganV28
 
CS 3251 Programming in c all unit notes pdf
CS 3251 Programming in c all unit notes pdfCS 3251 Programming in c all unit notes pdf
CS 3251 Programming in c all unit notes pdfBalamuruganV28
 
Object Oriented Programming All Unit Notes
Object Oriented Programming All Unit NotesObject Oriented Programming All Unit Notes
Object Oriented Programming All Unit NotesBalamuruganV28
 
CS 3491 Artificial Intelligence and Machine Learning Unit I Problem Solving
CS 3491 Artificial Intelligence and Machine Learning Unit I Problem SolvingCS 3491 Artificial Intelligence and Machine Learning Unit I Problem Solving
CS 3491 Artificial Intelligence and Machine Learning Unit I Problem SolvingBalamuruganV28
 

Mais de BalamuruganV28 (6)

Final DBMS Manual (2).pdf final lab manual
Final DBMS Manual (2).pdf final lab manualFinal DBMS Manual (2).pdf final lab manual
Final DBMS Manual (2).pdf final lab manual
 
Student manual CSBS (2).pdf for operating systems lab
Student manual CSBS (2).pdf for operating systems labStudent manual CSBS (2).pdf for operating systems lab
Student manual CSBS (2).pdf for operating systems lab
 
KNN.pdf k nearest neghnor classifier in machine
KNN.pdf k nearest neghnor classifier in machineKNN.pdf k nearest neghnor classifier in machine
KNN.pdf k nearest neghnor classifier in machine
 
CS 3251 Programming in c all unit notes pdf
CS 3251 Programming in c all unit notes pdfCS 3251 Programming in c all unit notes pdf
CS 3251 Programming in c all unit notes pdf
 
Object Oriented Programming All Unit Notes
Object Oriented Programming All Unit NotesObject Oriented Programming All Unit Notes
Object Oriented Programming All Unit Notes
 
CS 3491 Artificial Intelligence and Machine Learning Unit I Problem Solving
CS 3491 Artificial Intelligence and Machine Learning Unit I Problem SolvingCS 3491 Artificial Intelligence and Machine Learning Unit I Problem Solving
CS 3491 Artificial Intelligence and Machine Learning Unit I Problem Solving
 

Último

NO1 Pandit Amil Baba In Bahawalpur, Sargodha, Sialkot, Sheikhupura, Rahim Yar...
NO1 Pandit Amil Baba In Bahawalpur, Sargodha, Sialkot, Sheikhupura, Rahim Yar...NO1 Pandit Amil Baba In Bahawalpur, Sargodha, Sialkot, Sheikhupura, Rahim Yar...
NO1 Pandit Amil Baba In Bahawalpur, Sargodha, Sialkot, Sheikhupura, Rahim Yar...Amil baba
 
WATER CRISIS and its solutions-pptx 1234
WATER CRISIS and its solutions-pptx 1234WATER CRISIS and its solutions-pptx 1234
WATER CRISIS and its solutions-pptx 1234AafreenAbuthahir2
 
2024 DevOps Pro Europe - Growing at the edge
2024 DevOps Pro Europe - Growing at the edge2024 DevOps Pro Europe - Growing at the edge
2024 DevOps Pro Europe - Growing at the edgePaco Orozco
 
Democratizing Fuzzing at Scale by Abhishek Arya
Democratizing Fuzzing at Scale by Abhishek AryaDemocratizing Fuzzing at Scale by Abhishek Arya
Democratizing Fuzzing at Scale by Abhishek Aryaabh.arya
 
Explosives Industry manufacturing process.pdf
Explosives Industry manufacturing process.pdfExplosives Industry manufacturing process.pdf
Explosives Industry manufacturing process.pdf884710SadaqatAli
 
Fruit shop management system project report.pdf
Fruit shop management system project report.pdfFruit shop management system project report.pdf
Fruit shop management system project report.pdfKamal Acharya
 
Construction method of steel structure space frame .pptx
Construction method of steel structure space frame .pptxConstruction method of steel structure space frame .pptx
Construction method of steel structure space frame .pptxwendy cai
 
Digital Signal Processing Lecture notes n.pdf
Digital Signal Processing Lecture notes n.pdfDigital Signal Processing Lecture notes n.pdf
Digital Signal Processing Lecture notes n.pdfAbrahamGadissa
 
Event Management System Vb Net Project Report.pdf
Event Management System Vb Net  Project Report.pdfEvent Management System Vb Net  Project Report.pdf
Event Management System Vb Net Project Report.pdfKamal Acharya
 
A case study of cinema management system project report..pdf
A case study of cinema management system project report..pdfA case study of cinema management system project report..pdf
A case study of cinema management system project report..pdfKamal Acharya
 
Sachpazis:Terzaghi Bearing Capacity Estimation in simple terms with Calculati...
Sachpazis:Terzaghi Bearing Capacity Estimation in simple terms with Calculati...Sachpazis:Terzaghi Bearing Capacity Estimation in simple terms with Calculati...
Sachpazis:Terzaghi Bearing Capacity Estimation in simple terms with Calculati...Dr.Costas Sachpazis
 
CME397 Surface Engineering- Professional Elective
CME397 Surface Engineering- Professional ElectiveCME397 Surface Engineering- Professional Elective
CME397 Surface Engineering- Professional Electivekarthi keyan
 
Immunizing Image Classifiers Against Localized Adversary Attacks
Immunizing Image Classifiers Against Localized Adversary AttacksImmunizing Image Classifiers Against Localized Adversary Attacks
Immunizing Image Classifiers Against Localized Adversary Attacksgerogepatton
 
HYDROPOWER - Hydroelectric power generation
HYDROPOWER - Hydroelectric power generationHYDROPOWER - Hydroelectric power generation
HYDROPOWER - Hydroelectric power generationRobbie Edward Sayers
 
Scaling in conventional MOSFET for constant electric field and constant voltage
Scaling in conventional MOSFET for constant electric field and constant voltageScaling in conventional MOSFET for constant electric field and constant voltage
Scaling in conventional MOSFET for constant electric field and constant voltageRCC Institute of Information Technology
 
A CASE STUDY ON ONLINE TICKET BOOKING SYSTEM PROJECT.pdf
A CASE STUDY ON ONLINE TICKET BOOKING SYSTEM PROJECT.pdfA CASE STUDY ON ONLINE TICKET BOOKING SYSTEM PROJECT.pdf
A CASE STUDY ON ONLINE TICKET BOOKING SYSTEM PROJECT.pdfKamal Acharya
 
İTÜ CAD and Reverse Engineering Workshop
İTÜ CAD and Reverse Engineering WorkshopİTÜ CAD and Reverse Engineering Workshop
İTÜ CAD and Reverse Engineering WorkshopEmre Günaydın
 
Arduino based vehicle speed tracker project
Arduino based vehicle speed tracker projectArduino based vehicle speed tracker project
Arduino based vehicle speed tracker projectRased Khan
 
Cloud-Computing_CSE311_Computer-Networking CSE GUB BD - Shahidul.pptx
Cloud-Computing_CSE311_Computer-Networking CSE GUB BD - Shahidul.pptxCloud-Computing_CSE311_Computer-Networking CSE GUB BD - Shahidul.pptx
Cloud-Computing_CSE311_Computer-Networking CSE GUB BD - Shahidul.pptxMd. Shahidul Islam Prodhan
 

Último (20)

NO1 Pandit Amil Baba In Bahawalpur, Sargodha, Sialkot, Sheikhupura, Rahim Yar...
NO1 Pandit Amil Baba In Bahawalpur, Sargodha, Sialkot, Sheikhupura, Rahim Yar...NO1 Pandit Amil Baba In Bahawalpur, Sargodha, Sialkot, Sheikhupura, Rahim Yar...
NO1 Pandit Amil Baba In Bahawalpur, Sargodha, Sialkot, Sheikhupura, Rahim Yar...
 
WATER CRISIS and its solutions-pptx 1234
WATER CRISIS and its solutions-pptx 1234WATER CRISIS and its solutions-pptx 1234
WATER CRISIS and its solutions-pptx 1234
 
2024 DevOps Pro Europe - Growing at the edge
2024 DevOps Pro Europe - Growing at the edge2024 DevOps Pro Europe - Growing at the edge
2024 DevOps Pro Europe - Growing at the edge
 
Democratizing Fuzzing at Scale by Abhishek Arya
Democratizing Fuzzing at Scale by Abhishek AryaDemocratizing Fuzzing at Scale by Abhishek Arya
Democratizing Fuzzing at Scale by Abhishek Arya
 
Explosives Industry manufacturing process.pdf
Explosives Industry manufacturing process.pdfExplosives Industry manufacturing process.pdf
Explosives Industry manufacturing process.pdf
 
Fruit shop management system project report.pdf
Fruit shop management system project report.pdfFruit shop management system project report.pdf
Fruit shop management system project report.pdf
 
Construction method of steel structure space frame .pptx
Construction method of steel structure space frame .pptxConstruction method of steel structure space frame .pptx
Construction method of steel structure space frame .pptx
 
Digital Signal Processing Lecture notes n.pdf
Digital Signal Processing Lecture notes n.pdfDigital Signal Processing Lecture notes n.pdf
Digital Signal Processing Lecture notes n.pdf
 
Event Management System Vb Net Project Report.pdf
Event Management System Vb Net  Project Report.pdfEvent Management System Vb Net  Project Report.pdf
Event Management System Vb Net Project Report.pdf
 
A case study of cinema management system project report..pdf
A case study of cinema management system project report..pdfA case study of cinema management system project report..pdf
A case study of cinema management system project report..pdf
 
Standard Reomte Control Interface - Neometrix
Standard Reomte Control Interface - NeometrixStandard Reomte Control Interface - Neometrix
Standard Reomte Control Interface - Neometrix
 
Sachpazis:Terzaghi Bearing Capacity Estimation in simple terms with Calculati...
Sachpazis:Terzaghi Bearing Capacity Estimation in simple terms with Calculati...Sachpazis:Terzaghi Bearing Capacity Estimation in simple terms with Calculati...
Sachpazis:Terzaghi Bearing Capacity Estimation in simple terms with Calculati...
 
CME397 Surface Engineering- Professional Elective
CME397 Surface Engineering- Professional ElectiveCME397 Surface Engineering- Professional Elective
CME397 Surface Engineering- Professional Elective
 
Immunizing Image Classifiers Against Localized Adversary Attacks
Immunizing Image Classifiers Against Localized Adversary AttacksImmunizing Image Classifiers Against Localized Adversary Attacks
Immunizing Image Classifiers Against Localized Adversary Attacks
 
HYDROPOWER - Hydroelectric power generation
HYDROPOWER - Hydroelectric power generationHYDROPOWER - Hydroelectric power generation
HYDROPOWER - Hydroelectric power generation
 
Scaling in conventional MOSFET for constant electric field and constant voltage
Scaling in conventional MOSFET for constant electric field and constant voltageScaling in conventional MOSFET for constant electric field and constant voltage
Scaling in conventional MOSFET for constant electric field and constant voltage
 
A CASE STUDY ON ONLINE TICKET BOOKING SYSTEM PROJECT.pdf
A CASE STUDY ON ONLINE TICKET BOOKING SYSTEM PROJECT.pdfA CASE STUDY ON ONLINE TICKET BOOKING SYSTEM PROJECT.pdf
A CASE STUDY ON ONLINE TICKET BOOKING SYSTEM PROJECT.pdf
 
İTÜ CAD and Reverse Engineering Workshop
İTÜ CAD and Reverse Engineering WorkshopİTÜ CAD and Reverse Engineering Workshop
İTÜ CAD and Reverse Engineering Workshop
 
Arduino based vehicle speed tracker project
Arduino based vehicle speed tracker projectArduino based vehicle speed tracker project
Arduino based vehicle speed tracker project
 
Cloud-Computing_CSE311_Computer-Networking CSE GUB BD - Shahidul.pptx
Cloud-Computing_CSE311_Computer-Networking CSE GUB BD - Shahidul.pptxCloud-Computing_CSE311_Computer-Networking CSE GUB BD - Shahidul.pptx
Cloud-Computing_CSE311_Computer-Networking CSE GUB BD - Shahidul.pptx
 

karthi batch.docx project documentation

  • 1. I INTEGRATION OF IOT FOR ENHANCED GAS AND OIL MONITORING IN INDUSTRIAL ENVIRONMENT A PROJECT REPORT Submitted by M. KARTHIKEYAN (720320104013) S. PRANESH (720320104025) K. RAGUL (720320104028) R. VIMAL ANAND (720320104309) in partial fulfillment for the award of the degree of BACHELOR OF ENGINEERING in COMPUTER SCIENCE AND ENGINEERING AKSHAYA COLLEGE OF ENGINEERING AND TECHNOLOGY COIMBATORE - 642109 ANNA UNIVERSITY: CHENNAI 600 025 MAY 2024
  • 2. II ANNA UNIVERSITY: CHENNAI 600 025 BONAFIDE CERTIFICATE Certified that this project report “INDUSTRIAL POLLUTION MONITORING USING IOT” is the Bonafide work of “M. KARTHIKEYAN (720320104013), S.PRANESH (720320104025), K.RAGUL (720320104028), R.VIMALANAND (720320104040)” who carried out the project work under my supervision. SIGNATURE Mrs. M. Nisha, M.E., (Ph.D.), HEAD OF THE DEPARTMENT Assistant Professor (SG), Department Of Computer Science and Engineering, Akshaya college of Engineering and Technology, Kinathukadavu, Coimbatore-642109. SIGNATURE Mr. V. Balamurugan, M.E., SUPERVISOR Assistant Professor (Sr.G), Department Of Computer Science and Engineering, Akshaya college of Engineering and Technology, Kinathukadavu, Coimbatore-642109 Submitted for the Anna University project viva-voce exam, held on ……………… INTERNAL EXAMINAR EXTERNAL EXAMINAR
  • 3. III ACKNOWLEDGEMENT The success of a project depends greatly on its terms and the cooperation it receives. We take this opportunity to express our gratitude and sincere thanks to everyone who assisted us in our project. First and foremost, we would like to thank our management for the excellent infrastructure, facilities, and support provided for the successful implementation of the project We are indebted to the Director, Dr. K. THANUSHKODI, M.Sc., Ph.D., for hiscontinuous motivation, inspiring words and guidance throughout this project. We express our sincere thanks to the Joint Director, Dr. N. SUGUNA, M.E., Ph.D., for her valuable guidance and support. We express our heartfelt thanks and deep sense of gratitude to the Principal, Dr. R. RAVINDRAN, M.Tech., Ph.D., for the continuous encouragement, guidance and support. We express our sincere thanks to the Vice Principal Dr. K. SIVASANKARI, M.E., PhD., for her insightful comments and practical advice. Our special thanks to Mrs. M. NISHA, M.E., (Ph.D.), Assistant Professor (S.G) and Head of the Department of Computer Science and Engineering for her valuable guidance, continuous support and suggestions to improve the quality of the project work. We express our sincere thanks to our guide Mr. V. BALAMURUGAN, M.E., Assistant Professor (Sr.G) , Department of Computer Science and Engineering, for her valuable guidance, insightful comments and continuous support to carry out the project work. Our sincere thanks to our faculty members, family members and friends for their support and motivation to carry out the project successfully.
  • 4. IV ABSTRACT The Industrial Pollution Monitoring Using IoT project aims to address the pressing environmental concerns related to industrial pollution by leveraging the capabilities of Internet of Things (IoT) technology. Industrial activities contribute significantly to air, water, and soil pollution, posing risks to human health and ecosystems. Therefore, effective monitoring and management of industrial pollution are essential for sustainable development and environmental protection. This project proposes the deployment of IoT-based sensor networks in industrial facilities to continuously monitor key pollutants, such as particulate matter (PM), volatile organic compounds (VOCs), sulfur dioxide (SO2), nitrogen oxides (NOx), carbon monoxide (CO), and ozone (O3). These sensors will be strategically installed at various points within industrial premises to capture real-time data on pollutant concentrations and emission levels. The collected data will be transmitted wirelessly to a central IoT platform for aggregation, analysis, and visualization. Advanced analytics techniques, including machine learning algorithms, will be employed to process the data and identify patterns, trends, and anomalies in pollutant levels. Decision support systems will provide actionable insights to industrial stakeholders, enabling proactive pollution management and mitigation strategies. Furthermore, the IoT platform will facilitate real-time monitoring and remote access to pollution data for regulatory authorities, environmental agencies, and the general public. Transparency and accountability will be enhanced through data sharing and public disclosure of pollution information, fostering community engagement and environmental stewardship. The Industrial Pollution Monitoring Using IoT project aims to promote environmental sustainability, improve public health, and drive responsible industrial practices through the effective monitoring and management of pollution emissions.
  • 5. V TABLE OF CONTENTS CHAPTER TITLE PAGE NO ABSTARCT NO v LIST OF FIGURE viii LIST OF ABBREVIATIONS ix PROBLEM STATEMENT x 1 INTRODUCTION 1 1.1 Objectives 2 2 LITERATURE REVIEW 4 3 EXISTING SYSTEM 10 3.1 Introduction 10 3.2 Working 10 3.3 Drawbacks 11 4 PROPOSED SYSTEM 12 4.1 Introduction 12 4.2 Block Diagram 13 4.3 Methodology 15 4.4 Advantages 16 5 HARDWARE REQUIREMENT 17 5.1 Noise Sensor 17 5.2 Temperature Sensor 19 5.3 Humidity Sensor 20 5.4 Gas Sensor 22 5.5 Ultra Sonic Sensor 23 5.6 Bread Board Power Supply 25 5.7 Jumper Wires 26
  • 6. VI 5.8 9V Battery 27 5.9 Microcontroller Arduino UNO 29 5.10 LED Display 30 5.11 Buzzer 31 5.12 I2C 32 6 RESULT AND DISCUSSION 34 6.1 Explanation 34 6.2 Screenshots 35 7 CONCLUSION AND FUTURE ENHANCEMENT 36 7.1 Conclusion 36 7.2 Future Enhancement 37 APPENDIX 39 REFERENCES 52
  • 7. VII LIST OF FIGURES S.NO FIGURE PAGE NO 13 4.1 Block Diagram 4.2 Pin Diagram Of Arduino Uno 14 5.1 Noise Sensor 17 5.2 Temperature Sensor 19 5.3 Humidity Sensor 20 5.4 Gas Sensor 22 5.5 Ultra Sonic Sensor 23 5.6 Bread Board Power Supply 25 5.7 Jumper Wires 26 5.8 9V Battery 27 5.9 Microcontroller Arduino UNO 29 5.10 LED Display 30 5.11 Buzzer 31 5.12 I2C 32 34 6.1 Implementation 35 6.2 Result
  • 8. VIII LIST OF ABBREVIATION ABBREVIATION DESCRIPTION GSM Global System for Mobile Communication IoT Internet of Things LED Light-Emitting Diodes I2C Inter Integrated Circuit PPE Personal Protective Equipment PID Photoionization Detectors VOC Volatile Organic Compounds SMS Short Message Service
  • 9. IX PROBLEM STATEMENT The project aims to implement IoT technology for real-time gas monitoring in industrial settings, addressing the need for improved safety and efficiency. By integrating sensors with a centralized data analytics platform, the system will provide timely insights and alerts to prevent potential hazards and optimize operational processes.
  • 10. 1 CHAPTER 1 INTRODUCTION Industrial activities play a crucial role in driving economic growth and technological advancement, but they also pose significant challenges to environmental sustainability and public health due to the release of pollutants into the air, water, and soil. Industrial pollution, resulting from processes such as manufacturing, energy production, and waste disposal, has become a pressing global concern with far-reaching environmental and socioeconomic impacts. The introduction of the Industrial Pollution Monitoring Using IoT project addresses this challenge by leveraging the transformative potential of Internet of Things (IoT) technology to monitor and manage industrial pollution effectively. By deploying IoT-based sensor networks in industrial facilities, this project aims to provide real-time monitoring of key pollutants and empower stakeholders with actionable insights for pollution control and mitigation. This introduction sets the stage for understanding the significance of industrial pollution, the limitations of traditional monitoring methods, and the potential of IoT technology to revolutionize pollution monitoring and management. It highlights the need for proactive and data-driven approaches to address industrial pollution, protect the environment, and safeguard public health. Additionally, it outlines the objectives, scope, and expected outcomes of the Industrial Pollution Monitoring Using IoT project, laying the groundwork for further exploration and discussion in the subsequent sections.
  • 11. 2 1.1 OBJECTIVE Objectives for the project "Industrial Pollution Monitoring Using IoT": Develop and deploy IoT-based sensor networks to enable real-time monitoring of key pollutants emitted by industrial facilities, including particulate matter (PM), volatile organic compounds (VOCs), sulfur dioxide (SO2), nitrogen oxides (NOx), carbon monoxide (CO), and ozone (O3). Collect and aggregate pollution data from distributed sensors deployed at various points within industrial premises, ensuring comprehensive coverage and accurate measurement of pollutant concentrations and emission levels. Implement advanced analytics techniques, including machine learning algorithms, to process and analyze the collected data, identify patterns, trends, and anomalies in pollutant levels, and visualize the results in an intuitive and informative manner. Develop decision support systems that provide actionable insights to industrial stakeholders, regulatory authorities, and environmental agencies, enabling proactive pollution management and mitigation strategies based on real-time monitoring data. Enable remote access and monitoring of pollution data through an IoT platform, allowing stakeholders to access real-time data, historical trends, and predictive analytics from anywhere, anytime, via web-based interfaces or mobile applications. Promote transparency and accountability in pollution management by sharing pollution data with the public, regulatory agencies, and environmental organizations, fostering community engagement and environmental stewardship. Ensure alignment with existing regulatory frameworks and environmental standards governing industrial pollution, facilitating compliance monitoring, reporting, and enforcement activities. Design the monitoring system to be scalable and adaptable to different industrial settings, allowing for easy deployment, expansion, and customization to meet the specific requirements and challenges of diverse industries and regions. Conduct environmental impact assessments based on the collected pollution data, evaluate the effectiveness of pollution control measures,
  • 12. 3 and identify areas for improvement to minimize environmental harm and enhance sustainability. Provide training and capacity-building initiatives to industrial stakeholders, environmental professionals, and community members on the use of IoT technology for pollution monitoring and management, fostering knowledge sharing and collaboration in environmental sustainability efforts.
  • 13. 4 CHAPTER 2 LITERATURE REVIEW 1. “Design and Implementation of Smart Home Control Systems Based on Wireless Sensor Networks and Power Line Communications- Mingfu Li and Hung-Ju Lin” Wireless sensor networks (WSNs) and power line communications (PLCs) are used in this work to implement a smart home control network. The goals are to reduce the impact of wireless interference on a smart home control network and unnecessary energy consumption of a smart home. An isolated WSN with one coordinator, which is integrated into the PLC transceiver, is established in each room. The coordinator is responsible for transferring environmental parameters obtained by WSNs to the management station via PLCs. The control messages for home appliances are directly transferred using PLCs rather than WSNs. According to the experimental results, the impact of wireless interference on the proposed smart home control network is substantially mitigated. Additionally, a smart control algorithm for lighting systems and an analysis of the illumination of a fluorescent lamp were presented. The energy saving of lighting systems relative to those without smart control was evaluated. Numerical results indicate that the electricity consumption on a sunny or cloudy day can be reduced by at least 40% under the smart control. Moreover, a prototype for the proposed smart home control network with the smart control algorithm was implemented. Experimental tests demonstrate that the proposed system for smart home control networks is practically feasible and performs well.
  • 14. 5 Pros:      Cons:      Security Concerns Interoperability Challenges Limited Range Complexity Infrastructure Dependency Practical Feasibility Direct PLC Communication Isolated WSNs Energy Efficiency Reduced Wireless Interference
  • 15. 6  Decentralized Approach 2. “A Decentralized Damage Detection System for Wireless Sensor and Actuator Networks- Igor L. Santos, Luci Pirmez, Luiz R. Carmo, Paulo F. Pires, Flávia C. Delicato and Samee U. Khan” The unprecedented capabilities of monitoring and responding to stimuli in the physical world of wireless sensor and actuator networks (WSAN) enable these networks to provide the underpinning for several Smart City applications, such as structural health monitoring (SHM). In such applications, civil structures, endowed with wireless smart devices, are able to self-monitor and autonomously respond to situations using computational intelligence. This work presents a decentralized algorithm for detecting damage in structures by using a WSAN. As key characteristics, beyond presenting a fully decentralized (in-network) and collaborative approach for detecting damage in structures, our algorithm makes use of cooperative information fusion for calculating a damage coefficient. We conducted experiments for evaluating the algorithm in terms of its accuracy and efficient use of the constrained WSAN resources. We found that our collaborative and information fusion-based approach ensures the accuracy of our algorithm and that it can answer promptly to stimuli (1.091 s), triggering actuators. Moreover, for 100 nodes or less in the WSAN, the communication overhead of our algorithm is tolerable and the WSAN running our algorithm, operating system and protocols can last as long as 468 days. Pros:    Resource Efficiency  Prompt Response Time  Longevity Cooperative Information Fusion Autonomous Response
  • 16. 7 Cons:          3. “Wireless sensor networks: A survey on recent developments and potential synergies- Priyanka Rawat” Wireless sensor network (WSN) has emerged as one of the most promising technologies for the future. This has been enabled by advances in technology and availability of small, inexpensive, and smart sensors resulting in cost effective and easily deployable WSNs. However, researchers must address a variety of challenges to facilitate the widespread deployment of WSN technology in real- world domains. In this survey, we give an overview of wireless sensor networks and their application domains including the challenges that should be addressed in order to push the technology further. Then we review the recent technologies and testbeds for WSNs. Finally, we identify several open research issues that need to be investigated in future. Our survey is different from existing surveys in that we focus on recent developments in wireless sensor network technologies. We review the leading research projects, standards and technologies, and platforms. Moreover, we highlight a recent phenomenon in WSN research that is to explore synergy between sensor networks and other technologies and explain how this can help sensor networks achieve their full potential. This paper intends to help new researchers entering the domain of WSNs by providing a comprehensive survey on recent developments. Security Concerns Maintenance Requirements Scalability Accuracy Dependencies Coordination Challenges Complexity
  • 17. 8 Pros:   Ease of deployment  Versatility  Real-time monitoring  Scalability  Integration with other technologies Cons:  Limited power  Data security and privacy concerns  Reliability and robustness  Complexity  Maintenance challenges    4. “Enhancing Security and Efficiency in IoT-Based Oil & Gas Pipeline Monitoring Systems with a Novel Lightweight Cryptography Framework - Zaria, Kaduna, Nigeria” The oil and gas industry relies heavily on the seamless and secure operation of pipelines to transport valuable resources. In this context, the integration of Internet of Things (IoT) technologies offers the potential to enhance monitoring systems, providing real-time insights and data-driven decision-making. This study presents a novel framework for IoT-based oil and gas pipeline monitoring, designed to bolster security, data accuracy, and operational efficiency. The framework encompasses strategic sensor placement, a rotational cluster head selection scheme, efficient data aggregation, and robust data encryption using the ASCON-128 Cipher. By strategically positioning IoT sensors and employing advanced data aggregation techniques, redundant data transmission is minimized, significantly improving the accuracy and efficiency of data Standardization and interoperability Cost-effectiveness
  • 18. 9 collection. Additionally, the rotational cluster head selection scheme optimizes power consumption, extending the operational lifespan of IoT devices. While this framework is currently in the conceptual phase, it holds great promise for addressing industry-specific challenges. Future work should focus on practical implementations, security protocol development, performance evaluations, scalability assessments, user authentication enhancements, and system integration. Pros:      Cons:      Regulatory Compliance Maintenance Requirements Scalability Challenges Security Risks Complex Implementation Industry-specific Customization Operational Efficiency Enhanced Security Improved Data Accuracy Enhanced Monitoring Capabilities
  • 19. 10  CHAPTER 3 EXISTING SYSTEM 3.1 INTRODUCTION In the existing system of industrial pollution monitoring, traditional methods are predominantly used, which often rely on periodic manual sampling and laboratory analysis. 3.2WORKING 1. MANUAL SAMPLING Industrial pollution monitoring in many regions is primarily conducted through manual sampling methods, where environmental agencies or regulatory bodies collect samples of air, water, or soil from industrial sites at predetermined intervals. 2. LABORATORY ANALYSIS The collected samples are then transported to laboratories for analysis, where specialized equipment and techniques are used to measure pollutant concentrations and identify contaminants. 3. FIXED MONITORING STATIONS Some industrial areas may have fixed monitoring stations installed by regulatory authorities to continuously monitor air quality, water quality, or other environmental parameters. These stations typically use conventional monitoring instruments such as gas analyzers, particulate samplers, and weather sensors.
  • 20. 11 4. DATA REPORTING AND COMPLIANCE The data collected through manual sampling or fixed monitoring stations are reported to regulatory agencies for compliance monitoring and enforcement purposes. Industries are required to adhere to environmental regulations and emission standards set by government authorities. 3.3 DRAWBACKS Despite its widespread use, the existing system of industrial pollution monitoring has several limitations. Manual sampling methods are labor-intensive, time-consuming, and often provide only snapshot data, which may not accurately reflect real-time pollution levels. Fixed monitoring stations have limited coverage and may not capture localized pollution hotspots or dynamic changes in pollutant concentrations. 1. LIMITED ACCESSIBILITY Additionally, data from traditional monitoring methods may not be easily accessible to the public or other stakeholders, limiting transparency and community engagement in pollution management efforts. 2. REGULATORY COMPLIANCE Industries may struggle to comply with environmental regulations due to the challenges associated with monitoring and managing pollution effectively using conventional methods. Lack of real-time data and actionable insights may hinder proactive pollution control measures.
  • 21. 12 CHAPTER 4 PROPOSED SYSTEM 4.1 INTRODUCTION The proposed system for industrial pollution monitoring aims to overcome the limitations of the existing system by leveraging Internet of Things (IoT) technology to enable real-time monitoring, data analytics, and decision support. IoT sensors have the ability to continuously monitor a variety of contaminants in real-time, giving immediate input on the levels of pollution. This makes it possible to identify any unusual emissions or environmental disruptions quickly and to take appropriate action to stop any potential harm. Advanced analytics methods can be used to examine the data gathered by IoT sensors. Large data sets can be processed to find patterns, trends, and correlations that aid in a more thorough understanding of the sources of pollutants, patterns of emissions, and the effects these have on the environment. Industrial equipment predictive maintenance can also be facilitated by IoT-enabled devices. Through real-time monitoring of parameters like temperature, pressure, and performance indicators, equipment breakdowns can be detected in advance, minimizing downtime and averting unintentional pollution releases. With the use of Internet of Things (IoT) technologies, operators may monitor pollution levels and operate equipment remotely from any location with an internet connection. This adaptability improves operational effectiveness and facilitates prompt resolution of any new problems. Regulatory rules and environmental models can be integrated with IoT data to create decision support systems. These systems give stakeholders useful information and suggestions that they may use to reduce pollution, follow rules, and enhance environmental performance in general.
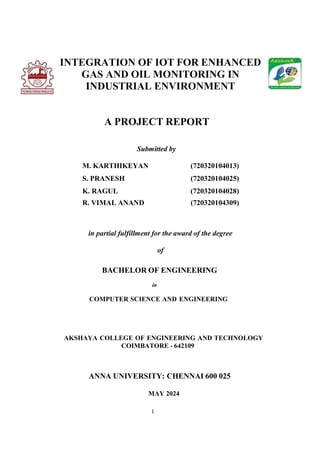
  • 22. 13 4.2 BLOCK DIAGRAM Figure 4.1 Block diagram of proposed system
  • 23. 14 Figure 4.2 Pin Diagram Of Arduino Uno
  • 24. 15 4.3 METHODOLOGY Deploy IoT-based sensor networks in industrial facilities to continuously monitor key pollutants, including particulate matter (PM), volatile organic compounds (VOCs), sulfur dioxide (SO2), nitrogen oxides (NOx), carbon monoxide (CO), and ozone (O3). These sensors will be strategically installed at various points within industrial premises to capture real-time data on pollutant concentrations and emission levels. Utilize wireless connectivity technologies such as Wi-Fi, LoRaWAN, or cellular networks to transmit pollution data from the sensors to a central IoT platform for aggregation and analysis. This enables seamless communication between distributed sensors and centralized data management systems, ensuring comprehensive coverage and timely data collection. Implement advanced data analytics techniques, including machine learning algorithms and statistical modeling, to process and analyze the collected data. Identify patterns, trends, and anomalies in pollutant levels, and visualize the results through interactive dashboards and reports. This provides stakeholders with actionable insights for pollution control and mitigation strategies. Develop decision support systems that integrate real-time pollution data with environmental regulations, emission standards, and industry best practices. Provide stakeholders, including industrial managers, regulatory authorities, and environmental agencies, with personalized recommendations and alerts to facilitate proactive pollution management and compliance monitoring. Enable remote monitoring and access to pollution data through web-based interfaces or mobile applications. Stakeholders can access real-time data, historical trends, and predictive analytics from anywhere, anytime, facilitating informed decision- making and rapid response to pollution events. Integrate the IoT pollution monitoring system with existing environmental management systems, including air quality monitoring networks, water quality monitoring stations, and meteorological data sources. This enables cross-domain data integration and
  • 25. 16 holistic environmental assessment, supporting comprehensive pollution monitoring and management efforts. Foster community engagement and transparency in pollution management by sharing pollution data with the public through open data platforms, interactive maps, and public awareness campaigns. Empower citizens to actively participate in environmental stewardship and advocacy efforts. Design the IoT pollution monitoring system to be scalable and adaptable to different industrial settings, allowing for easy deployment, expansion, and customization. Ensure interoperability with existing infrastructure and compatibility with emerging IoT technologies to future-proof the system. 4.4 ADVANTAGES  Real-time monitoring  Comprehensive data collection  Advanced analytics  Cost-effectiveness  Remote access  Compliance support  Improved environmental management
  • 26. 17 CHAPTER 5 HARDWARE REQUIREMENT  Noise Sensor  Temperature Sensor  Humidity Sensor  Gas Sensor  Ultrasonic Sensor  Float Sensor  Bread Board Power Supply  Jummper Wires  9v Battery  Microcontroller Arduino UNO  LED Display  Buzzer  I2C 5.1 NOISE SENSOR Figure 5.1 Noise Sensor A noise sensor, also known as a sound sensor or acoustic sensor, is a device that detects and measures sound levels in its environment. Noise sensors typically work by converting sound waves into electrical signals. They contain a
  • 27. 18 microphone or transducer that converts variations in air pressure caused by sound waves into electrical signals, which are then processed and analyzed to determine the intensity or level of sound. Noise sensors are capable of detecting sound levels across a wide range, from low-level ambient noise to high-intensity sounds such as explosions or machinery operation. The detection range depends on factors such as the sensitivity of the sensor and the frequency range it is designed to detect. Noise sensors can be designed to respond to specific frequency ranges of sound waves, such as infrasound (below 20 Hz), audible sound (20 Hz to 20 kHz), or ultrasound (above 20 kHz). The frequency response of the sensor determines its suitability for different applications and environments. Noise sensors typically provide an output signal proportional to the sound level detected in decibels (dB). This output signal can be analog (e.g., voltage or current) or digital (e.g., pulse- width modulation or serial data), depending on the sensor's design and interface requirements. Noise sensors find applications in various industries and scenarios, including environmental monitoring, industrial hygiene, occupational safety, transportation, smart cities, and home automation. They are used to measure noise pollution levels, monitor machinery operation, detect alarm signals, and trigger automated responses based on sound events. Noise sensors can be interfaced with microcontrollers, data loggers, or other electronic devices using analog or digital input pins. They require minimal external components and can be integrated into existing systems with relative ease. Some noise sensors may require calibration to ensure accurate measurement of sound levels. Calibration procedures typically involve comparing the sensor's output to reference standards or calibrated sound sources and adjusting calibration factors accordingly. Environmental factors such as temperature, humidity, and air pressure can affect the performance of noise sensors. Some sensors may include compensation algorithms or environmental enclosures to minimize the impact of environmental conditions on measurement accuracy.
  • 28. 19 5.2 TEMPERATURE SENSOR Figure 5.2 Temperature Sensor A temperature sensor is a device that measures ambient temperature and converts it into an electrical signal. Temperature sensors operate based on various principles, including resistance, voltage, capacitance, and infrared radiation. The most common types of temperature sensors include thermocouples, resistance temperature detectors (RTDs), thermistors, and integrated circuit (IC) temperature sensors. Each type of sensor has its own working principle and characteristics. Temperature sensors are capable of measuring temperatures across a wide range, from sub-zero temperatures to high temperatures encountered in industrial processes. The detection range depends on the type of sensor and its specifications. The accuracy and precision of temperature sensors vary depending on factors such as sensor type, calibration, and environmental conditions. High- precision sensors are capable of providing accurate temperature measurements with minimal error, making them suitable for applications where precise temperature control is critical. Temperature sensors typically provide an output signal proportional to the temperature being measured. This output signal can be analog (e.g., voltage or resistance) or digital (e.g., serial data or pulse-width modulation), depending on the sensor's design and interface requirements. Temperature sensors find applications in various industries and scenarios, including HVAC (heating, ventilation, and air conditioning) systems, automotive, aerospace, medical devices, food processing, and environmental monitoring. They are used for temperature control, monitoring, and safety purposes in
  • 29. 20 equipment, processes, and environments. Temperature sensors can be interfaced with microcontrollers, data loggers, or other electronic devices using analog or digital input pins. They require minimal external components and can be integrated into existing systems with relative ease. Calibration is essential to ensure the accuracy and reliability of temperature measurements. Temperature sensors may require periodic calibration to maintain their performance over time. Calibration procedures involve comparing the sensor's output to reference standards or calibrated temperature sources and adjusting calibration factors accordingly. Environmental factors such as temperature gradients, humidity, and electromagnetic interference can affect the performance of temperature sensors. Some sensors may include compensation algorithms or environmental enclosures to minimize the impact of environmental conditions on measurement accuracy. 5.3 HUMIDITY SENSOR Figure 5.3 Humidity Sensor A humidity sensor, also known as a hygrometer, is a device that measures the moisture content or relative humidity (RH) in the air. Humidity sensors operate based on various principles, including capacitive, resistive, and thermal conductivity. The most common type of humidity sensor is the capacitive humidity sensor, which measures changes in capacitance caused by water vapor adsorption or absorption on a sensing element. Humidity sensors are capable of
  • 30. 21 measuring relative humidity across a wide range, typically from 0% to 100% RH. The detection range depends on the type of sensor and its specifications. The accuracy and precision of humidity sensors vary depending on factors such as sensor type, calibration, and environmental conditions. High-precision sensors are capable of providing accurate humidity measurements with minimal error, making them suitable for applications where precise humidity control is critical. Humidity sensors typically provide an output signal proportional to the relative humidity being measured. This output signal can be analog (e.g., voltage or resistance) or digital (e.g., serial data or pulse-width modulation), depending on the sensor's design and interface requirements. Humidity sensors find applications in various industries and scenarios, including HVAC (heating, ventilation, and air conditioning) systems, weather monitoring, agriculture, pharmaceuticals, and industrial processes. They are used for humidity control, comfort monitoring, and safety purposes in environments where humidity levels need to be regulated. Humidity sensors can be interfaced with microcontrollers, data loggers, or other electronic devices using analog or digital input pins. They require minimal external components and can be integrated into existing systems with relative ease. Calibration is essential to ensure the accuracy and reliability of humidity measurements. Humidity sensors may require periodic calibration to maintain their performance over time. Calibration procedures involve exposing the sensor to reference humidity sources at known humidity levels and adjusting calibration factors accordingly. Environmental factors such as temperature, air flow, and chemical exposure can affect the performance of humidity sensors. Some sensors may include compensation algorithms or environmental enclosures to minimize the impact of environmental conditions on measurement accuracy.
  • 31. 22 5.4 GAS SENSOR Figure 5.4 Gas Sensor A gas sensor is a device that detects the presence or concentration of gases in the surrounding environment. Gas sensors are used in various applications, including industrial safety, environmental monitoring, air quality assessment, and indoor/outdoor air pollution detection. Gas sensors operate based on different principles depending on the type of gas being detected. Common gas sensing principles include. Gas sensors based on chemical reactions involve a reaction between the gas molecules and a sensing material, resulting in a change in electrical conductivity or other measurable properties. Electrochemical gas sensors use electrodes immersed in an electrolyte to detect gases through chemical reactions that produce an electric current proportional to the gas concentration. Semiconductor gas sensors rely on the change in electrical conductivity of a semiconductor material when exposed to gas molecules, leading to a measurable change in resistance. Optical gas sensors detect gases by measuring the absorption or scattering of light by gas molecules. This principle is often used in infrared (IR) gas sensors and laser-based gas detectors. Gas sensors are capable of detecting a wide range of gases, including toxic gases, combustible gases, and environmental pollutants. The detection range depends on the type of sensor and the specific gas being detected, with some sensors specialized for specific gases while others are more general-purpose. The accuracy and sensitivity of gas sensors vary depending on factors such as sensor type, calibration, and environmental conditions. High-
  • 32. 23 quality sensors are capable of providing accurate and reliable measurements with minimal false alarms and detection limits. Gas sensors typically provide an output signal proportional to the gas concentration being measured. This output signal can be analog (e.g., voltage or current) or digital (e.g., serial data or pulse-width modulation), depending on the sensor's design and interface requirements. Gas sensors find applications in various industries and scenarios, including industrial safety (e.g., gas leak detection in chemical plants), environmental monitoring (e.g., detecting air pollutants in urban areas), automotive (e.g., vehicle emissions monitoring), and indoor air quality assessment (e.g., detecting carbon monoxide in homes). Gas sensors can be interfaced with microcontrollers, data loggers, or other electronic devices using analog or digital input pins. They require minimal external components and can be integrated into existing systems with relative ease. Calibration is essential to ensure the accuracy and reliability of gas sensor measurements. Gas sensors may require periodic calibration to maintain their performance over time. Calibration procedures involve exposing the sensor to known gas concentrations and adjusting calibration factors accordingly. Environmental factors such as temperature, humidity, and cross-sensitivity to other gases can affect the performance of gas sensors. Some sensors may include compensation algorithms or environmental enclosures to minimize the impact of environmental conditions on measurement accuracy. 5.5 ULTRA SONIC SENSOR Figure 5.5 Ultra Sonic Sensor An ultrasonic sensor is a device that measures distances to objects by emitting ultrasonic sound waves and analyzing the time it takes for the sound waves to bounce back. Ultrasonic sensors operate based on the principle of
  • 33. 24 echolocation, similar to how bats navigate in the dark. The sensor emits high- frequency sound waves (typically ultrasonic waves with frequencies above the range of human hearing, around 20 kHz to 200 kHz) towards the target object. These sound waves propagate through the air until they encounter an object in their path. Upon striking the object, the sound waves are reflected back towards the sensor. Ultrasonic sensors can measure distances ranging from a few centimeters to several meters, depending on the sensor's design and specifications. Short-range sensors are commonly used for proximity sensing and obstacle detection in robotics and automation applications, while long-range sensors are used for distance measurement in industrial and automotive systems. The accuracy and precision of ultrasonic sensors depend on factors such as the sensor's resolution, beam width, and environmental conditions. High-quality sensors with narrow beam widths and advanced signal processing algorithms can provide precise distance measurements with minimal errors. Ultrasonic sensors typically provide an output signal proportional to the distance to the target object. This output signal can be analog (e.g., voltage or current) or digital (e.g., pulse- width modulation or serial data), depending on the sensor's design and interface requirements. Ultrasonic sensors find applications in various industries and scenarios, including robotics, industrial automation, automotive parking assistance systems, object detection and tracking, liquid level measurement, and presence detection in security systems. They are used for proximity sensing, collision avoidance, distance measurement,and object localization in diverse environments. Ultrasonic sensors can be interfaced with microcontrollers, data loggers, or other electronic devices using analog or digital input pins. They require minimal external components and can be integrated into existing systems with relative ease. Environmental factors such as temperature, humidity, and air pressure can affect the performance of ultrasonic sensors. Some sensors may include compensation algorithms or environmental enclosures to minimize the impact of environmental conditions.
  • 34. 25 5.6 BREAD BOARD POWER SUPPLY Figure 5.6 Bread Board Power Supply The breadboard is a fundamental tool used in electronics prototyping and circuit design. A breadboard is typically a rectangular plastic board with a grid of holes arranged in rows and columns. The holes are interconnected internally in a specific pattern, allowing components to be easily inserted and connected without soldering. The breadboard consists of multiple terminal strips arranged in parallel rows. Each terminal strip typically contains multiple interconnected holes, usually grouped in sets of five, known as "tie points." In addition to the terminal strips, the breadboard often includes one or more pairs of horizontal bus strips running along the length of the board. These bus strips provide additional connections for power (usually labeled as + and -) and ground (usually labeled as GND). Electronic components such as resistors, capacitors, integrated circuits, and jumper wires are inserted into the holes on the breadboard. Components with two or more leads (pins) are usually inserted across adjacent tie points to establish electrical connections. When components are inserted into the breadboard, their leads make electrical contact with the metal clips or springs inside the holes, establishing connections between them. This allows components to be easily interconnected without the need for soldering. Breadboards are commonly used for prototyping and testing electronic circuits before they are soldered onto a more permanent circuit board. Components can be easily added, removed, and
  • 35. 26 rearranged on the breadboard, facilitating iterative design and experimentation. One of the key advantages of breadboards is that they are reusable. Components can be inserted and removed multiple times without damaging the board, making breadboards ideal for rapid prototyping and experimentation. While breadboards are great for prototyping, they have limitations in terms of high-frequency operation, reliability, and durability compared to soldered circuits. Therefore, breadboards are typically used for low-frequency circuits, testing, and educational purposes. 5.7 JUMPER WIRES Figure 5.7 Jumper Wires Jumper wires are essential components in electronics prototyping and circuit building. Jumper wires are used to create electrical connections between various components on a breadboard or between different points on a circuit board. They allow for easy and temporary connections without the need for soldering. Jumper wires consist of insulated wire with a solid core or stranded core. The insulation material can be plastic or silicone, providing electrical insulation and flexibility. Jumper wires typically have connector pins or clips at each end. The most common types of connectors are male pins, female sockets, and alligator clips. These connectors allow jumper wires to be easily plugged into or clipped onto components or connection points. Jumper wires come in various lengths, ranging from a few centimeters to several inches or longer. They are often color-coded to aid in organization and identification of connections within a circuit. Common colors include red, black, blue, green, yellow, and white. Jumper
  • 36. 27 wires are flexible and bendable, allowing them to be routed and manipulated to make connections in tight spaces or complex circuits. The flexibility of jumper wires makes them versatile for use in a wide range of electronic projects. Jumper wires are reusable and can be easily disconnected and reconnected as needed. This makes them ideal for prototyping, experimentation, and iterative design in electronics projects. TYPES OF JUMPER WIRES: Male-to-Male: Both ends of the wire have male pins, suitable for connecting components with female headers or sockets. Male-to-Female: One end has male pins, and the other end has female sockets, allowing for connections between components with different types of connectors. Female-to-Female: Both ends have female sockets, useful for extending the reach of male headers or sockets. Jumper wires are commonly used in bread boarding, circuit prototyping, Arduino projects, Raspberry Pi projects, robotics, and educational electronics. They enable quick and temporary connections between components, facilitating the testing and development of electronic circuits. 5.8 9V BATTERY Figure 5.8 9V Battery A 9V battery is a compact and commonly used power source in electronics for
  • 37. 28 providing portable and easy-to-use power to various devices. As the name suggests, the 9V battery provides a nominal voltage of 9 volts. This voltage is higher than typical AA or AAA batteries, making it suitable for devices that require higher operating voltages. The most common type of 9V battery is the rectangular-shaped "transistor" battery, which typically uses six cylindrical cells connected in series. These cells are often zinc-carbon (carbon-zinc) or alkaline chemistry, although rechargeable nickel-metal hydride (NiMH) and lithium-ion(Li- ion) 9V batteries are also available. The 9V battery is characterized by its rectangular shape with a snap connector on the top. It is commonly used in devices such as smoke detectors, multimeters, wireless microphones, guitar pedals, and various small electronic gadgets. The capacity of a 9V battery refers to the amount of electrical charge it can store and deliver. This capacity is typically measured in milliamp ere-hours (mAh) or ampere-hours (Ah) and varies depending on the battery chemistry and manufacturer. Alkaline 9V batteries typically have higher capacities compared to carbon-zinc batteries. 9V batteries are widely used in applications where a compact and portable power source is required. They are often used in devices that do not require continuous high current draw but instead rely on intermittent or low-power operation. When a 9V battery is depleted, it should be replaced with a new battery of the same type and chemistry. Used batteries should be disposed of properly according to local regulations, as they may contain hazardous materials. Rechargeable 9V batteries are available in nickel-metal hydride (NiMH) and lithium-ion (Li-ion) chemistries. These rechargeable batteries can be recharged using compatible battery chargers, offering a more cost-effective and environmentally friendly alternative to single- use batteries. When using 9V batteries, it's essential to consider factors such as voltage compatibility with the device, battery life, and the cost-effectiveness of rechargeable options, especially for high-drain applications or devices that require frequent battery replacement.
  • 38. 29 5.9 MICROCONTROLLER ARDUINO UNO Figure 5.9 Microcontroller Arduino UNO Arduino UNO is a microcontroller board based on the ATmega328P. It has 14 digital input/output pins (of which 6 can be used as PWM outputs), 6 analog inputs, a 16 MHz ceramic resonator, a USB connection, a power jack, an ICSP header and a reset button. Arduino UNO is a low-cost, flexible, and easy- to- use programmable open-source microcontroller board that can be integratedinto a variety of electronic projects. This board can be interfaced with other Arduino boards, Arduino shields, Raspberry Pi boards and can control relays,LEDs, servos, and motors as an output. The Arduino board can be powered usinga USB cable from a computer or AC mains power supply by connecting it to the Barrel Jack. The voltage regulator controls the voltage given to the board and stabilizes the DC voltages used by the processor and other elements. The crystal oscillator helps Arduino deal with time issues, with a frequency of 16,000,000 Hertz or 16 MHz. To reset the Arduino board, use the reset button on the board or connect an external reset button to the RESET pin. The board has six analog input pins A0 through A5, which can read signals from analog sensors and convert them into digital values. Each Arduino board has its own main microcontroller, which is usually of the ATMEL Company. The ICSP pin, a tiny programming header for the Arduino, is often referred to as an SPI (Serial Peripheral Interface), which is an "expansion" of the output.The power LED indicator should light up when plugged into a power source to indicate the board is powered up correctly. The TX
  • 39. 30 and RX LEDs, labeled TX (transmit) and RX (receive), flash at different speeds during serial communication. Digital I/O is a crucial component of the Arduino board, allowing the board to communicate with the microprocessor. The Arduino UNO board has 14 digital I/O pins (15) (of which 6 provide PWM (Pulse Width Modulation) output. These pins can be configured to work as input digital pins to read logic values (0 or 1) or as digital output pins to drive different modules like LEDs, relays, etc. The pins labeled “~” can be used to generate PWM. AREF stands for Analog Reference. It is sometimes, used to set an external reference voltage (between 0 and 5 Volts) as the upper limit for the analog input pins. 5.10 LED DISPLAY Figure 5.10 LED Display A LED (Light Emitting Diode) display is a revolutionary visual technology that utilizes an array of LEDs to produce images, text, or videos. Its fundamental components are semiconductor diodes that emit light when an electric current passes through them. These displays offer several advantages over traditional technologies, including superior brightness, vibrant colors, energy efficiency, and durability. LED displays are commonly used in various applications, such as outdoor advertising billboards, stadium scoreboards, indoor digital signage, and large-scale video walls. One of the key benefits of LED displays is their high brightness, which ensures excellent visibility even in brightly lit environments or during daylight. Their vibrant colors and dynamic contrast ratio make them particularly eye-catching, capturing the attention of audiences effectively. Moreover, LED technology is inherently energy-efficient, consuming significantly
  • 40. 31 less power compared to conventional display technologies like incandescent bulbs or fluorescent tubes. This not only reduces operating costs but also contributes to environmental sustainability. Another advantage of LED displays is their durability and longevity. LED diodes have a longer lifespan and are more resistant to shock, vibration, and temperature fluctuations than traditional display elements. Additionally, LED displays are often designed with modular panels, allowing for easy maintenance and repair. This modular design also offers flexibility in size and shape, enabling the creation of custom display configurations to suit specific needs. Advanced control systems manage the content displayed on LED screens, enabling dynamic and interactive visual experiences. These systems can integrate with various input sources, including computers, media players, and sensors, allowing for real-time updates and customization of content. With ongoing technological advancements, LED displays continue to evolve, offering higher resolutions, improved color accuracy, and enhanced functionalities, driving their widespread adoption in diverse industries worldwide. 5.11BUZZER Figure 5.11 Buzzer A buzzer is an electromechanical device that generates sound when an electrical signal is applied to it. It typically consists of a coil of wire (electromagnet) attached to a diaphragm or a piezoelectric element. When an electrical current passes through the coil, it creates a magnetic field that causes the diaphragm to vibrate, producing sound waves. Buzzer designs vary based on their intended application and the desired sound output. Some buzzers are simple and
  • 41. 32 produce a single tone, while others are more complex and can generate a variety of tones, melodies, or even voice messages. The frequency and intensity of the sound produced by a buzzer can often be controlled by adjusting the voltage or frequency of the electrical signal applied to it. Buzzers are commonly used in a wide range of electronic devices and systems for various purposes. In consumer electronics, they are found in devices such as alarm clocks, timers, and household appliances to provide audible alerts or notifications. In industrial applications, buzzers are often used as warning signals or indicators to alert operators of potential hazards, equipment malfunctions, or process completion. Additionally, buzzers are frequently employed in electronic games and toys to provide audio feedback and enhance the user experience. They are also used in security systems, automotive electronics, medical devices, and telecommunications equipment, among many other applications. Overall, buzzers play a vital role in providing auditory feedback and alerts in numerous electronic devices and systems, contributing to their functionality, safety, and usability. 5.12 I2C Figure 5.12 I2C I2C, short for Inter-Integrated Circuit, is a widely used serial communication protocol in the realm of electronics. Developed by Philips Semiconductor, now NXP Semiconductors, in the early 1980s, it has become a cornerstone for connecting integrated circuits in various applications. The simplicity and efficiency of I2C stem from its utilization of only two wires: a
  • 42. 33 serial data line (SDA) and a serial clock line (SCL). This minimalist approach enables seamless communication between devices while conserving valuable resources such as pins and board space. I2C operates on a master-slave architecture, where a master device initiates and controls communication with one or more slave devices. Each slave device on the bus is assigned a unique address, allowing the master to address specific slaves for data exchange. The versatility of I2C makes it invaluable across a spectrum of applications. One prominent use of I2C is in sensor interfacing. Many sensors, such as temperature sensors, accelerometers, and gyroscopes, utilize I2C for transmitting data to microcontrollers or other processing units. Additionally, I2C is commonly employed in memory storage devices like EEPROMs (Electrically Erasable Programmable Read-Only Memory) for configuration and data storage purposes. Moreover, I2C finds extensive use in controlling peripheral devices such as LCD displays, motor drivers, and LED controllers. Its ability to connect multiple devices using minimal wiring makes it particularly suitable for complex systems where space and wiring constraints are critical considerations. Overall, I2C's simplicity, efficiency, and versatility have made it a preferred choice for communication between integrated circuits in a diverse range of applications, spanning from consumer electronics to industrial automation and beyond.
  • 43. 34 CH C A H PA TE PR TE 6R 6 RESULT AND DISCUSSION RESULT AND DISCUSSION 6.1EXPLANATION The aim of this system is to aid in reducing respiratory problems due to industrial activities and to monitor the level of air pollution. The main focus is on finding solutions to the increasing problem of harmful gasses amounting from industrial practices in the country. In our research, we implemented sensors to be used to detect the presence of undesired gases in the air of residential areas near factories and industrial activities. The sensors provide continuous monitoring and record data for air pollution continuously, where these results are reported and analyzed using Internet of Things technology. Figure 6.1 Implementation
  • 45. 36 CHAPTER 7 CONCLUSION AND FUTURE ENHANCEMENT 7.1 CONCLUSION The proposed system for industrial pollution monitoring using Internet of Things (IoT) technology represents a significant advancement in environmental monitoring and management. By leveraging IoT sensor networks, wireless connectivity, and advanced data analytics, the proposed system offers real-time monitoring, actionable insights, and enhanced transparency in pollution control and mitigation efforts. The integration of IoT technology enables continuous monitoring of key pollutants in industrial facilities, providing stakeholders with timely and accurate data on pollution levels. This facilitates proactive decision- making, rapid response to pollution events, and improved regulatory compliance. Additionally, the proposed system promotes community engagement and transparency by sharing pollution data with the public and fostering environmental awareness and advocacy. Overall, the proposed system has the potential to revolutionize industrial pollution monitoring and management practices, leading to cleaner environments, healthier communities, and sustainable industrial development. By embracing IoT technology and innovative approaches to pollution control, industrial stakeholders can contribute to a greener and more sustainable future for generations to come.
  • 46. 37 7.2FUTURE ENHANCEMENT The future scope of industrial pollution monitoring using IoT technology holds immense potential for further advancements and applications. Continued advancements in sensor technology, including miniaturization, improved sensitivity, and multi-parameter sensing capabilities, will enhance the accuracy and efficiency of pollution monitoring systems. Integration of emerging sensor technologies such as nano sensors and biosensors could enable real-time detection of a broader range of pollutants with higher precision. Integration of edge computing and artificial intelligence (AI) techniques, such as machine learning and deep learning algorithms, will enable real-time data processing and analysis at the edge of the network. This will reduce latency, optimize bandwidth usage, and enable more intelligent decision-making capabilities directly at the sensor nodes. The use of predictive analytics models will enable the prediction of future pollution trends and identification of potential pollution hotspots based on historical data, environmental parameters, and weather forecasts. This proactive approach will facilitate early intervention and preventive measures to mitigate pollution risks and protect ecosystems. Integration of industrial pollution monitoring systems with smart city initiatives will enable holistic environmental monitoring and management at the urban scale. Data integration from various sources, including traffic monitoring, weather stations, and air quality sensors, will provide comprehensive insights into the environmental health of cities and support evidence-based policymaking. The use of blockchain technology will enhance data security, integrity, and transparency in pollution monitoring systems. Blockchain-based solutions can provide immutable records of pollution data, enabling stakeholders to verify the authenticity and traceability of environmental data, while ensuring data privacy and confidentiality. Development of collaborative platforms and data-sharing initiatives among industrial stakeholders, regulatory agencies, academic institutions, and communities will promote knowledge exchange, best practices sharing, and collective action for pollution
  • 47. 38 control and environmental sustainability. Citizen science initiatives and crowdsourced pollution monitoring programs will empower citizens to actively participate in environmental monitoring and advocacy efforts. Mobile apps, citizen science platforms, and community-driven monitoring projects will engage citizens in data collection, analysis, and reporting, fostering environmental awareness and civic engagement. Establishment of global monitoring networks and interoperable standards for pollution monitoring data exchange will facilitate cross-border collaboration, harmonization of monitoring protocols, and benchmarking of pollution levels on a global scale. This will enable coordinated efforts to address transboundary pollution challenges and achieve global environmental goals.
  • 48. 39 APPENDIX Arduino Coding to connect Noise Sensor: // Analog noise sensor connected to analog pin A0 const int noiseSensorPin = A0; // Digital noise sensor connected to digital pin 2 const int digitalNoiseSensorPin = 2; void setup() { Serial.begin(9600); // Initialize serial communication for debugging } void loop() { // Read analog value from the noise sensor int analogNoiseValue = analogRead(noiseSensorPin); // Read digital value from the noise sensor int digitalNoiseValue = digitalRead(digitalNoiseSensorPin); // Print the values to serial monitor Serial.print("Analog Noise Value: "); Serial.println(analogNoiseValue); Serial.print("DigitalNoise Value: ");
  • 49. 40 APPENDIX Arduino Coding to connect Temperature Sensor: #include <OneWire.h> #include <DallasTemperature.h> // Data wire is connected to pin 2 on the Arduino #define ONE_WIRE_BUS 2 // Setup a oneWire instance to communicate with any OneWire devices OneWire oneWire(ONE_WIRE_BUS); // Pass our oneWire reference to Dallas Temperature sensor DallasTemperature sensors(&oneWire); void setup() { Serial.begin(9600); sensors.begin(); // Initialize the sensor }void loop() { sensors.requestTemperatures(); // Request temperature readings float temperatureC = sensors.getTempCByIndex(0); // Get temperature in Celsius Serial.print("Temperature: "); Serial.print(temperatureC);
  • 50. 41 APPENDIX Arduino Coding to connect Ultra Sonic Sensor: // Define pins for ultrasonic sensor const int trigPin = 7; // Trigger pin const int echoPin =6; // Echo pin void setup() { Serial.begin(9600); // Initialize serial communication for debugging pinMode(trigPin, OUTPUT); pinMode(echoPin, INPUT); } void loop() { long duration, distance; // Send a 10us pulse to trigger pin digitalWrite(trigPin, LOW); delayMicroseconds(2); digitalWrite(trigPin, HIGH); delayMicroseconds(10); digitalWrite(trigPin, LOW);
  • 51. 42 duration = pulseIn(echoPin, HIGH); // Calculate distance in cm distance = duration * 0.034 / 2; // Print distance to serial monitor Serial.print("Distance: "); Serial.print(distance); Serial.println(" cm"); delay(1000); // Delay for stability }
  • 52. 43 APPENDIX Arduino coding to connect Gas Sensor: // Define pin connections const int AOUT_pin = A0; // Analog output pin const int DOUT_pin = 2; // Digital output pin void setup() { Serial.begin(9600); // Initialize serial communication for debugging pinMode(DOUT_pin, INPUT); // Set digital pin as input } void loop() { // Read analog value from the sensor int sensorValue = analogRead(AOUT_pin); // Read digital value from the sensor int digitalValue = digitalRead(DOUT_pin); // Print values to serial monitor Serial.print("Analog Value: "); Serial.print(sensorValue); Serial.print("tDigital Value: ");
  • 53. 44 // Interpret digital value if (digitalValue == HIGH) { Serial.println("Gas detected!"); } else { Serial.println("No gas detected."); } // Delay before next reading delay(1000); }
  • 54. 45 APPENDIX Arduino coding to connect Humidity Sensor: #include <DHT.h> #define DHT_PIN 2 // Pin connected to the DHT sensor // Uncomment one of the lines below corresponding to your sensor type //#define DHT_TYPE DHT11 // DHT 11 #define DHT_TYPE DHT22 // DHT 22 (AM2302) //#define DHT_TYPE DHT21 // DHT 21 (AM2301) DHT dht(DHT_PIN, DHT_TYPE); void setup() { Serial.begin(9600); // Initialize serial communication dht.begin(); // Initialize DHT sensor } void loop() { delay(2000); // Delay between sensor readings // Read temperature (in Celsius) from the sensor float temperature = dht.readTemperature(); // Read humidity (%) from the sensor float humidity = dht.readHumidity();
  • 55. 46 // Check if any reads failed and exit early (to try again). if (isnan(temperature) || isnan(humidity)) { Serial.println("Failed to read from DHT sensor!"); return; } // Print temperature and humidity to Serial Monitor Serial.print("Temperature: "); Serial.print(temperature); Serial.print("°Ct"); Serial.print("Humidity: "); Serial.print(humidity); Serial.println("%"); }
  • 56. 47 APPENDIX #include <DHT.h> #include <Wire.h> #include <LiquidCrystal_I2C.h> #define DHT_PIN 2 // Pin connected to the DHT sensor #define MQ2_PIN A0 // Analog pin connected to MQ2 gas sensor #define TRIG_PIN 7 // Trigger pin of the ultrasonic sensor #define ECHO_PIN 6 // Echo pin of the ultrasonic sensor #define LM35_PIN A1 // Analog pin connected to LM35 temperature sensor #define NOISE_PIN A2 // Analog pin connected to noise sensor #define LED_PIN 8 // Digital pin connected to LED #define BUZZER_PIN 9 // Digital pin connected to buzzer
  • 57. 48 #define DHT_TYPE DHT22 // DHT22 sensor type DHT dht(DHT_PIN, DHT_TYPE); LiquidCrystal_I2C lcd(0x27, 16, 2); // Address 0x27 for a 16x2 display void setup() { Serial.begin(9600); // Initialize serial communication dht.begin(); // Initialize DHT sensor lcd.begin(); // Initialize LCD lcd.backlight(); // Turn on LCD backlight pinMode(TRIG_PIN, OUTPUT); pinMode(ECHO_PIN, INPUT); pinMode(LED_PIN, OUTPUT); pinMode(BUZZER_PIN, OUTPUT); } void loop() { // Read temperature and humidity from DHT22 sensor float
  • 58. 49 temperature = dht.readTemperature(); float humidity = dht.readHumidity(); // Read analog value from MQ2 gas sensor int mq2Value = analogRead(MQ2_PIN); // Read distance from ultrasonic sensor long duration, distance; digitalWrite(TRIG_PIN,LOW); delayMicroseconds(2); digitalWrite(TRIG_PIN, HIGH); delayMicroseconds(10); digitalWrite(TRIG_PIN, LOW); duration = pulseIn(ECHO_PIN, HIGH); distance = duration * 0.034 / 2; // Read temperature from LM35 sensor int lm35Value = analogRead(LM35_PIN); float temperature_lm35 = (lm35Value * 0.004882814) * 100; // Convert to Celsius // Read noise level int noiseValue = analogRead(NOISE_PIN); // Print sensor readings to serial monitor Serial.print("Temperature (DHT22): "); Serial.print(temperature); Serial.println("°C"); Serial.print("Humidity (DHT22): "); Serial.print(humidity); Serial.println("%");
  • 59. 50 Serial.print("MQ2 Value: "); Serial.println(mq2Value); Serial.print("Ultrasonic Distance: "); Serial.print(distance); Serial.println(" cm"); Serial.print("Temperature (LM35): "); Serial.print(temperature_lm35); Serial.println("°C"); Serial.print("Noise Level: "); Serial.println(noiseValue); // Display sensor readings on LCD lcd.clear(); lcd.setCursor(0, 0); lcd.print("Temp: "); lcd.print(temperature); lcd.print(" C"); lcd.setCursor(0, 1); lcd.print("Humidity: "); lcd.print(humidity); lcd.print("%"); // Trigger LED and buzzer based on sensor readings if (temperature > 25 || humidity > 70 || mq2Value > 500 || distance < 50 || noiseValue > 500) { digitalWrite(LED_PIN, HIGH);
  • 60. 51 // Turn on LED tone(BUZZER_PIN,1000); // Activate buzzer } else { digitalWrite(LED_PIN, LOW); // Turn off LED noTone(BUZZER_PIN); // Deactivate buzzer } // Add a delay before next sensor readings delay(2000); }
  • 61. 52 REFERENCES 1. Gopal, M.; Singh, V. Control Systems Engineering; Wiley: New York, NY, USA, 2008; Volume SMC-6, No. 9. [Google Scholar] 2. Li, M.; Lin, H.J. Design and Implementation of Smart Home Control Systems Based on Wireless Sensor Networks and Power Line Communications. IEEE Trans. Ind. Electron. 2015, 62, 4430–4442. [Google Scholar] [CrossRef] 3. Santos, I.L.; Pirmez, L.; Carmo, L.R.; Pires, P.F.; Delicato, F.C.; Khan, S.U.; Zomaya, A.Y. A Decentralized Damage Detection System for Wireless Sensor and Actuator Networks. IEEE Trans. Comput. 2016, 65, 1363–1376. [Google Scholar] [CrossRef] 4. Rawat, P.; Singh, K.D.; Chaouchi, H.; Bonnin, J.M. Wireless sensor networks: A survey on recent developments and potential synergies. J. Supercomput. 2014, 68, 1–48. [Google Scholar] [CrossRef] 5. Borges, L.M.; Velez, F.J.; Lebres, A.S. Survey on the characterization and classification of wireless sensor network applications. IEEE Commun. Surv. Tutor. 2014, 16, 1860–1890. [Google Scholar] [CrossRef]. 6. Akyildiz and I. Kasimoglu, "Wireless sensor and actor networks: Research challenges", Ad Hoc Netw., vol. 2, no. 4, pp. 351-367, Oct. 2004. 7. G. Hackmann, F. Sun, N. Castaneda, C. Lu and S. Dyke, "A holistic approach to decentralized structural damage localization using wireless sensor networks", Comput. Commun., vol. 36, no. 1, pp. 29-41, Dec. 2012. 8. D. M. Han and J. H. Lim, "Smart home energy management system using IEEE 802.15.4 and Zigbee", IEEE Trans. Consum. Electron., vol. 56, no. 3, pp. 1403-1410, Aug. 2010. 9. H. Wang and J. Wang, "Design and implementation of a smart home based on WSN and AMR", Appl. Mech. Mater., vol. 271-272, pp. 1485-1489, 2013.
  • 62. 53
  • 63. 54
  • 64. 55
  • 65. 56