
Recomendados
Mais conteúdo relacionado
Semelhante a Uploaded file 129855896467078750
Semelhante a Uploaded file 129855896467078750 (20)
Último
Último (20)
Uploaded file 129855896467078750
- 1. The Negative Impact of Healthy Eating Sugar-Sweetened Beverages Research to prevent Building evidence childhood obesity on Children’s Health A Research Synthesis, November 2009 During the past four decades, the obesity rate for children ages 6 to 11 has more than quadrupled, from 4.2 percent to 17 percent, and more than tripled for adolescents ages 12 to 19, from 4.6 percent to 17.6 percent.1,2 A substantial body of research has determined that increased SSB consumption leads to excess weight gain and a higher risk of obesity among youth.3,4,5 Over nearly the past 30 years, U.S. children and adolescents Definition of Sugar-Sweetened Beverages (SSBs)13 have dramatically increased their consumption of sugar- sweetened beverages (SSBs), including soda, fruit drinks Sugar-sweetened beverages (SSBs) include all sodas, and punches, and sports drinks (see sidebar for a more fruit drinks, sport drinks, low-calorie drinks and other complete definition).6,7 Such consumption has been linked beverages that contain added caloric sweeteners, to less healthy diets and a number of other negative such as sweetened tea, rice drinks, bean beverages, health consequences, including decreased bone density, sugar cane beverages, horchata and nonalcoholic a. Sport drinks include all beverages marketed for wines/malt beverages. dental decay, headaches, anxiety and loss of sleep.8,9,10 rehydration for athletes. Interventions to lower SSB consumption have been b. Fruit drinks include all fruit drinks, fruit juices and fruit linked to lower risk of overweight, and weight loss among nectars with added sugar. overweight adolescents.11,12 This research synthesis examines c. Sodas include all carbonated beverages with added sugar. the evidence regarding the various health impacts of SSB d. Other SSBs include sweetened tea, rice drinks, consumption, presents initial conclusions based on these Key Research Results bean beverages, sugar cane beverages, horchata, studies, and identifies areas for further research. ■ Children and adolescents in the United States have nonalcoholic wines/malt beverages, etc.i been steadily increasing consumption of a wide variety (It should be noted that this is intended as a comprehensive definition of SSBs, but that not all studies of SSBs over nearly 30 years.14,15 In 2004, adolescents cited in this synthesis use this entire definition. For consumed an average of 300 calories per day from instance, some studies look only at sodas.) SSBs , accounting for 13 percent of their daily caloric i Future discussion of beverage categories should determine definition intake. Boys and girls of all ages, economic status and and impact of “low-calorie” SSBs, which are a very small, but growing beverage category. Additional attention also should be paid to defining racial/ethnic backgrounds are now consuming high ■ the energy drink category. Such beverages generally include caffeine and The preponderance of research shows that SSB levels of SSBs. other substances in addition to sweeteners. consumption leads to excess caloric intake and weight health problems, including anxiety, withdrawal and gain, as well as increased obesity rates among children poor-quality or reduced sleep. Consumption also has and adolescents.16,17,18 Weaker studies, some of which been linked to tooth decay.24,25,26,27,28 are funded by the beverage industry, have shown less ■ consistent associations.19,20intake of important SSB consumption reduces Details on Key Research Results Children and adolescents in the United States have nutrients by replacing milk consumption21 and is been steadily increasing consumption of a wide variety associated with lower bone mineral density and an of SSBs over nearly30 years.29,30By 2004, adolescents consumed an average of 300 calories per day from ■ increased risk of bone fractures among girls.22 SSBs, accounting for 13 percent of their daily caloric Substituting other beverages, such as water, for SSBs intake. Boys and girls of allages, economic status and could reduce over-consumption of calories and racial/ethnic backgrounds are now consuming high levels of SSBs. improve nutrition.23 ■ Because SSBs frequently contain high levels of caffeine, their consumption can cause numerous other Healthy Eating Research A National Program of the Robert Wood Johnson Foundation
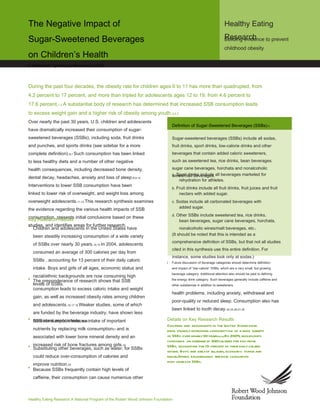
- 2. Figure 1. Trends in Youth (ages 2–18) Beverage Consumption: Daily Caloric Intake by Beverage Type and Year 250 200 Daily Calorie Intake 150 100 50 0 1977–1978 1989–1991 1994–1996 1999–2001 Sugar-sweetened Beverages Milk Fruit Juice Source: Nielsen S and Popkin B. “Changes in Beverage Intake Between 1977 and 2001.” American Journal of Preventive Medicine. 27(3): 205–210, October 2004. The preponderance of research shows that SSB The overall rise in caloric intake from SSBs has been consumption leads to excess caloric intake and weight driven by increasing num b ers of children consu m ing gain, as well as increased obesity rates among children and adolescents.34,35,36 SSBs, increasing portion sizes and increasing consu m ption frequency. From 1977–78 to 1994–96, the percentage of children drinking SSBs on a given day increased from 75 Many indep en d e nt studies suggest that SSB consu m ption percent to 85 percent, the nu m b er of times per day children is associated with excess caloric intake and weight gain, drank SSBs increased from 2 to 2.6, and the average SSB which in turn leads to higher obesity rates among children. Consistent with findings among adults, studies altering serving size increased by 44 percent, from 13. 1 to 18.9 fluid the amount of SSB s in children’s diets, as well as ounces. 31 As shown in figure 1, between 1977 and 2001, the stronger, longitudinal studies following children’s nu m b er of daily calories youths consu m e d from SSBs and SSB consu m ption and weight change over time, have fruit juice increased, while the num b er coming from milk consistently found a relationship between higher SSB decrease d. Allof these factors contribute to the fact that, consu m ption and weight gain. 37,38,39 In contrast to the by 2004, children ages 6 to 1 1 were consu ming 184 calories clear findings from longitudinal studies and rando mize d from SSBs per day, or 9 percent of their daily caloric intake, trials, weaker studies looking at SSB consu m ption and and children ages 2 to 5 were consu m ing 124 calories, or weight at one point in time have shown mixe d results. 7 percent of their daily total. Although soda accounts for Two reviews indicate relationship betweenby the beverage Although the precise that studies funde d SSB half of all SSB consu m ption among youth, fruit drinks, industry have and excess weight gainassociations. 40,41 two consu m ption shown less consistent is under debate, sports drinks and other beverages contribute an increasing An analysis of data from 1988 ption. As figure 2 while, proportion of total SSB consu m to 2004 found thatindicates, possibilities are that: ■ in the children ages to 5, fruit drinks contribute the amongpast, children in2higher-inco m e families consu m e d individuals do not comp e n sate for excess liquid more SSBs calories consu m e d from SSBs, whereas for majority of than those in lower-inco m e families, youth calories by reducing consu m ption of calories from now consu m high levels of e s from soda. 32 adolescents ethe majority comSSBs regardless of family solid food; 42,43,44 and ■ consu m ption of sweetene d beverages may induce hunger inco m e. SSB consu m ption is similarly high for both and thereby increased consu m ption of other foods. 45 boys and girls, as well as for youth in all racial and ethnic groups. However, consu m ption is rising faster among black and Mexican-American youth than among white youth. 33 2 The Negative Impact of Sugar-Sweetened Beverages on Children’s Health • November 2009
- 3. Figure 2. Per Capita Daily Contribution of SSBs and 100% Fruit Juice to Caloric Intake 350 300 250 Calories 200 150 100 50 0 1988–1994 1999–2004 1988–1994 1999–2004 1988–1994 1999–2004 1988–1994 1999–2004 Ages 2–19 y Ages 2–5 y Ages 6–11 y Ages 12–19 y Soda Fruit Juice Sports Drink Other SSBs 100% Juice Source: Wang Y, Bleich S and Gortmaker S. “Increasing Caloric Contribution from Sugar Sweetened Beverages and 100% Fruit Juices Among US Children and Adolescents, 1988–2004.” Pediatrics. 121(6): e1604–e1614, June 2008. SSB consumption reduces intake of important The Connection between SSB Consumption and nutrients by replacing milk consumption and is associated with lower bone mineral density and an Type 2 Diabetes increased risk of bone fractures among girls.53 Because of its association with weight gain, increased SSB consumption has been linked with higher rates of Longitudinal studies have shown that children who type 2 diabetes among adults.46 There also are strong increase their SSB consu m ption reduce their milk connections between increases in obesity rates and consu m ption, while cross-sectional studies have found increases in rates of type excess weight gain and type 2 The connection between 2 diabetes.47 that children who drink more SSB s consu m e less diabetes is very strong: rates of diabetes increase along milk. 54,55,56,57,58 SSB consu m ption also is associated with with increases in body mass index (BMI).48 Healthy- inadequate intake of a nu m b er of important nutrients, weight adults have a 20 percent lifetime risk of diabetes, including calcium, iron, folate and vitamin A.59,60,61,62 but for those who are overweight or obese, the risk rises SSB consu m ption, particularly of soda, is associated As30 percent or 70 percent, respectively.49 in the to among adults, there have been increases with lower bone mineral density and decrease d bone rates of both obesity and type 2 diabetes among mass accrual among girls at a critical stage in bone adolescents.50 There is also research describing connections between SSB consumption and risk develop m e nt, potentially impacting bone health Substituting other beverages, such as water, for SSBs factors for diabetes among youth. For example, throughout their lives. 63 Such of calories and also has been could reduce over-consumption consu m ption improve nutrition.66 a school-based intervention that lowered SSB linked to a higher risk of bone fractures among girls.64,65 consumption among adolescents significantly reduced plasma insulin levels, a risk factor for type 2 diabetes.51 Substituting unswe etene d beverages for SSB s could Additionally, one small study found that increased sugar reduce excess consu m ption of calories and improve consumption among Latino children was linked to nutrition, although different substitutions would increases in risk factors for diabetes.52 likely have different effects. For instance, children and adolescents consu m e significantly fewer calories on days when they drink water instead of SSB s. 67 3 The Negative Impact of Sugar-Sweetened Beverages on Children’s Health • November 2009
- 4. Also, substituting low-fat or skim milk for so m e SSB Youth Access to SSBs consu m ption could improve youth nutrition without increasing weight gain, particularly in young children. 68 Children and adolescents currently have access While replacing SSBs with no-calorie “diet sodas” may to SSBs both in school and at home. On a typical reduce caloric intake, such beverages may not be a weekday between 55 percent and 70 percent of all healthy alternative for children given potential negative SSB consumption occurred in the home, with younger effects on oral health, increased caffeine intake and the children consuming a higher proportion at districts have In recent years, many schools and school home.92 fact that the long-term effects of non- caloric sweeteners begun to restrict access to SSBs. An evaluation by (e.g., aspartame, stevia, sucralose, etc.) on children are the American Beverage Association (ABA) found that, Because SSBs frequently contain high levels of caffeine, consumption can cause numerous health still unknown. 69 following its 2004 Memorandum of Understanding with problems beyond excess weight gain, including the Alliance for a Healthier Generation, there was a anxiety, withdrawaland poor-quality or reduced sleep. Consumption also has been linked to tooth decay.70,71,72 substantial reduction in beverage calories shipped to participating schools. Between 2004 and the 2007–08 school year, there was a 58 percent reduction in total SSB consu m ption, particularly of soda and energy beverage calories shipped to schools, and a 65 percent drinks, can lead to caffeine-intake levels that can have reduction in shipment of non-diet soft drinks.93 However, serious, negative impacts on the health of children and even after these substantial reductions, access to SSBs adolescents. A typical 20-oz. bottle of cola can contain in schools across the country made an estimated 125 50–75 mg of caffeine, and a 16- oz. energy drink can billion calories available to students.94 A 2006 analysis contain as much as 150 mg. 73 A study publishe d in 2004 of state action found that the median percentage of found that children ages 1 to 5 in the 90th percentile schools allowing soda or sugar-sweetened fruit drinks of caffeine intake consu m e d 37 mg of caffeine per day, was 62.5 percent and the median allowing sports drinks To complement efforts to change school environments, and children ages 6 to 9 in the 90th percentile consu m e d was 72.7 percent.95 Recent research also indicates that replacement of youth SSB consumption with water at 45 mg per day. 74 Caffeine consu m ption increases youth who consume fewer SSBs at school because they home and in other out-of-school settings could save are less available do not compensate by increasing their substantially in adolescence. One study of U.S. high families billions of dollars annually. Assuming youth Studies students doses of 50–150 mg of caffeine perption school testing noted an average caffeine consu m day consumption at home or elsewhere.96 consume two 12 oz servings of SSBs per day, at among children of 63 mg/day. 75 and adolescents have found it can $0.50 per serving, consumers could save $24 billion cause withdrawal sympto m s, decrease alertness and dollars per year by replacing youth SSB with water. As headaches, and possibly increase anxiety. 76,77,78 Caffeine discussed above in this synthesis, changing from SSBs also has been associated with poor sleep quality and to water also would positively impact the health reduced sleep duration among adolescents. 79,80 In turn, of children and youth. insufficient sleep among adolescents has been associated Concl usions and Impl icat ions with motor vehicle accidents, irritability, behavior SSB consu m ption — w h i c h has risen dramatically among problems, and vulnerability to drug and alcohol U.S. children and adolescents, especially among black use. 81,82 Insufficient sleep also has predicted excess and Mexican-American youth — h a s been clearly linked to weight gain among children, adolescents and adults, excess weight gain and increased risk of obesity among Nu m erous strengtheninghave relationship between SSB potentially studies also the linked SSBs with an youth. 97,98,99 The combin e d risks of obesity and other increased riskand toothrisk of obesity. 83,84,85,86,87,88 and so m e consu m ption of the decay among children, 89 negative health consequ e nc e s require sustained effort to have found that the acidity levels com m o nly found in reduce or eliminate SSB consu m ption among children sodas and sports drinks erode tooth enam el. 90 Children and adolescents. Reducing SSB consu m ption would have who consu m e more soda and sucrose, which many SSB s no negative effects on children’s health and would reduce contain, are at increased risk of decayed, missing and the risk of childhood obesity and many other health filled teeth. 91 problems, including type 2 diabetes, poor nutrition, excess caffeine consu m ption and dental decay. 4 The Negative Impact of Sugar-Sweetened Beverages on Children’s Health • November 2009
- 5. Figure 3: Location Where Children and Adolescents Consume SSBs and 100% Fruit Juice 400 350 300 250 Calories 200 150 100 50 0 Weekend Weekdays Weekend Weekdays Weekend Weekdays Weekend Weekdays Ages 2–19 y Ages 2–5 y Ages 6–11 y Ages 12–19 y Home Other People’s Houses School Fast Food Restaurants Other Note: This figure displays the consumption of calories from SSBs and 100% fruit juice per capita, combined according to consumption location. “Restaurants” include self-serve buffets, cafeterias, delicatessens, restaurants, stores and take-out restaurants. “Other” includes in transit (boats, cars, planes), community- feeding programs, work, day camp, day care and other locations. Source: Wang Y, Bleich S and Gortmaker S. “Increasing Caloric Contribution from Sugar Sweetened Beverages and 100% Fruit Juices Among US Children and Adolescents, 1988–2004.” Pediatrics. 121(6): e1604–e1614, June 2008. Ar eas for Addit ional Resear ch For Mor e Inf or m ion: at While the link between SSB consu m ption and excess For more information about the potential effects of weight gain is clear, additional research is need e d to sugar-sweetene d beverage taxes on consu m er behavior and quantify the effects on weight and health that reducing health, and food and beverage marketing to children, please youth SSB consu m ption could have. Nationally consider these resources, both available on the Healthy representative studies also should evaluate the impact EatingSweetened Sugar-ResearchBeverage Web site, andPublichealthyeatingresearch.org: Taxes at www.Health energy drinks and other high-caffeine SSBs have FoodandBeverage MarketingtoChildren Adolescents: and on child and adolescent caffeine intake and health. WhatChanges NeededtoPromote are HealthyHabits Additional information also is nee d e d on the extent of SSB marketing, the targeting of that marketing to This synthesis was prepared by: specific populations and its impact on children’s health. StevenGortmaker D 1 Ph Michael Long,MPH 1 Most important, research should focus on evaluating Y. ClaireWang,M D, ScD 2 broadly applicable interventions and policy approaches to reducing SSB consu m ption among children and FromtheDepartment Society,HumanDevelopment, of and Health,HarvardSchool PublicHealth; Department of 1 of adolescents. Increased attention also should be paid to HealthPolicyandManagement,ColumbiaMailmanSchoolof PublicHealth2 shifting norms and preferences related to SSBs and other beverages among children, adolescents and parents. Peerreview providedby PatriciaCrawford, was Dr.P.H., R. D ., University California,Berkeley;DonnaJohnson,R. D ., of Ph.D., UniversityofWashington;andMelissaNelsonLaska, Ph.D., R. D ., UniversityofMinnesota. 5 The Negative Impact of Sugar-Sweetened Beverages on Children’s Health • November 2009
- 6. 27. Lim S, Sohn W, Burt B, et al. “Cariogenicity of Soft Drinks, Milk 1. Ogden C, Carroll M and Flegal K. “High Body Mass Index for Age and Fruit Juice in Low-income African-American Children.” Journal among US Children and Adolescents, 2003–2006.” Journal the of oftheAmericanDieteticAssociation,139(7): 959–967, July 2008. Association,299(20): AmericanMedical 2401–2405, May 2008. 28. Marshall T, Levy S, Broffitt B, et al. “Dental Caries and Beverage 2. Ogden C, Flegal K, Carroll M, et al. “Prevalence and Trends in Consumption in Young Children.” Pediatrics,112(3): e184–e191, Overweight among US Children and Adolescents, 1999–2000.” September 2003. Association,288(14): Journal theAmericanMedical of 1728–1732, 29. Wang Y, et al., e1608. Ref er ences October 2002. 30. Nielsen S, et al., 208. 3. Vartanian L, Schwartz M and Brownell K. “Effects of Soft Drink 31. Nielsen S, et al., 208. Consumption on Nutrition and Health: A Systematic Review and 32. Wang Y, et al., e1611. Meta-analysis.” AmericanJournal PublicHealth,97(4): 667–675, of 33. Wang Y, et al., e1608. April 2007. 34. Malik V, et al., 274. 4. Malik V, Schulze M and Hu F. “Intake of Sugar-sweetened 35. Vartanian L, et al., 673. Beverages and Weight Gain: A Systematic Review,” AmericanJournal 36. Pereira M, S28. Nutrition,84(2): ofClinical 274–288, August 2006. 37. Malik V, et al., 274. 5. Pereira M. “The Possible Role of Sugar-sweetened Beverages in 38. Vartanian L, et al., 673. Obesity Etiology: A Review of the Evidence.” International Journal of 39. Pereira M, S28. Obesity,30 (S3): S28-S36, December 2006. 40. Lesser L, et al., e5. 6. Nielsen S and Popkin B. “Changes in Beverage Intake between 1977 41. Vartanian L, et al., 673. and 2001.” AmericanJournal PreventiveMedicine,27(3): 205–210, of 42. Bellisle F and Rolland-Cachera M. “How Sugar-containing Drinks October 2004. Might Increase Adiposity in Children.” The Lancet,357(9255): 7. Wang Y, Bleich S and Gortmaker S. “Increasing Caloric 490–491, February 2001. Contribution from Sugar-sweetened Beverages and 100% Fruit 43. Mattes R. “Dietary Compensation by Humans for Supplemental Juices among US Children and Adolescents, 1988–2004.” Pediatrics, Energy Provided as Ethanol or Carbohydrate in Fluids.” Physiology 121(6): e1604–1614, June 2008. &Behavior,59(1): 179–187, January 1996. 8. Marshall T, Gilmore J, Broffitt B, et al. “Diet Quality in Young 44. DiMeglio D and Mattes R. “Liquid Versus Solid Carbohydrate: Children is Influenced by Beverage Consumption.” Journal the of Effects on Food Intake and Body Weight.” International Journal of AmericanCollege Nutrition,24(1): of 65–75, February 2005. Obesity,24(6): 794–800, June 2000. 9. Whiting S, Healey A, Psiuk S, et al. “Relationship between 45. Malik V, et al., 284. Carbonated and Other Low Nutrient Dense Beverages and 46. Schulze M, Manson J, Ludwig D, et al. “Sugar-sweetened Beverages, Bone Mineral Content of Adolescents.” NutritionResearch,21(8): Weight Gain, and Incidence of Type 2 Diabetes in Young and 1107–1115, August 2001. Middle-aged Women.” Journal theAmericanMedical of Association, 10. Tahmassebi J, Duggal M, Malik-Kotru G, et al. “Soft Drinks and 292(8): 927–934, August 2004. Dental Health: A Review of the Current Literature.” Journal of 47. Colditz G, Willett W, Stampfer M, et al. “Weight as a Risk Factor DentalResearch,34(1): 2–11, January 2006. for Clinical Diabetes in Women.” AmericanJournal Epidemiology, of 11. Ebbeling C, Feldman H, Osganian S, et al. “Effects of Decreasing 132(3): 501–513, September 1990. Sugar-sweetened Beverage Consumption on Body Weight in 48. Ibid. Adolescents: A Randomized, Controlled Pilot Study.” Pediatrics, 49. Narayan K, Boyle J, Thompson T, et al. “Effect of BMI on 117(3): 673–680, March 2006. Lifetime Risk for Diabetes in the U.S.” DiabetesCare,30(6): 12. James J, Thomas P, Cavan D, et al. “Preventing Childhood 1562–1566, June 2007. Obesity by Reducing Consumption of Carbonated Drinks: Cluster 50. Dabelea D, Bell R, D’Agostino R Jr., et al. “Incidence of Diabetes Randomized Controlled Trial.” BritishMedical Journal,328: 1237, in Youth in the United States.” Journal theAmericanMedical of May 2004. Association,297(4): 2716–2724, June 2007. 13. Wang Y, et al., e1604. 51. Ritenbaugh C, Teufel-Shone N, Aickin M, et al. “A Lifestyle 14. Wang Y, et al., e1608. Intervention Improves Plasma Insulin Levels among Native 15. Nielsen S, et al., 208. American High School Youth.” PreventiveMedicine,36(3): 309–319, 16. Malik V, et al., 274. March 2003. 17. Vartanian L, et al., 667. 52. Davis J, Ventura E, Weigensberg M, et al. “The Relation of Sugar 18. Pereira M, S28. Intake to Beta Cell Function in Overweight Latino Children.” 19. Lesser L, Ebbeling C, Goozner M, et al. “Relationship between Nutrition,82(5): AmericanJournal Clinical of 1004–1010, Funding Source and Conclusion among Nutrition-related Scientific November 2005. Articles.” PLoS Medicine,4(1): e5, January 2007. 53. Marshall T, et al., 65. 20. Vartanian L, et al., 673. 54. Blum J, Jacobsen D and Donnelly J. “Beverage Consumption 21. Marshall T, et al., 65. Patterns in Elementary School Aged Children Across a Two-year 22. Whiting S, et al., 1107. Period.” Journal theAmericanCollege Nutrition,24(2): 93–98, of of 23. Wang Y, et al., 341. April 2005. 24. Nawrot P, Jordan S, Eastwood J, et al. “Effects of Caffeine on 55. Fisher J, Mitchell D, Smiciklas-Wright H, et al. “Maternal Milk Human Health.” FoodAdditives&Contaminants,20(1): 1–30, Consumption Predicts the Tradeoff between Milk and Soft Drinks January 2003. in Young Girls’ Diets.” Journal Nutrition,131(2): 246–250, of 25. Pollak C and Bright D. “Caffeine Consumption and Weekly Sleep February 2001. 6 The Negative Impact of Sugar-Sweetened Beverages on Children’s Health • November 2009 L, Stang J, Story M. “Soft Drink Consumption among US Patterns in US Seventh-, Eighth-, and Ninth-graders.” Pediatrics, 56. Harnack 111(1): 42–46, January 2003. Children and Adolescents: Nutritional Consequences.” Journal the of 26. Tahmassebi J, et al., 2. AmericanDieteticAssociation,99(4): 436–41, April 1999.
- 7. 57. Rodriguez-Artalejo F, Garcia E, Gorgojo L, et al. “Consumption of Bakery Products, Sweetened Soft Drinks and Yogurt among Children Aged 6–7 Years: Association with Nutrient Intake and Overall Diet Quality.” BritishJournal Nutrition,89(3): 419–428, of March 2003. 58. Guenther P. “Beverages in the Diets of American Teenagers.” Journal oftheAmericanDieteticAssociation,86(4): 493–499, April 1986. 82. Tynjala J, Kannas L and Levalahti E. “Perceived Tiredness among 59. Frary C, Johnson R and Wang M. “Children and Adolescents’ Adolescents and its Association with Sleep Habits and Use of Choices of Foods and Beverages High in Added Sugars are Psychoactive Substances.” Journal SleepResearch,6(3): 189–198, of Associated with Intakes of Key Nutrients and Food Groups.” Journal October 1997. Health,34(1):56–63, ofAdolescent January 2004. 83. Berkey C, Rockett H and Colditz G. “Weight Gain in Older 60. Ballew C, Kuester S and Gillespie C. “Beverage Choices Affect Adolescent Females: The Internet, Sleep, Coffee and Alcohol.” Adequacy of Children’s Nutrient Intakes.” ArchivesofPediatrics & Journal Pediatrics,153(5): of 635–639, November 2008. Medicine,154(11): Adolescent 1148–1152, November 2000. 84. Gangwisch J, Malaspina D, Boden-Albala B, et al. “Inadequate 61. Kranz S, Smicklas-Wright H, Siega-Riz A, et al. “Adverse Effect of Sleep as a Risk Factor for Obesity: Analyses of the NHANES I.” High Added Sugar Consumption on Dietary Intake in American Sleep,28(10): 1289–1296, October 2005. Preschoolers.” Journal Pediatrics,146(1): 105–111, January 2005. of 85. von Kries R, Toschke A, Wurmser H, et al. “Reduced Risk for 62. Kant A. “Consumption of Energy-dense, Nutrient-poor Foods by Overweight and Obesity in 5- and 6-y-old Children by Duration Adult Americans: Nutritional and Health Implications. The Third of Sleep--A Cross-sectional Study.” International Journal Obesity of National Health and Nutrition Examination Survey, 1988–1994.” RelatedMetaboblic 26(5): Disorders, 710–6, May 2002. American Nutrition,72(4): Journal Clinical of 929–936, October 2000. 86. Tahmassebi J, et al., 2. 63. Whiting S, et al., 1107. 87. Lim S, et al., 959. 64. Wyshak G. “Teenaged Girls, Carbonated Beverage Consumption, 88. Marshall T, et al., e184. and Bone Fractures.” ArchivesofPediatrics Adolescent & Medicine, 89. Tahmassebi J, et al., 2. 154(6): 610–613, June 2000. 90. von Fraunhofer J, et al., 28. 65. Wyshak G and Frisch R. “Carbonated Beverages, Dietary Calcium, 91. Bowen W, et al., 921. the Dietary Calcium/Phosphorus Ratio, and Bone Fractures in Girls 92. Wang Y, et al., e1610. and Boys.” Journal Adolescent of Health,15(3): 210–215, May 1994. 93. SchoolBeverageGuidelines:Progress Report,2007–2008.Washington, 66. Wang Y, et al., 341. D.C.: American Beverage Association, 2008. (No authors given.) 67. Wang Y, et al., 340. 94. Calculations by authors based on: SchoolBeverageGuidelines 68. Wang Y, et al., 340. Report2006–2007.Washington, Progress D.C.: American Beverage 69. Edwards M, Creanor S, Foye R, et al. “Buffering Capacities of Soft Association, 2008. www.ameribev.org/files/240_progress_report_full.pdf Drinks: The Potential Influence on Dental Erosion.” Journal Oral of (accessed October 2009) Rehabilitation,26(12): 923–927, December 1999. 95. Brener N, Kann L, O’Tool T, et al., “Competitive Foods and 70. Tahmassebi J, et al., 2. Beverages Available for Purchase in Secondary Schools - Selected 71. von Fraunhofer J and Rogers M. “Effects of Sports Drinks and Sites, United States, 2006.” MorbidityandMortalityWeeklyReport, Other Beverages on Dental Enamel.” General Dentistry,53(1): 28–31, 57(34): 935–938, August 29, 2008. January-February 2005. 96. Briefel R, Wilson A and Gleason P. “Consumption of Low-nutrient, 72. Bowen W and Lawrence R. “Comparison of the Cariogenicity of Energy-dense Foods and Beverages at School, Home, and Other Cola, Honey, Cow Milk, Human Milk, and Sucrose.” Pediatrics, Locations among School Lunch Participants and Nonparticipants.” 116(4): 921–926, October 2005. Journal theAmericanDietetic of Association,109(2S): S79-S90, 73. Nutrition&Science,BeverageIngredient,Caffeine.Washington, D.C.: February 2009. American Beverage Association, 2006. www.ameribev.org/nutrition- - 97. Malik V, et al., 274. / ev ingredients c ffeine (Accessed science b erage- / a /. October 2009) 98. Vartanian L, et al., 667. 74. Knight C, Knight I, Mitchell D, et al. “Beverage Caffeine Intake in 99. Pereira M, S28. US Consumers and Subpopulations of Interest: Estimates from the Share of Intake Panel Survey.” FoodandChemical Toxicology,42(12): 1923–1930, December 2004. 75. Pollak C and Bright D. “Caffeine Consumption and Weekly Sleep Patterns in US Seventh-, Eighth-, and Ninth-graders.” Pediatrics, 111(1): 42–46, January 2003. 76. Bernstein G, Carroll M, Dean N, et al. “Caffeine Withdrawal in Normal School-age Children.” Journal theAmericanAcademyof of Psychiatry,37(8): ChildandAdolescent 858–865, August 1998. 77. Heatherley S, Hancock K and Rogers P. “Psychostimulant and Other Effects of Caffeine in 9-to 11-Year-old Children.” Journal of ChildPsychology Psychiatry,47(2): and 135–142, February 2006. 78. Goldstein A and Wallace M. “Caffeine Dependence in Schoolchildren?” Experimental Clinical and Psychopharmaco o 5(4): l gy, 388–392, November 1997. 79. Pollak C, et Impact of Sugar-Sweetened Beverages on Children’s Health • November 2009 7 The Negative al., 42. 80. Orbeta R, Overpeck M, Ramcharran D, et al. “High Caffeine Intake in Adolescents: Associations with Difficulty Sleeping and Feeling
- 8. About Healthy Eating Research Healthy Eating Research is a national program of the Robert Wood Johnson Foundation. Technical assistance and direction are provided by the University of Minnesota School of Public Health under the direction of Mary Story, Ph.D., R.D., program director, and Karen M. Kaphingst, M.P.H., deputy director. The Healthy Eating Research program supports research to identify, analyze and evaluate environmental and policy strategies that can promote healthy eating among children and prevent childhood obesity. Special emphasis is given to research projects that benefit children in low-income and racial/ethnic populations at highest risk for obesity. University of Minnesota, School of Public Health 1300 South 2nd St., Suite 300 Minneapolis, MN 55454 www.healthyeatingresearch.org About the Robert Wood Johnson Foundation The Robert Wood Johnson Foundation focuses on the pressing health and health care issues facing our country. As the nation’s largest philanthropy devoted exclusively to improving the health and health care of all Americans, the Foundation works with a diverse group of organizations and individuals to identify solutions and achieve comprehensive, meaningful and timely change. For more than 35 years the Foundation has brought experience, commitment and a rigorous, balanced approach to the problems that affect the health care of those it serves. When it comes to helping Americans lead healthier lives and get the care they need, the Foundation expects to make a difference in your lifetime. Route 1 and College Road East P.O. Box 2316 Princeton, NJ 08543-2316 www.rwjf.org 8 The Negative Impact of Sugar-Sweetened Beverages on Children’s Health • November 2009