
Recomendados
Recomendados
Mais conteúdo relacionado
Mais procurados
Mais procurados (20)
Semelhante a Overview of using InSAR to measure ice velocity
Semelhante a Overview of using InSAR to measure ice velocity (20)
Mais de SERC at Carleton College
Mais de SERC at Carleton College (20)
Overview of using InSAR to measure ice velocity
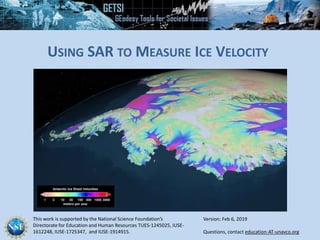
- 1. This work is supported by the National Science Foundation’s Directorate for Education and Human Resources TUES-1245025, IUSE- 1612248, IUSE-1725347, and IUSE-1914915. Questions, contact education-AT-unavco.org Version: Feb 6, 2019 USING SAR TO MEASURE ICE VELOCITY
- 2. SAR (SYNTHETIC APERTURE RADAR) SATELLITE DATA …is used to determine ice velocities using repeat imagery in two ways 1. InSAR 2. Speckle tracking (similar to feature tracking, which is done with optical images)
- 3. INSAR • Interferometric • Synthetic Aperture • Radar pretend you have a big radar antenna use wave interference emit microwaves, measure echoes
- 4. SAR: HOW IT WORKS 1. Satellite emits radar pulse 2. Radar is backscattered 3. Amplitude (intensity) and phase of echo is recorded at the satellite
- 5. Phase ==> records distance between satellites and earth. Amplitude==>records terrain slope and surface roughness. Phase change implies ground motion such as glacier/ice movement, landslide, faulting … Time-series approach=> two or more images of the same area taken at different times. InSAR images record: If distance between sensor and repeat target is non-zero following corrections==> motion
- 6. PHASE Phase is a function of the distance from the satellite to the ground. ~780 km ~6 cm ERS-1
- 7. INSAR: HOW IT WORKS Pass 1 Pass 2
- 8. INSAR: HOW IT WORKS Pass 1 Pass 2 April 5, 2001 April 14, 2001 Phase=2 Phase shift due to ice movement. Phase=1
- 9. INSAR: HOW IT WORKS—SUMMARY • One interferogram records motion in only one direction (Line of Sight), orthogonal to the flight path. • Assuming surface-parallel ice movement, interferograms from ascending and descending orbits can be combined to create 3D motion. • However, surface-parallel ice flow assumption does not work well unless the slopes are low and both accumulation and ablation are modest. • If no separate orbit SAR data, the ice-flow direction can be estimated from the direction of maximum averaged over an area larger than the thickness of the ice.
- 10. SPECKLE TRACKING • Computer algorithm scans the intensity SAR for identifiable patterns in the pixels (“speckles”) and measure how much they shift between scenes. • Can help to think of “feature tracking” with optical satellite data wherein identifiable features are tracked over time. Initial image Glacier Second image
- 11. SPECKLE TRACKING • Speckle tracking calculates probabilities that a patch of “speckles” is the same patch of ice but moved. • Pairs of SAR images are co-registered with sub-pixel accuracy. • Co-registration is from cross-correlation of speckle patterns. • These registration offsets provide a vector estimate of displacement, although with poorer resolution and accuracy than conventional interferometry. Initial image Second image Glacier Example of how resulting vector field looks
- 12. VELOCITY IMAGES OF ANTARCTICA AND GREENLAND • High spatial variability is very challenging to fully capture • Final products are error-weighted mosaics of 100s–1000s of interferograms and speckle tracking vector fields
- 13. ANIMATION: ANTARCTICA ON THE MOVE
- 14. ADDITIONAL REFERENCES • Joughin, I. (2002). Ice-Sheet Velocity Mapping: A Combined Interferometric and Speckle-Tracking Approach. Annals of Glaciology, 34, 195–201. • Joughin, I., Smith, B., Howat, I., Scambos, T. Greenland Ice Mapping Project 2 (GIMP-2) Algorithm Theoretical Basis Document Version 2, A NASA MEASURES PROJECT. https://nsidc.org/sites/nsidc.org/files/technical-references/GIMP-ATBD- Version2.pdf • König, M., Winther, J. G., & Isaksson, E. (2001). Measuring Snow and Glacier Ice Properties from Satellite. Reviews of Geophysics, 39(1), 1–27. • Mohr, J. J., Reeh, N., & Madsen, S. N. (1998). Three-Dimensional Glacial Flow and Surface Elevation Measured with Radar Interferometry. Nature, 391(6664), 273. • Palmer, S., Shepherd, A., Björnsson, H., & Pálsson, F. (2009). Ice Velocity Measurements of Langjökull, Iceland, from Interferometric Synthetic Aperture Radar (InSAR). Journal of Glaciology, 55(193), 834–838. • Rott, H. (2009). Advances in Interferometric Synthetic Aperture Radar (InSAR) in Earth System Science. Progress in Physical Geography, 33(6), 769–791.