SlideShare uma empresa Scribd logo
1 de 2
Baixar para ler offline
www.TheOnlineGK.wordpress.com


India’s effective literacy rate has recorded a 9.2 per cent rise to reach 74.04 per cent, according to provisional
data of the 2011 census released today. Interestingly, literacy rate improved sharply among females as
compared to males. While the effective literacy rate for males rose from 75.26 to 82.14 per cent marking a rise
of 6.9 per cent, it increased by 11.8 per cent for females to go from 53.67 to 65.46 per cent. According to
provisional totals of the latest census, literates constitute 74 per cent of total population aged seven and above.


Ten states and union territories, including Kerala, Lakshadweep, Mizoram, Tripura, Goa, Daman and Diu,
Puducherry, Chandigarh, National Capital Territory of Delhi and the Andaman and Nicobar Islands, have
attained literacy rate of above 85 per cent, the target set by the Planning Commission to be achieved by 2011-
12. Kerala has the highest literacy rate at 93.91 per cent followed by Lakshadweep at 92.28 per cent. Bihar is at
the bottom of the ladder with literacy rate of 63.82 followed by Arunachal Pradesh at 66.95. Literacy rate of
Rajasthan rise to 67% from 60%.
Literacy Rate In Indian State: Census 2011


Rank State       Literacy   Literacy   Decadal    Literacy   Literacy   Decadal      Literacy    Literacy   Decadal
                 rate       rate       Change     Rate-      rate-      Change in    Rate-female rate-      Change in
                 (2001      (2011      in         Male       Male       Male         (2001       Female     Female
                 Census)    Census)    Literacy   (2001      (2011      Literacy     Census)     (2011      Literacy
                                       rate       Census)    Census)    Rate(2001-               Census)    Rate(2001-
                                       (2001-                           2011)                               2011)
                                       2011)
1    Andaman & 81.3%        86.3%      5.0%       86.3%      90.1%      3.8%         75.2%       81.8%      6.6%
     Nicobar
     Islands
2    Andhra        60.5%    67.7%      7.2%       70.3%      75.6%      5.3%         50.4%       59.7%      9.3%
     Pradesh
3    Arunachal     54.3%    67.0%      12.7%      63.8%      73.7%      9.9%         43.5%       59.6%      16.1%
     Pradesh
4    Assam         63.3%    73.2%      9.9%       71.3%      78.8%      7.5%         54.6%       67.3%      13.3%
5    Bihar         47.0%    63.8%      16.8%      59.7%      73.5%      13.8%        33.1%       53.3%      20.2%
6    Chandigarh 81.9.%      86.4%      4.5%       86.1%      90.5%      4.4%         76.5%       81.4%      4.9%
7    Chattisgarh 64.7%      71.0%      6.3%       77.4%      81.5%      4.1%         51.9%       60.6%      8.7%
8    Dadra &       57.6%    77.7%      20.1%      71.2%      86.5%      15.3%        40.2%       65.9%      25.7%
     Nagar Haveli
9    Daman & Diu 78.2%      87.1%      5.4%       86.8%      91.5%      4.7%         65.6%       79.6%      14.0%
10   Delhi         81.7%    86.3%      4.6%       87.3%      91.0%      3.7%         74.7%       80.9%      6.2%
11   Goa           82.0%    87.4%      5.4%       88.4%      92.8%      4.4%         75.4%       81.8%      6.4%
12   Gujarat       69.1%    79.3%      10.2%      79.7%      87.2%      7.5%         57.8%       70.7%      12.9%
13   Haryana       67.9%    76.6%      8.7%       78.5%      85.4%      6.9%         55.7%       66.8%      11.1%
14   Himachal      76.5%    83.8%      7.3%       85.3%      90.8%      5.5%         67.4%       76.6%      9.2%%
     Pradesh
15   Jammu and 55.5%        68.7%      13.2%      66.6%      78.3%      11.7%        43.0%       58.0%      15.0%
     Kashmir
16   Jharkhand     53.6%    67.6%      14.0%      67.3%      78.5%      11.2%        38.9%       56.2%      17.3%
17   Karnataka     66.6%    75.6%      9.0%       76.1%      82.8%      6.7%         56.9%       68.1%      11.2%
18   Kerala        90.9%    93.9%      3.0%       94.2%      96.0%      1.8%         87.7%       92.0%      4.3%
19   Lakshadweep 86.7%      92.3%      5.6%       92.5%      96.1%      3.6%         80.5%       88.2%      7.7%
20   Madhya        63.7%    70.6%      6.9%       76.1%      80.5%      4.4%         50.3%       60.0%      9.7%
     Pradesh
21   Maharashtra 76.9%      82.9%      6.0%       86.0%      89.8%      3.8%         67.0%       75.5%      8.5%
22   Manipur       69.9%    79.8%      9.9%       79.5%      86.5%      7.0%         60.1%       73.2%      13.1%
23   Meghalaya 62.6%        75.5%      12.9%      65.4%      77.2%      11.8%        59.6%       73.8%      14.2%
24   Mizoram       88.8%    91.6%      2.8%       90.7%      93.7%      3.0%         86.7%       89.4%      2.7%
25   Nagaland      66.6%    80.1%      13.5%      71.2%      83.3%      12.1%        61.5%       76.7%      15.2%
26   Orissa        63.1%    73.5%      10.4%      75.3%      82.4%      7.1%         50.5%       64.4%      13.9%
27   Puducherry 81.2%       86.5%      5.3%       88.6%      92.1%      3.5%         73.9%       81.2%      7.3%
28   Punjab        69.7%    76.7%      7.0%       75.2%      81.5%      6.3%         63.4%       71.3%      7.9%
29   Rajasthan     60.4%    67.1%      6.7%       75.7%      80.5%      4.8%         43.9%       52.7%      8.8%
30   Sikkim        68.8%    82.2%      13.4%      76.0%      87.3%      11.3%        60.4%       76.4%      16.0%
31   Tamil Nadu 73.5%       80.3%      6.8%       82.4%      86.8%      4.4%         64.4%       73.9%      9.5%
32   Tripura       73.2%    87.8%      14.6%      81.0%      92.2%      11.2%        64.9%       83.1%      18.2%
33   Uttar Pradesh 56.3%    69.7%      13.4%      68.8.%     79.2%      10.4%        42.2%       59.3%      17.1%
34   Uttarakhand 71.6%      79.6%      8.0%       83.3%      88.3%      5.0%         59.6%       70.7%      11.1%
35   West Bengal 68.6%      77.1%      8.5%       77.0%      82.7%      5.7%         59.6.%      71.2%      11.6%
-    Whole INDIA 64.83%     74.04%     9.21%      75.26%     82.14%     6.88%        53.67%      65.46%     11.79%

Mais conteúdo relacionado

Semelhante a Literacy rate 2011 the onlinegk

Best countries for business 2013
Best countries for business 2013Best countries for business 2013
Best countries for business 2013Grant Thornton
 
Multiculturalism in Canada: What Census 2016 and Other Data Tell Us
Multiculturalism in Canada:  What Census 2016 and Other Data Tell UsMulticulturalism in Canada:  What Census 2016 and Other Data Tell Us
Multiculturalism in Canada: What Census 2016 and Other Data Tell UsAndrew Griffith
 
Languages Spoken in the Home — 2009 Breakdown
Languages Spoken in the Home — 2009 BreakdownLanguages Spoken in the Home — 2009 Breakdown
Languages Spoken in the Home — 2009 BreakdownHonolulu Civil Beat
 
General Tribal Lit Rate
General Tribal Lit RateGeneral Tribal Lit Rate
General Tribal Lit Ratepriteeg
 
10-Year Changes — Housing Occupancy
10-Year Changes — Housing Occupancy10-Year Changes — Housing Occupancy
10-Year Changes — Housing OccupancyHonolulu Civil Beat
 
NAG - Jefferson Township SD General Data
NAG - Jefferson Township SD General DataNAG - Jefferson Township SD General Data
NAG - Jefferson Township SD General DataCarole Rafferty
 
NTFS - Chapter 5 Tables
NTFS - Chapter 5 TablesNTFS - Chapter 5 Tables
NTFS - Chapter 5 TablesLBG
 
Stepcheck - door drop recall and readership
Stepcheck - door drop recall and readershipStepcheck - door drop recall and readership
Stepcheck - door drop recall and readershipGraham Dodd
 
ATV Safety Summit: Training the Next Generation - Boy Scouts Training Program
ATV Safety Summit: Training the Next Generation - Boy Scouts Training ProgramATV Safety Summit: Training the Next Generation - Boy Scouts Training Program
ATV Safety Summit: Training the Next Generation - Boy Scouts Training ProgramU.S. Consumer Product Safety Commission
 
NCFS - C5 T5 PG1-19
NCFS - C5 T5 PG1-19NCFS - C5 T5 PG1-19
NCFS - C5 T5 PG1-19LBG
 

Semelhante a Literacy rate 2011 the onlinegk (20)

Hawaii Towns Departure Time
Hawaii Towns Departure TimeHawaii Towns Departure Time
Hawaii Towns Departure Time
 
NAG_LAL
NAG_LALNAG_LAL
NAG_LAL
 
Best countries for business 2013
Best countries for business 2013Best countries for business 2013
Best countries for business 2013
 
Multiculturalism in Canada: What Census 2016 and Other Data Tell Us
Multiculturalism in Canada:  What Census 2016 and Other Data Tell UsMulticulturalism in Canada:  What Census 2016 and Other Data Tell Us
Multiculturalism in Canada: What Census 2016 and Other Data Tell Us
 
Educational Attainment by Age
Educational Attainment by AgeEducational Attainment by Age
Educational Attainment by Age
 
10-Year Changes 2000-2009
10-Year Changes 2000-200910-Year Changes 2000-2009
10-Year Changes 2000-2009
 
NAG_Math
NAG_MathNAG_Math
NAG_Math
 
Languages Spoken in the Home — 2009 Breakdown
Languages Spoken in the Home — 2009 BreakdownLanguages Spoken in the Home — 2009 Breakdown
Languages Spoken in the Home — 2009 Breakdown
 
General Tribal Lit Rate
General Tribal Lit RateGeneral Tribal Lit Rate
General Tribal Lit Rate
 
Life exp
Life expLife exp
Life exp
 
10-Year Changes — Housing Occupancy
10-Year Changes — Housing Occupancy10-Year Changes — Housing Occupancy
10-Year Changes — Housing Occupancy
 
Hawaii Towns Transportation
Hawaii Towns TransportationHawaii Towns Transportation
Hawaii Towns Transportation
 
Hawaii Towns Travel Time
Hawaii Towns Travel TimeHawaii Towns Travel Time
Hawaii Towns Travel Time
 
NAG - Jefferson Township SD General Data
NAG - Jefferson Township SD General DataNAG - Jefferson Township SD General Data
NAG - Jefferson Township SD General Data
 
NTFS - Chapter 5 Tables
NTFS - Chapter 5 TablesNTFS - Chapter 5 Tables
NTFS - Chapter 5 Tables
 
งานคอม
งานคอมงานคอม
งานคอม
 
Stepcheck - door drop recall and readership
Stepcheck - door drop recall and readershipStepcheck - door drop recall and readership
Stepcheck - door drop recall and readership
 
Citizenship entry
Citizenship entryCitizenship entry
Citizenship entry
 
ATV Safety Summit: Training the Next Generation - Boy Scouts Training Program
ATV Safety Summit: Training the Next Generation - Boy Scouts Training ProgramATV Safety Summit: Training the Next Generation - Boy Scouts Training Program
ATV Safety Summit: Training the Next Generation - Boy Scouts Training Program
 
NCFS - C5 T5 PG1-19
NCFS - C5 T5 PG1-19NCFS - C5 T5 PG1-19
NCFS - C5 T5 PG1-19
 

Mais de Rajesh Ahuja

Mais de Rajesh Ahuja (10)

List of abbreviations the onlinegk
List of abbreviations   the onlinegkList of abbreviations   the onlinegk
List of abbreviations the onlinegk
 
Isd all over the world
Isd all over the worldIsd all over the world
Isd all over the world
 
Internetsecurity
InternetsecurityInternetsecurity
Internetsecurity
 
Hanuman chalisa
Hanuman chalisaHanuman chalisa
Hanuman chalisa
 
Hanuman
HanumanHanuman
Hanuman
 
Gk
GkGk
Gk
 
G.k
G.kG.k
G.k
 
Ftp 2011 2020
Ftp 2011 2020Ftp 2011 2020
Ftp 2011 2020
 
Figures at glance the onlinegk
Figures at glance   the onlinegkFigures at glance   the onlinegk
Figures at glance the onlinegk
 
Rakshak jan.12 docx
Rakshak jan.12 docxRakshak jan.12 docx
Rakshak jan.12 docx
 

Último

How to Make a Pirate ship Primary Education.pptx
How to Make a Pirate ship Primary Education.pptxHow to Make a Pirate ship Primary Education.pptx
How to Make a Pirate ship Primary Education.pptxmanuelaromero2013
 
Kisan Call Centre - To harness potential of ICT in Agriculture by answer farm...
Kisan Call Centre - To harness potential of ICT in Agriculture by answer farm...Kisan Call Centre - To harness potential of ICT in Agriculture by answer farm...
Kisan Call Centre - To harness potential of ICT in Agriculture by answer farm...Krashi Coaching
 
SOCIAL AND HISTORICAL CONTEXT - LFTVD.pptx
SOCIAL AND HISTORICAL CONTEXT - LFTVD.pptxSOCIAL AND HISTORICAL CONTEXT - LFTVD.pptx
SOCIAL AND HISTORICAL CONTEXT - LFTVD.pptxiammrhaywood
 
The Most Excellent Way | 1 Corinthians 13
The Most Excellent Way | 1 Corinthians 13The Most Excellent Way | 1 Corinthians 13
The Most Excellent Way | 1 Corinthians 13Steve Thomason
 
The basics of sentences session 2pptx copy.pptx
The basics of sentences session 2pptx copy.pptxThe basics of sentences session 2pptx copy.pptx
The basics of sentences session 2pptx copy.pptxheathfieldcps1
 
Web & Social Media Analytics Previous Year Question Paper.pdf
Web & Social Media Analytics Previous Year Question Paper.pdfWeb & Social Media Analytics Previous Year Question Paper.pdf
Web & Social Media Analytics Previous Year Question Paper.pdfJayanti Pande
 
Q4-W6-Restating Informational Text Grade 3
Q4-W6-Restating Informational Text Grade 3Q4-W6-Restating Informational Text Grade 3
Q4-W6-Restating Informational Text Grade 3JemimahLaneBuaron
 
Z Score,T Score, Percential Rank and Box Plot Graph
Z Score,T Score, Percential Rank and Box Plot GraphZ Score,T Score, Percential Rank and Box Plot Graph
Z Score,T Score, Percential Rank and Box Plot GraphThiyagu K
 
Contemporary philippine arts from the regions_PPT_Module_12 [Autosaved] (1).pptx
Contemporary philippine arts from the regions_PPT_Module_12 [Autosaved] (1).pptxContemporary philippine arts from the regions_PPT_Module_12 [Autosaved] (1).pptx
Contemporary philippine arts from the regions_PPT_Module_12 [Autosaved] (1).pptxRoyAbrique
 
Arihant handbook biology for class 11 .pdf
Arihant handbook biology for class 11 .pdfArihant handbook biology for class 11 .pdf
Arihant handbook biology for class 11 .pdfchloefrazer622
 
Presentation by Andreas Schleicher Tackling the School Absenteeism Crisis 30 ...
Presentation by Andreas Schleicher Tackling the School Absenteeism Crisis 30 ...Presentation by Andreas Schleicher Tackling the School Absenteeism Crisis 30 ...
Presentation by Andreas Schleicher Tackling the School Absenteeism Crisis 30 ...EduSkills OECD
 
Activity 01 - Artificial Culture (1).pdf
Activity 01 - Artificial Culture (1).pdfActivity 01 - Artificial Culture (1).pdf
Activity 01 - Artificial Culture (1).pdfciinovamais
 
microwave assisted reaction. General introduction
microwave assisted reaction. General introductionmicrowave assisted reaction. General introduction
microwave assisted reaction. General introductionMaksud Ahmed
 
Industrial Policy - 1948, 1956, 1973, 1977, 1980, 1991
Industrial Policy - 1948, 1956, 1973, 1977, 1980, 1991Industrial Policy - 1948, 1956, 1973, 1977, 1980, 1991
Industrial Policy - 1948, 1956, 1973, 1977, 1980, 1991RKavithamani
 
Separation of Lanthanides/ Lanthanides and Actinides
Separation of Lanthanides/ Lanthanides and ActinidesSeparation of Lanthanides/ Lanthanides and Actinides
Separation of Lanthanides/ Lanthanides and ActinidesFatimaKhan178732
 
URLs and Routing in the Odoo 17 Website App
URLs and Routing in the Odoo 17 Website AppURLs and Routing in the Odoo 17 Website App
URLs and Routing in the Odoo 17 Website AppCeline George
 
POINT- BIOCHEMISTRY SEM 2 ENZYMES UNIT 5.pptx
POINT- BIOCHEMISTRY SEM 2 ENZYMES UNIT 5.pptxPOINT- BIOCHEMISTRY SEM 2 ENZYMES UNIT 5.pptx
POINT- BIOCHEMISTRY SEM 2 ENZYMES UNIT 5.pptxSayali Powar
 
Employee wellbeing at the workplace.pptx
Employee wellbeing at the workplace.pptxEmployee wellbeing at the workplace.pptx
Employee wellbeing at the workplace.pptxNirmalaLoungPoorunde1
 
Call Girls in Dwarka Mor Delhi Contact Us 9654467111
Call Girls in Dwarka Mor Delhi Contact Us 9654467111Call Girls in Dwarka Mor Delhi Contact Us 9654467111
Call Girls in Dwarka Mor Delhi Contact Us 9654467111Sapana Sha
 
Introduction to ArtificiaI Intelligence in Higher Education
Introduction to ArtificiaI Intelligence in Higher EducationIntroduction to ArtificiaI Intelligence in Higher Education
Introduction to ArtificiaI Intelligence in Higher Educationpboyjonauth
 

Último (20)

How to Make a Pirate ship Primary Education.pptx
How to Make a Pirate ship Primary Education.pptxHow to Make a Pirate ship Primary Education.pptx
How to Make a Pirate ship Primary Education.pptx
 
Kisan Call Centre - To harness potential of ICT in Agriculture by answer farm...
Kisan Call Centre - To harness potential of ICT in Agriculture by answer farm...Kisan Call Centre - To harness potential of ICT in Agriculture by answer farm...
Kisan Call Centre - To harness potential of ICT in Agriculture by answer farm...
 
SOCIAL AND HISTORICAL CONTEXT - LFTVD.pptx
SOCIAL AND HISTORICAL CONTEXT - LFTVD.pptxSOCIAL AND HISTORICAL CONTEXT - LFTVD.pptx
SOCIAL AND HISTORICAL CONTEXT - LFTVD.pptx
 
The Most Excellent Way | 1 Corinthians 13
The Most Excellent Way | 1 Corinthians 13The Most Excellent Way | 1 Corinthians 13
The Most Excellent Way | 1 Corinthians 13
 
The basics of sentences session 2pptx copy.pptx
The basics of sentences session 2pptx copy.pptxThe basics of sentences session 2pptx copy.pptx
The basics of sentences session 2pptx copy.pptx
 
Web & Social Media Analytics Previous Year Question Paper.pdf
Web & Social Media Analytics Previous Year Question Paper.pdfWeb & Social Media Analytics Previous Year Question Paper.pdf
Web & Social Media Analytics Previous Year Question Paper.pdf
 
Q4-W6-Restating Informational Text Grade 3
Q4-W6-Restating Informational Text Grade 3Q4-W6-Restating Informational Text Grade 3
Q4-W6-Restating Informational Text Grade 3
 
Z Score,T Score, Percential Rank and Box Plot Graph
Z Score,T Score, Percential Rank and Box Plot GraphZ Score,T Score, Percential Rank and Box Plot Graph
Z Score,T Score, Percential Rank and Box Plot Graph
 
Contemporary philippine arts from the regions_PPT_Module_12 [Autosaved] (1).pptx
Contemporary philippine arts from the regions_PPT_Module_12 [Autosaved] (1).pptxContemporary philippine arts from the regions_PPT_Module_12 [Autosaved] (1).pptx
Contemporary philippine arts from the regions_PPT_Module_12 [Autosaved] (1).pptx
 
Arihant handbook biology for class 11 .pdf
Arihant handbook biology for class 11 .pdfArihant handbook biology for class 11 .pdf
Arihant handbook biology for class 11 .pdf
 
Presentation by Andreas Schleicher Tackling the School Absenteeism Crisis 30 ...
Presentation by Andreas Schleicher Tackling the School Absenteeism Crisis 30 ...Presentation by Andreas Schleicher Tackling the School Absenteeism Crisis 30 ...
Presentation by Andreas Schleicher Tackling the School Absenteeism Crisis 30 ...
 
Activity 01 - Artificial Culture (1).pdf
Activity 01 - Artificial Culture (1).pdfActivity 01 - Artificial Culture (1).pdf
Activity 01 - Artificial Culture (1).pdf
 
microwave assisted reaction. General introduction
microwave assisted reaction. General introductionmicrowave assisted reaction. General introduction
microwave assisted reaction. General introduction
 
Industrial Policy - 1948, 1956, 1973, 1977, 1980, 1991
Industrial Policy - 1948, 1956, 1973, 1977, 1980, 1991Industrial Policy - 1948, 1956, 1973, 1977, 1980, 1991
Industrial Policy - 1948, 1956, 1973, 1977, 1980, 1991
 
Separation of Lanthanides/ Lanthanides and Actinides
Separation of Lanthanides/ Lanthanides and ActinidesSeparation of Lanthanides/ Lanthanides and Actinides
Separation of Lanthanides/ Lanthanides and Actinides
 
URLs and Routing in the Odoo 17 Website App
URLs and Routing in the Odoo 17 Website AppURLs and Routing in the Odoo 17 Website App
URLs and Routing in the Odoo 17 Website App
 
POINT- BIOCHEMISTRY SEM 2 ENZYMES UNIT 5.pptx
POINT- BIOCHEMISTRY SEM 2 ENZYMES UNIT 5.pptxPOINT- BIOCHEMISTRY SEM 2 ENZYMES UNIT 5.pptx
POINT- BIOCHEMISTRY SEM 2 ENZYMES UNIT 5.pptx
 
Employee wellbeing at the workplace.pptx
Employee wellbeing at the workplace.pptxEmployee wellbeing at the workplace.pptx
Employee wellbeing at the workplace.pptx
 
Call Girls in Dwarka Mor Delhi Contact Us 9654467111
Call Girls in Dwarka Mor Delhi Contact Us 9654467111Call Girls in Dwarka Mor Delhi Contact Us 9654467111
Call Girls in Dwarka Mor Delhi Contact Us 9654467111
 
Introduction to ArtificiaI Intelligence in Higher Education
Introduction to ArtificiaI Intelligence in Higher EducationIntroduction to ArtificiaI Intelligence in Higher Education
Introduction to ArtificiaI Intelligence in Higher Education
 

Literacy rate 2011 the onlinegk

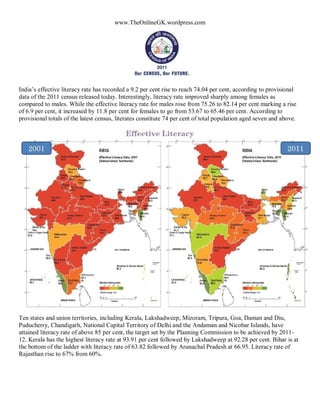
  • 1. www.TheOnlineGK.wordpress.com India’s effective literacy rate has recorded a 9.2 per cent rise to reach 74.04 per cent, according to provisional data of the 2011 census released today. Interestingly, literacy rate improved sharply among females as compared to males. While the effective literacy rate for males rose from 75.26 to 82.14 per cent marking a rise of 6.9 per cent, it increased by 11.8 per cent for females to go from 53.67 to 65.46 per cent. According to provisional totals of the latest census, literates constitute 74 per cent of total population aged seven and above. Ten states and union territories, including Kerala, Lakshadweep, Mizoram, Tripura, Goa, Daman and Diu, Puducherry, Chandigarh, National Capital Territory of Delhi and the Andaman and Nicobar Islands, have attained literacy rate of above 85 per cent, the target set by the Planning Commission to be achieved by 2011- 12. Kerala has the highest literacy rate at 93.91 per cent followed by Lakshadweep at 92.28 per cent. Bihar is at the bottom of the ladder with literacy rate of 63.82 followed by Arunachal Pradesh at 66.95. Literacy rate of Rajasthan rise to 67% from 60%.
  • 2. Literacy Rate In Indian State: Census 2011 Rank State Literacy Literacy Decadal Literacy Literacy Decadal Literacy Literacy Decadal rate rate Change Rate- rate- Change in Rate-female rate- Change in (2001 (2011 in Male Male Male (2001 Female Female Census) Census) Literacy (2001 (2011 Literacy Census) (2011 Literacy rate Census) Census) Rate(2001- Census) Rate(2001- (2001- 2011) 2011) 2011) 1 Andaman & 81.3% 86.3% 5.0% 86.3% 90.1% 3.8% 75.2% 81.8% 6.6% Nicobar Islands 2 Andhra 60.5% 67.7% 7.2% 70.3% 75.6% 5.3% 50.4% 59.7% 9.3% Pradesh 3 Arunachal 54.3% 67.0% 12.7% 63.8% 73.7% 9.9% 43.5% 59.6% 16.1% Pradesh 4 Assam 63.3% 73.2% 9.9% 71.3% 78.8% 7.5% 54.6% 67.3% 13.3% 5 Bihar 47.0% 63.8% 16.8% 59.7% 73.5% 13.8% 33.1% 53.3% 20.2% 6 Chandigarh 81.9.% 86.4% 4.5% 86.1% 90.5% 4.4% 76.5% 81.4% 4.9% 7 Chattisgarh 64.7% 71.0% 6.3% 77.4% 81.5% 4.1% 51.9% 60.6% 8.7% 8 Dadra & 57.6% 77.7% 20.1% 71.2% 86.5% 15.3% 40.2% 65.9% 25.7% Nagar Haveli 9 Daman & Diu 78.2% 87.1% 5.4% 86.8% 91.5% 4.7% 65.6% 79.6% 14.0% 10 Delhi 81.7% 86.3% 4.6% 87.3% 91.0% 3.7% 74.7% 80.9% 6.2% 11 Goa 82.0% 87.4% 5.4% 88.4% 92.8% 4.4% 75.4% 81.8% 6.4% 12 Gujarat 69.1% 79.3% 10.2% 79.7% 87.2% 7.5% 57.8% 70.7% 12.9% 13 Haryana 67.9% 76.6% 8.7% 78.5% 85.4% 6.9% 55.7% 66.8% 11.1% 14 Himachal 76.5% 83.8% 7.3% 85.3% 90.8% 5.5% 67.4% 76.6% 9.2%% Pradesh 15 Jammu and 55.5% 68.7% 13.2% 66.6% 78.3% 11.7% 43.0% 58.0% 15.0% Kashmir 16 Jharkhand 53.6% 67.6% 14.0% 67.3% 78.5% 11.2% 38.9% 56.2% 17.3% 17 Karnataka 66.6% 75.6% 9.0% 76.1% 82.8% 6.7% 56.9% 68.1% 11.2% 18 Kerala 90.9% 93.9% 3.0% 94.2% 96.0% 1.8% 87.7% 92.0% 4.3% 19 Lakshadweep 86.7% 92.3% 5.6% 92.5% 96.1% 3.6% 80.5% 88.2% 7.7% 20 Madhya 63.7% 70.6% 6.9% 76.1% 80.5% 4.4% 50.3% 60.0% 9.7% Pradesh 21 Maharashtra 76.9% 82.9% 6.0% 86.0% 89.8% 3.8% 67.0% 75.5% 8.5% 22 Manipur 69.9% 79.8% 9.9% 79.5% 86.5% 7.0% 60.1% 73.2% 13.1% 23 Meghalaya 62.6% 75.5% 12.9% 65.4% 77.2% 11.8% 59.6% 73.8% 14.2% 24 Mizoram 88.8% 91.6% 2.8% 90.7% 93.7% 3.0% 86.7% 89.4% 2.7% 25 Nagaland 66.6% 80.1% 13.5% 71.2% 83.3% 12.1% 61.5% 76.7% 15.2% 26 Orissa 63.1% 73.5% 10.4% 75.3% 82.4% 7.1% 50.5% 64.4% 13.9% 27 Puducherry 81.2% 86.5% 5.3% 88.6% 92.1% 3.5% 73.9% 81.2% 7.3% 28 Punjab 69.7% 76.7% 7.0% 75.2% 81.5% 6.3% 63.4% 71.3% 7.9% 29 Rajasthan 60.4% 67.1% 6.7% 75.7% 80.5% 4.8% 43.9% 52.7% 8.8% 30 Sikkim 68.8% 82.2% 13.4% 76.0% 87.3% 11.3% 60.4% 76.4% 16.0% 31 Tamil Nadu 73.5% 80.3% 6.8% 82.4% 86.8% 4.4% 64.4% 73.9% 9.5% 32 Tripura 73.2% 87.8% 14.6% 81.0% 92.2% 11.2% 64.9% 83.1% 18.2% 33 Uttar Pradesh 56.3% 69.7% 13.4% 68.8.% 79.2% 10.4% 42.2% 59.3% 17.1% 34 Uttarakhand 71.6% 79.6% 8.0% 83.3% 88.3% 5.0% 59.6% 70.7% 11.1% 35 West Bengal 68.6% 77.1% 8.5% 77.0% 82.7% 5.7% 59.6.% 71.2% 11.6% - Whole INDIA 64.83% 74.04% 9.21% 75.26% 82.14% 6.88% 53.67% 65.46% 11.79%