SlideShare uma empresa Scribd logo
1 de 9
Baixar para ler offline
Wyoming Trade Relationships -- 2004 - 2010                                                                                                                                           Mexico
                                                                                                                                                                                            Domestic
                                                                                                                                                                                             Canada


                                                                                                                                                      2009-2010 2009-2010      2004-2010 2004-2010
                                                                 2004         2005         2006         2007         2008        2009        2010     Difference % Change      Difference % Change
Mexico
Truck             Exports                                   $5,119,927 $6,858,785 $8,792,828 $4,527,046 $4,636,108 $14,199,974 $5,758,887            -$8,441,087     -59.4%      $638,960     12.5%
                  Imports                                   $3,348,682 $3,192,546 $3,046,802 $6,383,395 $8,345,135 $10,249,209 $17,961,027            $7,711,818      75.2%   $14,612,345    436.4%
                  Total Truck Trade with Mexico             $8,468,609 $10,051,331 $11,839,630 $10,910,441 $12,981,243 $24,449,183 $23,719,914         -$729,269      -3.0%   $15,251,305    180.1%
                                                                                                                                                                   #DIV/0!
Rail              Exports                                  $65,208,376 $63,608,973 $37,599,672 $10,431,420 $31,213,954 $59,198,025 $62,625,993       $3,427,968        5.8%   -$2,582,383     -4.0%
                  Imports                                   $5,532,784 $3,408,080 $1,286,465 $2,035,842             $0 $1,398,834 $3,396,168         $1,997,334     142.8%    -$2,136,616    -38.6%
                  Total Rail Trade with Mexico             $70,741,160 $67,017,053 $38,886,137 $12,467,262 $31,213,954 $60,596,859 $66,022,161       $5,425,302        9.0%   -$4,718,999     -6.7%
                                                                                                                                                                   #DIV/0!
TOTAL             Exports                                  $70,328,303 $70,467,758 $46,392,500 $14,958,466 $35,850,062 $73,397,999 $68,384,880       -$5,013,119      -6.8%   -$1,943,423     -2.8%
                  Imports                                   $8,881,466 $6,600,626 $4,333,267 $8,419,237 $8,345,135 $11,648,043 $21,357,195            $9,709,152      83.4%   $12,475,729    140.5%
                  Total Trade with Mexico                  $79,209,769 $77,068,384 $50,725,767 $23,377,703 $44,195,197 $85,046,042 $89,742,075        $4,696,033       5.5%   $10,532,306     13.3%


Laredo, TX

Truck             Exports                                  $4,403,602    $4,809,130   $6,807,121   $2,864,346   $1,667,841 $1,709,198 $1,687,446       -$21,752      -1.3% -$2,716,156       -61.7%
                            % of Total Exports to Mexico        86.0%         70.1%        77.4%        63.3%        36.0%       12.0%       29.3%                   17.3%                   -56.7%
                  Imports                                  $2,715,585    $2,915,239   $2,700,034   $4,770,529   $7,768,117 $9,435,456 $16,679,243    $7,243,787      76.8% $13,963,658       514.2%
                           % of Total Imports to Mexico         81.1%         91.3%        88.6%        74.7%        93.1%       92.1%       92.9%                    0.8%                    11.8%
                  Total Truck Trade Thru Laredo              7,119,187   $7,724,369   $9,507,155   $7,634,875   $9,435,958 $11,144,654 $18,366,689   $7,222,035      64.8% $11,247,502       158.0%
                             % Total Trade with Mexico          84.1%         76.8%        80.3%        70.0%        72.7%       45.6%       77.4%                   31.8%                    -6.6%

Rail              Exports                                $64,023,562 $63,293,755 $34,104,722       $4,065,537 $18,443,230 $47,045,612 $33,651,785 -$13,393,827      -28.5% -$30,371,777      -47.4%
                            % of Total Exports to Mexico       98.2%        99.5%       90.7%           39.0%       59.1%       79.5%       53.7%                   -25.7%                   -44.4%
                  Imports                                 $5,532,784   $3,011,168    $600,548      $1,665,414           $0 $1,368,640 $3,396,168    $2,027,528      148.1% -$2,136,616       -38.6%
                            % of Total Imports to Mexico      100.0%        88.4%       46.7%           81.8%   #DIV/0!         97.8%      100.0%                     2.2%                     0.0%
                  Total Rail Trade Thru Laredo             69,556,346 $66,304,923 $34,705,270      $5,730,951 $18,443,230 $48,414,252 $37,047,953 -$11,366,299      -23.5% -$32,508,393      -46.7%
                              % Total Trade with Mexico        98.3%        98.9%       89.2%           46.0%       59.1%       79.9%       56.1%                   -23.8%                   -42.2%

TOTAL
                  Exports                                   68,427,164 $68,102,885 $40,911,843 $6,929,883 $20,111,071 $48,754,810 $35,339,231 -$13,415,579           -27.5% -$33,087,933     -48.4%
                            % of Total Exports to Mexico         97.3%       96.6%       88.2%       46.3%       56.1%       66.4%       51.7%                       -14.7%                  -45.6%
                  Imports                                    8,248,369 $5,926,407 $3,300,582 $6,435,943 $7,768,117 $10,804,096 $20,075,411      $9,271,315            85.8% $11,827,042      143.4%
                           % of Total Imports to Mexico          92.9%       89.8%       76.2%       76.4%       93.1%       92.8%       94.0%                         1.2%                    1.1%
                  Total Trade Thru Laredo                   76,675,533 $74,029,292 $44,212,425 $13,365,826 $27,879,188 $59,558,906 $55,414,642 -$4,144,264            -7.0% -$21,260,891     -27.7%
                             % Total Trade with Mexico           96.8%       96.1%       87.2%       57.2%       63.1%       70.0%       61.7%                        -8.3%                  -35.1%
Wyoming Trade Relationships -- 2004 - 2010                                                                                                                                    Mexico
                                                                                                                                                                                    Domestic
                                                                                                                                                                                     Canada


                                                                                                                                               2009-2010 2009-2010     2004-2010 2004-2010
                                                             2004       2005     2006          2007          2008         2009         2010    Difference % Change     Difference % Change
Eagle Pass, TX


Truck            Exports                                        $0    $62,706   $9,689      $19,800       $47,696      $33,453      $33,020        -$433       -1.3%     $33,020   #DIV/0!
                           % of Total Exports to Mexico      0.0%       0.9%     0.1%         0.4%          1.0%         0.2%         0.6%                      0.3%                   0.6%
                 Imports                                        $0         $0       $0           $0            $0           $0           $0           $0    #DIV/0!          $0    #DIV/0!
                          % of Total Imports to Mexico       0.0%       0.0%     0.0%         0.0%          0.0%         0.0%         0.0%                      0.0%                   0.0%
                 Total Truck Trade Thru Eagle Pass              $0    $62,706   $9,689      $19,800       $47,696      $33,453      $33,020        -$433       -1.3%     $33,020   #DIV/0!
                            % Total Trade with Mexico        0.0%       0.6%     0.1%         0.2%          0.4%         0.1%         0.1%                      0.0%                   0.1%

Rail             Exports                                  $55,841    $123,262       $0   $2,725,232    $3,131,941    $9,325,913 $17,832,017    $8,506,104      91.2% $17,776,176   31833.6%
                           % of Total Exports to Mexico      0.1%       0.2%     0.0%         26.1%         10.0%         15.8%       28.5%                    12.7%                  28.4%
                 Imports                                        $0         $0       $0            $0            $0            $0          $0          $0    #DIV/0!           $0   #DIV/0!
                           % of Total Imports to Mexico      0.0%       0.0%     0.0%          0.0%     #DIV/0!            0.0%        0.0%                     0.0%                   0.0%
                 Total Rail Trade Thru Eagle Pass           55,841   $123,262       $0   $2,725,232    $3,131,941    $9,325,913 $17,832,017    $8,506,104      91.2% $17,776,176   31833.6%
                             % Total Trade with Mexico       0.1%       0.2%     0.0%         21.9%         10.0%         15.4%       27.0%                    11.6%                  26.9%

TOTAL
                 Exports                                   55,841    $185,968   $9,689   $2,745,032    $3,179,637    $9,359,366 $17,865,037    $8,505,671      90.9% $17,809,196   31892.7%
                           % of Total Exports to Mexico     0.1%        0.3%     0.0%         18.4%          8.9%         12.8%       26.1%                    13.4%                  26.0%
                 Imports                                       $0          $0       $0            $0            $0            $0          $0          $0    #DIV/0!           $0   #DIV/0!
                          % of Total Imports to Mexico      0.0%        0.0%     0.0%          0.0%          0.0%          0.0%        0.0%                     0.0%                   0.0%
                 Total Trade Thru Eagle Pass               55,841    $185,968   $9,689   $2,745,032    $3,179,637    $9,359,366 $17,865,037    $8,505,671      90.9% $17,809,196   31892.7%
                            % Total Trade with Mexico       0.1%        0.2%     0.0%         11.7%          7.2%         11.0%       19.9%                     8.9%                  19.8%

Del Rio, TX

Truck            Exports                                        $0         $0       $0       $5,000             $0           $0           $0          $0    #DIV/0!          $0    #DIV/0!
                           % of Total Exports to Mexico      0.0%       0.0%     0.0%         0.1%           0.0%         0.0%         0.0%                     0.0%                   0.0%
                 Imports                                        $0         $0       $0           $0             $0           $0           $0          $0    #DIV/0!          $0    #DIV/0!
                          % of Total Imports to Mexico       0.0%       0.0%     0.0%         0.0%           0.0%         0.0%         0.0%                     0.0%                   0.0%
                 Total Truck Trade Thru Del Rio                 $0         $0       $0       $5,000             $0           $0           $0          $0    #DIV/0!          $0    #DIV/0!
                            % Total Trade with Mexico        0.0%       0.0%     0.0%         0.0%           0.0%         0.0%         0.0%                     0.0%                   0.0%

Rail             Exports                                        $0         $0                                                                         $0    #DIV/0!          $0    #DIV/0!
                           % of Total Exports to Mexico      0.0%       0.0%              #DIV/0!       #DIV/0!      #DIV/0!      #DIV/0!                   #DIV/0!                #DIV/0!
                 Imports                                        $0         $0                                                                         $0    #DIV/0!          $0    #DIV/0!
                           % of Total Imports to Mexico      0.0%       0.0%              #DIV/0!       #DIV/0!      #DIV/0!      #DIV/0!                   #DIV/0!                #DIV/0!
                 Total Rail Trade Thru Del Rio                  $0         $0                                                                         $0    #DIV/0!          $0    #DIV/0!
                             % Total Trade with Mexico       0.0%       0.0%                   0.0%          0.0%         0.0%         0.0%                     0.0%                   0.0%

TOTAL
                 Exports                                        $0         $0       $0       $5,000             $0           $0           $0          $0    #DIV/0!          $0    #DIV/0!
                           % of Total Exports to Mexico      0.0%       0.0%     0.0%         0.0%           0.0%         0.0%         0.0%                     0.0%                   0.0%
                 Imports                                        $0         $0       $0           $0             $0           $0           $0          $0    #DIV/0!          $0    #DIV/0!
                          % of Total Imports to Mexico       0.0%       0.0%     0.0%         0.0%           0.0%         0.0%         0.0%                     0.0%                   0.0%
                 Total Trade Thru Del Rio                       $0         $0       $0       $5,000             $0           $0           $0          $0    #DIV/0!          $0    #DIV/0!
                            % Total Trade with Mexico        0.0%       0.0%     0.0%         0.0%           0.0%         0.0%         0.0%                     0.0%                   0.0%
Wyoming Trade Relationships -- 2004 - 2010                                                                                                                                       Mexico
                                                                                                                                                                                       Domestic
                                                                                                                                                                                        Canada


                                                                                                                                                    2009-2010 2009-2010   2004-2010 2004-2010
                                                               2004         2005         2006         2007         2008        2009        2010     Difference % Change   Difference % Change
GPITC

Truck            Exports                                   4,403,602   $4,871,836   $6,816,810   $2,889,146   $1,715,537 $1,742,651 $1,720,466       -$22,185     -1.3% -$2,683,136     -60.9%
                           % of Total Exports to Mexico       86.0%         71.0%        77.5%        63.8%        37.0%       12.3%       29.9%                  17.6%                 -56.1%
                 Imports                                   2,715,585   $2,915,239   $2,700,034   $4,770,529   $7,768,117 $9,435,456 $16,679,243    $7,243,787     76.8% $13,963,658     514.2%
                          % of Total Imports to Mexico        81.1%         91.3%        88.6%        74.7%        93.1%       92.1%       92.9%                   0.8%                  11.8%
                 Total Truck Trade Thru GPITC              7,119,187   $7,787,075   $9,516,844   $7,659,675   $9,483,654 $11,178,107 $18,399,709   $7,221,602     64.6% $11,280,522     158.5%
                            % Total Trade with Mexico         84.1%         77.5%        80.4%        70.2%        73.1%       45.7%       77.6%                  31.9%                  -6.5%

Rail             Exports                                  64,079,403 $63,417,017 $34,104,722     $6,790,769 $21,575,171 $56,371,525 $51,483,802    -$4,887,723    -8.7% -$12,595,601    -19.7%
                           % of Total Exports to Mexico        98.3%       99.7%       90.7%          65.1%       69.1%       95.2%       82.2%                  -13.0%                 -16.1%
                 Imports                                   5,532,784 $3,011,168     $600,548     $1,665,414           $0 $1,368,640 $3,396,168     $2,027,528    148.1% -$2,136,616     -38.6%
                           % of Total Imports to Mexico      100.0%        88.4%       46.7%          81.8%   #DIV/0!         97.8%      100.0%                    2.2%                   0.0%
                 Total Rail Trade Thru GPITC              69,612,187 $66,428,185 $34,705,270     $8,456,183 $21,575,171 $57,740,165 $54,879,970    -$2,860,195    -5.0% -$14,732,217    -21.2%
                             % Total Trade with Mexico         98.4%       99.1%       89.2%          67.8%       69.1%       95.3%       83.1%                  -12.2%                 -15.3%

TOTAL
                 Exports                                  68,483,005 $68,288,853 $40,921,532 $9,679,915 $23,290,708 $58,114,176 $53,204,268        -$4,909,908    -8.4% -$15,278,737    -22.3%
                           % of Total Exports to Mexico        97.4%       96.9%       88.2%       64.7%       65.0%       79.2%       77.8%                      -1.4%                 -19.6%
                 Imports                                   8,248,369 $5,926,407 $3,300,582 $6,435,943 $7,768,117 $10,804,096 $20,075,411           $9,271,315     85.8% $11,827,042     143.4%
                          % of Total Imports to Mexico         92.9%       89.8%       76.2%       76.4%       93.1%       92.8%       94.0%                       1.2%                   1.1%
                 Total Trade Thru GPITC                   76,731,374 $74,215,260 $44,222,114 $16,115,858 $31,058,825 $68,918,272 $73,279,679       $4,361,407      6.3% -$3,451,695      -4.5%
                            % Total Trade with Mexico          96.9%       96.3%       87.2%       68.9%       70.3%       81.0%       81.7%                       0.6%                 -15.2%
Wyoming Trade Relationships -- 2004 - 2010                                                                                                                 Mexico
                                                                                                                                                            Domestic
                                                                                                                                                             Canada


2010         Leading Exports from Wyoming to Mexico (Surface           2010    2010         Leading Exports from Wyoming to Mexico (Surface         2010
             Transportation)

                                                                                            Transportation)
Rank                                                                 Export     Rank        Coahuila                                              Export
1       28   Inorganic Chemicals                                $50,903,301    1       25   Salt; Sulfur; Plaster and Cement                  $1,492,823
2       25   Salt; Sulfur; Plaster and Cement                    $6,253,049    2       28   Inorganic Chemicals                                 $180,772
3       27   Mineral Fuels; Oils and Waxes                       $5,888,157    3       87   Vehicles Other than Railway                          $46,410
4       7    Edible Vegetables and Roots                         $1,718,570    4       39   Plastics and Articles                                $37,525
5       76   Aluminum and Articles                                 $716,728    5       85   Electrical Machinery; Equipment and Parts            $12,216
6       84   Computer-Related Machinery and Parts                  $653,777    6
7       87   Vehicles Other than Railway                           $646,559    7
8       74   Copper and Articles                                   $535,081    8
9       38   Miscellaneous Chemical Products                       $248,887    9
10      10   Cereals                                               $229,956    10

 2010        Leading Imports to Wyoming from Mexico (Surface            2010    2010        Leading Exports from Wyoming to Mexico (Surface          2010
 Rank                                                                 Import    Rank        Nuevo Leon                                             Export
1       84   Computer-Related Machinery and Parts              $7,915,692.00   1        7   Edible Vegetables and Roots                       $1,581,364
2       98   Special Classification Provisions                 $6,675,493.00   2       74   Copper and Articles                                 $531,773
3       85   Electrical Machinery; Equipment and Parts         $4,426,562.00   3       10   Cereals                                             $229,956
4       73   Articles of Iron and Steel                          $521,150.00   4       84   Computer-Related Machinery and Parts                $169,630
5       87   Vehicles Other than Railway                         $423,980.00   5       25   Salt; Sulfur; Plaster and Cement                    $152,934
6       95   Toys; Games and Sport Equipment                     $358,630.00   6       39   Plastics and Articles                                 $10,299
7       94   Furniture; Lamps and Prefabricated Buildings        $352,172.00   7       90   Measuring and Testing Instruments                      $9,011
8       82   Tools of Base Metal                                 $302,481.00   8       87   Vehicles Other than Railway                          4,130.00
9       28   Inorganic Chemicals                                 $168,322.00   9
10      39   Plastics and Articles                                $52,548.00   10

                                                                                2010      Leading Exports from Wyoming to Mexico (Surface           2010
                                                                                Rank      Tamaulipas                                              Export
                                                                               1       87 Vehicles Other than Railway                            $73,708
                                                                               2       44 Wood and Articles                                      $23,144
                                                                               3
                                                                               4
                                                                               5
                                                                               6
                                                                               7
                                                                               8
                                                                               9
                                                                               10
Wyoming Trade Relationships -- 2004 - 2010                                                                                                                  Mexico
                                                                                                                                                             Domestic
                                                                                                                                                              Canada


                                                                                                                                               Rail Truck
                                                                                                                                           Change Change
                                                                                     Rail Truck        Domestic --                           2002-  2002-
         2002                            Domestic -- 2007                         Change Change                2015                           2015   2015
Exports              Rail    Truck       Exports             Rail Truck                             Exports           Rail    Truck
Colorado              90       603 44%   Colorado            232 1,179      37%     0%    96%       Colorado          231     1,610   41%   157%   167%
Montana                0        53 3%    Montana              91    238      9% #DIV/0!  349%       Montana            33       362    9% #DIV/0!  583%
Nebraska              88         0 6%    Nebraska            238             6%   170% #DIV/0!      Nebraska          189       206    9%   114% #DIV/0!
New Mexico             2         9 1%    New Mexico                          0%  -100%  -100%       New Mexico                   48    1%  -100%   431%
North Dakota           0        12 1%    North Dakota                 44     1% #DIV/0!  267%       North Dakota        7        46    1% #DIV/0!  284%
Oklahoma             148         0 9%    Oklahoma             261            7%    76% #DIV/0!      Oklahoma          240        44    6%    62% #DIV/0!
South Dakota           0        64 4%    South Dakota          22    335     9% #DIV/0!  423%       South Dakota       26       297    7% #DIV/0!  364%
Texas                432        63 32%   Texas              1,015    133    30%   135%   111%       Texas           1,016       150   26%   135%   139%
Wyoming                                  Wyoming                                                    Wyoming
Total (4$m)          760       804       Total ($m)         1,859 1,929 100%        145%    140%    Total ($m)      1,741     2,763 100%     129%    244%
                             1,564                                3,788                     142%                              4,504                  188%
                Millions
Imports               Rail   Truck       Imports             Rail Truck                             Imports        Rail      Truck
Colorado                0    1,105 55%   Colorado              0 2,337      40%   #DIV/0!   111%    Colorado            1     2,883  38%   #DIV/0!   161%
Montana                 0      460 23%   Montana                    907     16%   #DIV/0!    97%    Montana            15     1,253  17%   #DIV/0!   172%
Nebraska                0       20 1%    Nebraska                   465      8%   #DIV/0!  2225%    Nebraska            4       478   6%   #DIV/0!  2292%
New Mexico              0      275 14%   New Mexico                          0%   #DIV/0!  -100%    New Mexico       -           45   1%   #DIV/0!   -83%
North Dakota            0       12 1%    North Dakota                        0%   #DIV/0!  -100%    North Dakota     -          118   2%   #DIV/0!   887%
Oklahoma               16        0 1%    Oklahoma                  473       8%    -100% #DIV/0!    Oklahoma         178        619  11%    1013% #DIV/0!
South Dakota            0      122 6%    South Dakota              372       6%   #DIV/0!   205%    South Dakota     -          472   6%   #DIV/0!   287%
Texas                   0        0 0%    Texas                29 1,192      21%   #DIV/0! #DIV/0!   Texas              39     1,451  20%   #DIV/0! #DIV/0!
Wyoming                                  Wyoming                                                    Wyoming                            0
Total ($m)            16     1,994       Total ($m)           29 5,746 100%          81%    188%    Total ($m)       238      7,320 100%    1387%    267%
                              2,010                              5,775                      187%                              7,558                  276%
                Millions
TOTALS                Rail   Truck       TOTALS              Rail   Truck                           TOTALS         Rail      Truck
Colorado               90    1,708 50%   Colorado             232   3,516   39%   158%   106%       Colorado         232      4,493  39%     158%   163%
Montana                 0      513 14%   Montana               91   1,145   13% #DIV/0!  123%       Montana            48     1,615  14%   #DIV/0!  215%
Nebraska               88       20 3%    Nebraska             238     465    7%   170% 2225%        Nebraska         193        685   7%     119% 3323%
New Mexico              2      284 8%    New Mexico             0       0    0%  -100%  -100%       New Mexico       -           93   1%    -100%   -67%
North Dakota            0       24 1%    North Dakota           0      44    0% #DIV/0!   83%       North Dakota        7       165   1%   #DIV/0!  585%
Oklahoma              164        0 5%    Oklahoma             261     473    8%    59% #DIV/0!      Oklahoma         418        663   9%     155% #DIV/0!
South Dakota            0      186 5%    South Dakota          22     707    8% #DIV/0!  280%       South Dakota       26       769   7%   #DIV/0!  313%
Texas                 432       63 14%   Texas              1,044   1,325   25%   142% 2003%        Texas          1,055      1,601  22%     144% 2442%
Wyoming                                  Wyoming                                                    Wyoming                            0
Total ($m)          $776 $2,798          Total ($m)         1,888 7,675 100%        143%    174%    Total ($m)      1,979    10,083 100%   #DIV/0!   260%
                          3,574                                   9,563                     168%                             12,062                  238%
Wyoming Trade Relationships -- 2004 - 2010                                                                                                                                         Mexico
                                                                                                                                                                                          Domestic
                                                                                                                                                                                           Canada


                                                                                                                                                               2009-2010 2009-2010      2004-2010 2004-2010
                                                                    2004         2005         2006          2007          2008          2009          2010     Difference % Change      Difference % Change
Canada
Truck           Exports                                    $72,189,910.00 $70,972,652 $111,239,142 $108,638,684 $110,854,504 $110,586,560 $103,437,966 -$7,148,594             -6.5% $31,248,056       43.3%
                Imports                                   $215,051,782.00 $253,165,113 $373,773,484 $495,976,463 $424,932,750 $328,428,351 $251,238,190 -$77,190,161          -23.5% $36,186,408       16.8%
                Total Truck Trade with Canada             $287,241,692.00 $324,137,765 $485,012,626 $604,615,147 $535,787,254 $439,014,911 $354,676,156 -$84,338,755          -19.2% $67,434,464       23.5%
                                                                                                                                                                            #DIV/0!
Rail            Exports                                    $38,422,577.00 $48,077,996 $54,092,812 $73,430,406 $173,028,729 $103,010,321 $132,350,275          $29,339,954      28.5% $93,927,698      244.5%
                Imports                                    $57,220,542.00 $100,613,509 $168,789,269 $97,833,058 $125,665,661 $68,581,572 $114,872,822         $46,291,250      67.5% $57,652,280      100.8%
                Total Rail Trade with Canada               $95,643,119.00 $148,691,505 $222,882,081 $171,263,464 $298,694,390 $171,591,893 $247,223,097       $75,631,204      44.1% $151,579,978     158.5%
                                                                                                                                                                            #DIV/0!
TOTAL           Exports                                   $110,612,487.00 $119,050,648 $165,331,954 $182,069,090 $283,883,233 $213,596,881 $235,788,241 $22,191,360            10.4% $125,175,754     113.2%
                Imports                                   $272,272,324.00 $353,778,622 $542,562,753 $593,809,521 $550,598,411 $397,009,923 $366,111,012 -$30,898,911           -7.8% $93,838,688       34.5%
                Total Trade with Canada                   $382,884,811.00 $472,829,270 $707,894,707 $775,878,611 $834,481,644 $610,606,804 $601,899,253 -$8,707,551            -1.4% $219,014,442      57.2%


Raymond, MT

Truck           Exports                                         $990,141    $3,336,776   $2,444,362    $1,875,226    $2,733,685    $5,227,509    $3,427,979   -$1,799,530     -34.4%    $2,437,838    246.2%
                           % of Total Exports to Canada              1.4%         4.7%         2.2%          1.7%          2.5%          4.7%          3.3%                    -1.4%                    1.9%
                Imports                                       $2,673,998    $4,321,524   $6,213,717   $10,684,074    $8,446,266   $10,586,099   $10,560,497      -$25,602      -0.2%    $7,886,499    294.9%
                          % of Total Imports to Canada               1.2%         1.7%         1.7%          2.2%          2.0%          3.2%          4.2%                     1.0%                    3.0%
                Total Truck Trade Thru Raymond                 $3,664,139   $7,658,300   $8,658,079   $12,559,300   $11,179,951   $15,813,608   $13,988,476   -$1,825,132     -11.5%   $10,324,337    281.8%
                             % Total Trade with Canada               1.3%         2.4%         1.8%          2.1%          2.1%          3.6%          3.9%                     0.3%                    2.7%

Rail            Exports                                                             $0                                                                                $0    #DIV/0!            $0    #DIV/0!
                           % of Total Exports to Canada             0.0%         0.0%         0.0%          0.0%          0.0%          0.0%          0.0%                      0.0%                     0.0%
                Imports                                                             $0                                                                                $0    #DIV/0!            $0    #DIV/0!
                          % of Total Imports to Canada              0.0%         0.0%         0.0%          0.0%          0.0%          0.0%          0.0%                      0.0%                     0.0%
                Total Truck Trade Thru Raymond                         $0           $0                         $0            $0            $0            $0           $0    #DIV/0!            $0    #DIV/0!
                             % Total Trade with Canada              0.0%         0.0%         0.0%          0.0%          0.0%          0.0%          0.0%                      0.0%                     0.0%

TOTAL
                Exports                                         $990,141    $3,336,776   $2,444,362    $1,875,226    $2,733,685    $5,227,509    $3,427,979   -$1,799,530     -34.4%    $2,437,838    246.2%
                           % of Total Exports to Canada             0.9%          2.8%         1.5%          1.0%          1.0%          2.4%          1.5%                    -1.0%                    0.6%
                Imports                                       $2,673,998    $4,321,524   $6,213,717   $10,684,074    $8,446,266   $10,586,099   $10,560,497      -$25,602      -0.2%    $7,886,499    294.9%
                          % of Total Imports to Canada              1.0%          1.2%         1.1%          1.8%          1.5%          2.7%          2.9%                     0.2%                    1.9%
                Total Trade Thru Raymond                      $3,664,139    $7,658,300   $8,658,079   $12,559,300   $11,179,951   $15,813,608   $13,988,476   -$1,825,132     -11.5%   $10,324,337    281.8%
                             % Total Trade with Canada              1.0%          1.6%         1.2%          1.6%          1.3%          2.6%          2.3%                    -0.3%                    1.4%
Wyoming Trade Relationships -- 2004 - 2010                                                                                                                                         Mexico
                                                                                                                                                                                         Domestic
                                                                                                                                                                                          Canada


                                                                                                                                                              2009-2010 2009-2010      2004-2010 2004-2010
                                                                 2004          2005          2006          2007          2008           2009          2010    Difference % Change      Difference % Change
Sweet Grass


Truck          Exports                                    $43,466,772   $45,969,289 $67,144,212 $74,101,418 $71,289,456 $75,046,699 $69,271,053 -$5,775,646                   -7.7%   $25,804,281     59.4%
                          % of Total Exports to Canada           60.2%        64.8%        60.4%        68.2%        64.3%        67.9%        67.0%                          -0.9%                    6.8%
               Imports                                    $143,883,259 $171,311,240 $270,083,843 $390,133,234 $308,180,052 $239,163,064 $162,167,172 -$76,995,892            -32.2%   $18,283,913     12.7%
                         % of Total Exports to Canada            66.9%        67.7%        72.3%        78.7%        72.5%        72.8%        64.5%                          -8.3%                   -2.4%
               Total Truck Trade Thru Sweet Grass          187,350,031 $217,280,529 $337,228,055 $464,234,652 $379,469,508 $314,209,763 $231,438,225 -$82,771,538            -26.3%   $44,088,194     23.5%
                            % Total Trade with Canada            65.2%        67.0%        69.5%        76.8%        70.8%        71.6%        65.3%                          -6.3%                    0.0%

Rail           Exports                                     $2,837,350     $3,809,557    $5,504,007   $12,649,453 $65,368,038     $24,097,005    $52,062,914 $27,965,909     116.1%    $49,225,564   1734.9%
                          % of Total Exports to Canada            7.4%          7.9%         10.2%         17.2%        37.8%          23.4%          39.3%                  15.9%                    32.0%
               Imports                                     $35,281,327   $45,313,995   $63,282,823   $54,216,953 $46,010,091     $31,072,231    $40,935,220  $9,862,989      31.7%     $5,653,893     16.0%
                          % of Total Exports to Canada           61.7%         45.0%         37.5%         55.4%        36.6%          45.3%          35.6%                  -9.7%                   -26.0%
               Total Rail Trade Thru Sweet Grass           $38,118,677   $49,123,552   $68,786,830   $66,866,406 $111,378,129    $55,169,236    $92,998,134 $37,828,898      68.6%    $54,879,457    144.0%
                             % Total Trade with Canada           39.9%         33.0%         30.9%         39.0%        37.3%          32.2%          37.6%                   5.5%                    -2.2%

TOTAL
               Exports                                     $46,304,122 $49,778,846 $72,648,219 $86,750,871 $136,657,494 $99,143,704 $121,333,967 $22,190,263                  22.4%   $75,029,845    162.0%
                          % of Total Exports to Canada           41.9%        41.8%        43.9%        47.6%        48.1%        46.4%        51.5%                           5.0%                    9.6%
               Imports                                    $179,164,586 $216,625,235 $333,366,666 $444,350,187 $354,190,143 $270,235,295 $203,102,392 -$67,132,903            -24.8%   $23,937,806     13.4%
                         % of Total Imports to Canada            65.8%        61.2%        61.4%        74.8%        64.3%        68.1%        55.5%                         -12.6%                  -10.3%
               Total Trade Thru Sweet Grass               $225,468,708 $266,404,081 $406,014,885 $531,101,058 $490,847,637 $369,378,999 $324,436,359 -$44,942,640            -12.2%   $98,967,651     43.9%
                            % Total Trade with Canada            58.9%        56.3%        57.4%        68.5%        58.8%        60.5%        53.9%                          -6.6%                   -5.0%

Portal, ND

Truck          Exports                                      $1,525,731    $2,343,253    $2,168,937    $3,434,969    $4,713,861    $2,257,527     $2,337,558     $80,031       3.5%      $811,827      53.2%
                          % of Total Exports to Canada            2.1%          3.3%          1.9%          3.2%          4.3%          2.0%           2.3%                   0.2%                     0.1%
               Imports                                      $2,352,105    $2,535,344    $5,015,371    $6,387,135   $10,667,823    $3,765,523     $5,085,835   $1,320,312     35.1%     $2,733,730    116.2%
                         % of Total Imports to Canada             1.1%          1.0%          1.3%          1.3%          2.5%          1.1%           2.0%                   0.9%                     0.9%
               Total Truck Trade Thru Portal                $3,877,836    $4,878,597                  $9,822,104   $15,381,684    $6,023,050     $7,423,393   $1,400,343     23.2%     $3,545,557     91.4%
                            % Total Trade with Canada             1.4%          1.5%         0.0%           1.6%          2.9%          1.4%           2.1%                   0.7%                     0.7%

Rail           Exports                                       $537,259      $680,401        $95,087       $18,321     $500,799     $1,782,999      $698,226     $603,139      -60.8%     $160,967       30.0%
                          % of Total Exports to Canada          1.4%          1.4%            0.2%          0.0%         0.3%           1.7%          0.5%                    -1.2%                    -0.9%
               Imports                                             $0      $311,226    $12,192,460      $984,665     $427,586              $0      $27,102 -$12,165,358    #DIV/0!       $27,102    #DIV/0!
                           % of Total Imports to Canada         0.0%          0.3%            7.2%          1.0%         0.3%           0.0%          0.0%                     0.0%                     0.0%
               Total Rail Trade Thru Portal                  $537,259      $991,627    $12,287,547    $1,002,986     $928,385     $1,782,999      $725,328 -$11,562,219      -59.3%     $188,069       35.0%
                             % Total Trade with Canada          0.6%          0.7%            5.5%          0.6%         0.3%           1.0%          0.3%                    -0.7%                    -0.3%

TOTAL
               Exports                                      $2,062,990    $3,023,654    $2,264,024    $3,434,969    $4,713,861    $2,257,527     $2,337,558     $80,031       3.5%      $972,794      13.3%
                          % of Total Exports to Canada            1.9%          2.5%          1.4%          1.9%          1.7%          1.1%           1.0%                  -0.1%                    -0.9%
               Imports                                      $2,352,105    $2,846,570   $17,207,831    $7,371,800   $11,095,409    $3,765,523     $5,112,937   $1,347,414     35.8%     $2,760,832    117.4%
                         % of Total Imports to Canada             0.9%          0.8%          3.2%          1.2%          2.0%          0.9%           1.4%                   0.4%                     0.5%
               Total Trade Thru Portal                      $4,415,095    $5,870,224   $12,287,547   $10,806,769   $15,809,270    $6,023,050     $7,450,495   $1,427,445     23.7%     $3,733,626     68.8%
                            % Total Trade with Canada             1.2%          1.2%          1.7%          1.4%          1.9%          1.0%           1.2%                   0.3%                     0.1%
Wyoming Trade Relationships -- 2004 - 2010                                                                                                                                      Mexico
                                                                                                                                                                                      Domestic
                                                                                                                                                                                       Canada


                                                                                                                                                            2009-2010 2009-2010     2004-2010 2004-2010
                                                                 2004          2005          2006          2007         2008          2009          2010    Difference % Change     Difference % Change
Wild Horse
                                                                     0
Truck          Exports                                              $0           $0            $0            $0           $0             $0           $0          $0    #DIV/0!            $0    #DIV/0!
                          % of Total Exports to Canada           0.0%         0.0%          0.0%         19.4%         0.0%           0.0%         0.0%                     0.0%                     0.0%
               Imports                                              $0     $985,271       $23,768      $129,827      $54,385      $311,834       $57,255    -$254,579     -81.6%      $57,255    #DIV/0!
                         % of Total Imports to Canada            0.0%         0.4%          0.0%         19.0%         0.0%           0.1%         0.0%                    -0.1%                     0.0%
               Total Truck Trade Thru GPITC                         $0     $985,271       $23,768      $129,827      $54,385      $311,834       $57,255    -$254,579     -81.6%      $57,255    #DIV/0!
                            % Total Trade with Canada            0.0%         0.3%          0.0%         19.3%         0.0%           0.1%         0.0%                    -0.1%                     0.0%

Rail           Exports                                              $0            $0            $0            $0           $0            $0            $0         $0    #DIV/0!            $0    #DIV/0!
                          % of Total Exports to Canada           0.0%          0.0%          0.0%         11.0%         0.0%          0.0%          0.0%                    0.0%                     0.0%
               Imports                                                                                                     $0            $0            $0         $0    #DIV/0!            $0    #DIV/0!
                           % of Total Imports to Canada          0.0%          0.0%          0.0%         22.4%         0.0%          0.0%          0.0%                    0.0%                     0.0%
               Total Rail Trade Thru GPITC                          $0            $0            $0            $0           $0            $0            $0         $0    #DIV/0!            $0    #DIV/0!
                             % Total Trade with Canada           0.0%          0.0%          0.0%         17.7%         0.0%          0.0%          0.0%                    0.0%                     0.0%

TOTAL
               Exports                                              $0           $0            $0            $0           $0             $0           $0          $0    #DIV/0!            $0    #DIV/0!
                          % of Total Exports to Canada           0.0%         0.0%          0.0%          0.0%         0.0%           0.0%         0.0%                     0.0%                     0.0%
               Imports                                              $0     $985,271       $23,768      $129,827      $54,385      $311,834       $57,255    -$254,579     -81.6%      $57,255    #DIV/0!
                         % of Total Imports to Canada            0.0%         0.3%          0.0%          0.0%         0.0%           0.1%         0.0%                    -0.1%                     0.0%
               Total Trade Thru GPITC                               $0     $985,271       $23,768      $129,827      $54,385      $311,834       $57,255    -$254,579     -81.6%      $57,255    #DIV/0!
                            % Total Trade with Canada            0.0%         0.2%          0.0%          0.0%         0.0%           0.1%         0.0%                     0.0%                     0.0%

GPITC
                                                           #DIV/0!
Truck          Exports                                     $45,982,644 $51,649,318 $71,757,511 $79,411,613 $78,737,002 $82,531,735 $75,036,590 -$7,495,145                 -9.1%   $29,053,946     63.2%
                          % of Total Exports to Canada           63.7%        72.8%        64.5%        73.1%        71.0%        74.6%        72.5%                       -2.1%                    8.8%
               Imports                                    $147,225,505 $178,168,631 $277,567,344 $398,525,422 $321,635,945 $248,467,930 $170,738,241 -$77,729,689         -31.3%   $23,512,736     16.0%
                         % of Total Imports to Canada            68.5%        70.4%        74.3%        80.4%        75.7%        75.7%        68.0%                       -7.7%                   -0.5%
               Total Truck Trade Thru GPITC               $193,208,149 $229,817,949 $349,324,855 $477,937,035 $400,372,947 $330,999,665 $245,774,831 -$85,224,834         -25.7%   $52,566,682     27.2%
                            % Total Trade with Canada            67.3%        70.9%        72.0%        79.0%        74.7%        75.4%        69.3%                       -6.1%                    2.0%

Rail           Exports                                      $3,374,609    $4,489,958    $5,599,094   $12,667,774 $65,868,837    $25,880,004   $52,761,140 $26,881,136    103.9%    $49,386,531   1463.5%
                          % of Total Exports to Canada            4.7%          6.3%          5.0%         11.7%        59.4%         23.4%         51.0%                 27.6%                    46.3%
               Imports                                     $35,281,327   $45,625,221   $75,475,283   $55,201,618 $46,437,677    $31,072,231   $40,962,322  $9,890,091     31.8%     $5,680,995     16.1%
                           % of Total Imports to Canada          16.4%         18.0%         20.2%         11.1%        10.9%          9.5%         16.3%                  6.8%                    -0.1%
               Total Rail Trade Thru GPITC                 $38,655,936   $50,115,179   $81,074,377   $67,869,392 $112,306,514   $56,952,235   $93,723,462 $36,771,227     64.6%    $55,067,526    142.5%
                             % Total Trade with Canada           13.5%         15.5%         16.7%         11.2%        21.0%         13.0%         26.4%                 13.5%                    13.0%

TOTAL
               Exports                                     $49,357,253 $56,139,276 $77,356,605 $92,079,387 $144,605,839 $108,411,739 $127,797,730 $19,385,991              17.9% $78,440,477      158.9%
                          % of Total Exports to Canada           44.6%        47.2%        46.8%        50.6%        50.9%        50.8%        54.2%                        3.4%                    9.6%
               Imports                                    $182,506,832 $223,793,852 $353,042,627 $453,727,040 $368,073,622 $279,540,161 $211,700,563 -$67,839,598         -24.3% $29,193,731       16.0%
                         % of Total Imports to Canada            67.0%        63.3%        65.1%        76.4%        66.8%        70.4%        57.8%                      -12.6%                   -9.2%
               Total Trade Thru GPITC                     $231,864,085 $279,933,128 $430,399,232 $545,806,427 $512,679,461 $387,951,900 $339,498,293 -$48,453,607         -12.5% $107,634,208      46.4%
                            % Total Trade with Canada            60.6%        59.2%        60.8%        70.3%        61.4%        63.5%        56.4%                       -7.1%                   -4.2%
Wyoming Trade Relationships -- 2004 - 2010                                                                                                                  Mexico
                                                                                                                                                             Domestic
                                                                                                                                                              Canada


2010         Leading Exports from Wyoming to Canada (Surface            2010    2010         Leading Exports from Wyoming to Canada (Surface         2010
             Transportation)                                                                 Transportation)


Rank                                                                  Export     Rank        Alberta                                                Export
1       27   Mineral Fuels; Oils and Waxes                       $62,578,616    1       27   Mineral Fuels; Oils and Waxes                     $61,572,625
2       84   Computer-Related Machinery and Parts                $45,127,599    2       84   Computer-Related Machinery and Parts              $39,108,160
3       28   Inorganic Chemicals                                 $37,550,247    3       68   Stone; Plaster; Cement and Asbestos               $10,009,134
4       25   Salt; Sulfur; Plaster and Cement                    $23,664,082    4       73   Articles of Iron and Steel                         $7,019,220
5       29   Organic Chemicals                                   $12,979,058    5       25   Salt; Sulfur; Plaster and Cement                   $4,856,694
6       68   Stone; Plaster; Cement and Asbestos                 $12,630,791    6       87   Vehicles Other than Railway                        $4,635,941
7       73   Articles of Iron and Steel                           $7,403,717    7       29   Organic Chemicals                                  $2,776,879
8       87   Vehicles Other than Railway                          $6,245,516    8       28   Inorganic Chemicals                                $2,761,666
9       22   Beverages; Spirits and Vinegar                       $4,343,636    9       90   Measuring and Testing Instruments                  $2,583,350
10      31   Fertilizers                                          $3,879,351    10      31   Fertilizers                                        $2,180,004

 2010        Leading Imports to Wyoming from Canada (Surface             2010
Rank                                                                   Import    2010        Leading Exports from Wyoming to Canada (Surface          2010
1       27   Mineral Fuels; Oils and Waxes                     $1,080,200,788    Rank        British Colombia                                       Export
2       84   Computer-Related Machinery and Parts                $103,561,164   1       28   Inorganic Chemicals                                $4,331,941
3       73   Articles of Iron and Steel                           $44,805,397   2       29   Organic Chemicals                                  $3,431,230
4       98   Special Classification Provisions                    $38,277,965   3       84   Computer-Related Machinery and Parts               $2,611,841
5       31   Fertilizers                                          $34,446,856   4       40   Rubber and Articles                                  $506,218
6       28   Inorganic Chemicals                                  $27,841,126   5       25   Salt; Sulfur; Plaster and Cement                     $433,804
7       85   Electrical Machinery; Equipment and Parts            $17,207,477   6       85   Electrical Machinery; Equipment and Parts            $343,489
8       39   Plastics and Articles                                $13,752,070   7       39   Plastics and Articles                                $248,919
9       94   Furniture; Lamps and Prefabricated Buildings         $11,787,134   8       23   Food Residues and Waste                              $240,788
10      90   Measuring and Testing Instruments                    $10,224,603   9       13   Lac; Gums; Resins and Saps                           $231,452
                                                                                10      68   Stone; Plaster; Cement and Asbestos                  $209,239

                                                                                 2010        Leading Exports from Wyoming to Canada (Surface          2010
                                                                                 Rank        Saskatchewan                                           Export
                                                                                1       28   Inorganic Chemicals                                $1,627,344
                                                                                2       84   Computer-Related Machinery and Parts               $1,609,721
                                                                                3       31   Fertilizers                                        $1,531,270
                                                                                4       87   Vehicles Other than Railway                          $329,670
                                                                                5       40   Rubber and Articles                                  $260,205
                                                                                6       25   Salt; Sulfur; Plaster and Cement                     $147,544
                                                                                7       82   Tools of Base Metal                                  $113,268
                                                                                8       27   Mineral Fuels; Oils and Waxes                        $110,121
                                                                                9       68   Stone; Plaster; Cement and Asbestos                   $81,613
                                                                                10      34   Soap and Organic Surface-Active Agents                $67,531

Mais conteúdo relacionado

Mais procurados

Texas Trade through Ports-to-Plains Region – 2004-2010
Texas Trade through Ports-to-Plains Region – 2004-2010Texas Trade through Ports-to-Plains Region – 2004-2010
Texas Trade through Ports-to-Plains Region – 2004-2010
Ports-To-Plains Blog
 
Venture Backed Exits - Q4 2008
 	Venture Backed Exits - Q4 2008  	Venture Backed Exits - Q4 2008
Venture Backed Exits - Q4 2008
mensa25
 
Venture Capital Exits Q3 06
  	Venture Capital Exits Q3 06    	Venture Capital Exits Q3 06
Venture Capital Exits Q3 06
mensa25
 
Slide presentation 2 q10
Slide presentation 2 q10Slide presentation 2 q10
Slide presentation 2 q10
Cia Hering RI
 
TORONTO REAL ESTATE BOARD'S -- MARKET WATCH - JULY 2019
TORONTO REAL ESTATE BOARD'S -- MARKET WATCH - JULY 2019TORONTO REAL ESTATE BOARD'S -- MARKET WATCH - JULY 2019
TORONTO REAL ESTATE BOARD'S -- MARKET WATCH - JULY 2019
Shawn Venasse
 
Exit Poll Release – Q4 ‘06
  	Exit Poll Release – Q4 ‘06    	Exit Poll Release – Q4 ‘06
Exit Poll Release – Q4 ‘06
mensa25
 

Mais procurados (19)

Texas Trade through Ports-to-Plains Region – 2004-2010
Texas Trade through Ports-to-Plains Region – 2004-2010Texas Trade through Ports-to-Plains Region – 2004-2010
Texas Trade through Ports-to-Plains Region – 2004-2010
 
Oklahoma Trade Relationships 2004-2011
Oklahoma Trade Relationships 2004-2011Oklahoma Trade Relationships 2004-2011
Oklahoma Trade Relationships 2004-2011
 
Venture Backed Exits - Q4 2008
 	Venture Backed Exits - Q4 2008  	Venture Backed Exits - Q4 2008
Venture Backed Exits - Q4 2008
 
Q2 2017 CONDO MARKET REPORT
Q2 2017 CONDO MARKET REPORTQ2 2017 CONDO MARKET REPORT
Q2 2017 CONDO MARKET REPORT
 
Venture Capital Exits Q3 06
  	Venture Capital Exits Q3 06    	Venture Capital Exits Q3 06
Venture Capital Exits Q3 06
 
IT Industry Statistics 2007 Final Report
IT Industry Statistics 2007 Final ReportIT Industry Statistics 2007 Final Report
IT Industry Statistics 2007 Final Report
 
Market Watch TORONTO 2015 OCTOBER
Market Watch TORONTO 2015 OCTOBERMarket Watch TORONTO 2015 OCTOBER
Market Watch TORONTO 2015 OCTOBER
 
Slide presentation 2 q10
Slide presentation 2 q10Slide presentation 2 q10
Slide presentation 2 q10
 
Dodo pizza monthly update - january 2019
Dodo pizza   monthly update - january 2019Dodo pizza   monthly update - january 2019
Dodo pizza monthly update - january 2019
 
Market watch jul 2019 frank yu oakville
Market watch jul 2019 frank yu oakvilleMarket watch jul 2019 frank yu oakville
Market watch jul 2019 frank yu oakville
 
TORONTO REAL ESTATE BOARD'S -- MARKET WATCH - JULY 2019
TORONTO REAL ESTATE BOARD'S -- MARKET WATCH - JULY 2019TORONTO REAL ESTATE BOARD'S -- MARKET WATCH - JULY 2019
TORONTO REAL ESTATE BOARD'S -- MARKET WATCH - JULY 2019
 
Market Watch June 2013
Market Watch June 2013Market Watch June 2013
Market Watch June 2013
 
Apimec 2 q06 results
Apimec   2 q06 resultsApimec   2 q06 results
Apimec 2 q06 results
 
Q1 2009 Earning Report of Eagle Materials Inc.
Q1 2009 Earning Report of Eagle Materials Inc.Q1 2009 Earning Report of Eagle Materials Inc.
Q1 2009 Earning Report of Eagle Materials Inc.
 
Exit Poll Release – Q4 ‘06
  	Exit Poll Release – Q4 ‘06    	Exit Poll Release – Q4 ‘06
Exit Poll Release – Q4 ‘06
 
Hhaf Defaultprob
Hhaf DefaultprobHhaf Defaultprob
Hhaf Defaultprob
 
Principals of Business Finance
Principals of Business FinancePrincipals of Business Finance
Principals of Business Finance
 
September 2020 - Market Report - Toronto & GTA Housing Sales
September 2020 - Market Report - Toronto & GTA Housing SalesSeptember 2020 - Market Report - Toronto & GTA Housing Sales
September 2020 - Market Report - Toronto & GTA Housing Sales
 
August 2021 market watch
August 2021 market watchAugust 2021 market watch
August 2021 market watch
 

Destaque

I Forum Turismo Comunitário no Conjunto Palmeiras
I Forum Turismo Comunitário no Conjunto PalmeirasI Forum Turismo Comunitário no Conjunto Palmeiras
I Forum Turismo Comunitário no Conjunto Palmeiras
bancopalmas
 
Renato Abdo - Miyashita - jan 2010
Renato Abdo - Miyashita - jan 2010Renato Abdo - Miyashita - jan 2010
Renato Abdo - Miyashita - jan 2010
Dialeto Social Media
 
Quem sou deixa marca
Quem sou deixa marcaQuem sou deixa marca
Quem sou deixa marca
GlendaPerola
 
Imagenes de biotecnologia y ingeneria genetica extrema
Imagenes de biotecnologia y ingeneria genetica extremaImagenes de biotecnologia y ingeneria genetica extrema
Imagenes de biotecnologia y ingeneria genetica extrema
rojassuhail
 
A mais bela de todas as coisas
A mais bela de todas as coisasA mais bela de todas as coisas
A mais bela de todas as coisas
GlendaPerola
 
Russia History Photo
Russia History PhotoRussia History Photo
Russia History Photo
halffast
 

Destaque (20)

Electricity and the Economy: A Co-Op’s Perspective
Electricity and the Economy: A Co-Op’s PerspectiveElectricity and the Economy: A Co-Op’s Perspective
Electricity and the Economy: A Co-Op’s Perspective
 
Border Cooperation - Dean Paisley
Border Cooperation - Dean PaisleyBorder Cooperation - Dean Paisley
Border Cooperation - Dean Paisley
 
The Ports-to-Plains Alliance: An Overview
The Ports-to-Plains Alliance: An OverviewThe Ports-to-Plains Alliance: An Overview
The Ports-to-Plains Alliance: An Overview
 
Apresentação propostas #SocialMercosul
Apresentação propostas #SocialMercosulApresentação propostas #SocialMercosul
Apresentação propostas #SocialMercosul
 
กระทรวงคมนาคม
กระทรวงคมนาคมกระทรวงคมนาคม
กระทรวงคมนาคม
 
Fm maandag 2
Fm maandag 2Fm maandag 2
Fm maandag 2
 
I Forum Turismo Comunitário no Conjunto Palmeiras
I Forum Turismo Comunitário no Conjunto PalmeirasI Forum Turismo Comunitário no Conjunto Palmeiras
I Forum Turismo Comunitário no Conjunto Palmeiras
 
Renato Abdo - Miyashita - jan 2010
Renato Abdo - Miyashita - jan 2010Renato Abdo - Miyashita - jan 2010
Renato Abdo - Miyashita - jan 2010
 
Tema2
Tema2Tema2
Tema2
 
Quem sou deixa marca
Quem sou deixa marcaQuem sou deixa marca
Quem sou deixa marca
 
Imagenes de biotecnologia y ingeneria genetica extrema
Imagenes de biotecnologia y ingeneria genetica extremaImagenes de biotecnologia y ingeneria genetica extrema
Imagenes de biotecnologia y ingeneria genetica extrema
 
Benfica Visao
Benfica VisaoBenfica Visao
Benfica Visao
 
Los seres vivos
Los seres vivosLos seres vivos
Los seres vivos
 
A mais bela de todas as coisas
A mais bela de todas as coisasA mais bela de todas as coisas
A mais bela de todas as coisas
 
Ranking
RankingRanking
Ranking
 
Họ tên
Họ tênHọ tên
Họ tên
 
Llistat proteccions TOV 2011_4
Llistat proteccions TOV 2011_4Llistat proteccions TOV 2011_4
Llistat proteccions TOV 2011_4
 
Mapeamento de Produção do Conjunto Palmeiras 2009
Mapeamento de Produção do Conjunto Palmeiras 2009Mapeamento de Produção do Conjunto Palmeiras 2009
Mapeamento de Produção do Conjunto Palmeiras 2009
 
Llistat proteccions tov 2010 7
Llistat proteccions tov 2010 7Llistat proteccions tov 2010 7
Llistat proteccions tov 2010 7
 
Russia History Photo
Russia History PhotoRussia History Photo
Russia History Photo
 

Semelhante a Wyoming Trade through Ports-to-Plains Region – 2004-2010

Naa Annual Newspaper Ad Expenditures 09
Naa Annual Newspaper Ad Expenditures 09Naa Annual Newspaper Ad Expenditures 09
Naa Annual Newspaper Ad Expenditures 09
Juan Varela
 
Caída Publicidad EEUU 2009
Caída Publicidad EEUU 2009Caída Publicidad EEUU 2009
Caída Publicidad EEUU 2009
Juan Varela
 
Cushman & Wakefield's Canadian Office Statistical Summary Q4 2018
Cushman & Wakefield's Canadian Office Statistical Summary Q4 2018Cushman & Wakefield's Canadian Office Statistical Summary Q4 2018
Cushman & Wakefield's Canadian Office Statistical Summary Q4 2018
Guy Masse
 
Slide presentation 1 q10
Slide presentation 1 q10Slide presentation 1 q10
Slide presentation 1 q10
Cia Hering RI
 

Semelhante a Wyoming Trade through Ports-to-Plains Region – 2004-2010 (20)

South Dakota Trade Relationships 2004-2011
South Dakota Trade Relationships 2004-2011South Dakota Trade Relationships 2004-2011
South Dakota Trade Relationships 2004-2011
 
Colorado Trade Relationships 2004-2011
Colorado Trade Relationships 2004-2011Colorado Trade Relationships 2004-2011
Colorado Trade Relationships 2004-2011
 
Montana Trading Relationship 2004-2011
Montana Trading Relationship 2004-2011Montana Trading Relationship 2004-2011
Montana Trading Relationship 2004-2011
 
North Dakota Trade Relationships 2004-2011
North Dakota Trade Relationships 2004-2011North Dakota Trade Relationships 2004-2011
North Dakota Trade Relationships 2004-2011
 
Nebraska Trade Relationships 2004 – 2011
Nebraska Trade Relationships 2004 – 2011Nebraska Trade Relationships 2004 – 2011
Nebraska Trade Relationships 2004 – 2011
 
Ports-to-Plains Alliance Trade Summary 2004-2011
Ports-to-Plains Alliance Trade Summary 2004-2011Ports-to-Plains Alliance Trade Summary 2004-2011
Ports-to-Plains Alliance Trade Summary 2004-2011
 
Texas Trade Relationships 2004 - 2011
Texas Trade Relationships 2004 - 2011Texas Trade Relationships 2004 - 2011
Texas Trade Relationships 2004 - 2011
 
Naa Annual Newspaper Ad Expenditures 09
Naa Annual Newspaper Ad Expenditures 09Naa Annual Newspaper Ad Expenditures 09
Naa Annual Newspaper Ad Expenditures 09
 
Caída Publicidad EEUU 2009
Caída Publicidad EEUU 2009Caída Publicidad EEUU 2009
Caída Publicidad EEUU 2009
 
The 99% Tax Plan Taxation Schedules
The 99% Tax Plan Taxation SchedulesThe 99% Tax Plan Taxation Schedules
The 99% Tax Plan Taxation Schedules
 
CNR_DCF(USD)
CNR_DCF(USD)CNR_DCF(USD)
CNR_DCF(USD)
 
Market watch jul 2019 frank yu oakville
Market watch jul 2019 frank yu oakvilleMarket watch jul 2019 frank yu oakville
Market watch jul 2019 frank yu oakville
 
Market Watch - September 2019
Market Watch - September 2019Market Watch - September 2019
Market Watch - September 2019
 
July 2021 - Market Report
July 2021 - Market Report July 2021 - Market Report
July 2021 - Market Report
 
Apimec 2 q05 results
Apimec   2 q05 resultsApimec   2 q05 results
Apimec 2 q05 results
 
Ohl Apr Eng
Ohl Apr EngOhl Apr Eng
Ohl Apr Eng
 
THE TORONTO REAL ESTATE BOARD'S MAY 2018 MARKET SALES STATISTICS WITH MEDIA R...
THE TORONTO REAL ESTATE BOARD'S MAY 2018 MARKET SALES STATISTICS WITH MEDIA R...THE TORONTO REAL ESTATE BOARD'S MAY 2018 MARKET SALES STATISTICS WITH MEDIA R...
THE TORONTO REAL ESTATE BOARD'S MAY 2018 MARKET SALES STATISTICS WITH MEDIA R...
 
Cushman & Wakefield's Canadian Office Statistical Summary Q4 2018
Cushman & Wakefield's Canadian Office Statistical Summary Q4 2018Cushman & Wakefield's Canadian Office Statistical Summary Q4 2018
Cushman & Wakefield's Canadian Office Statistical Summary Q4 2018
 
1 q10
1 q101 q10
1 q10
 
Slide presentation 1 q10
Slide presentation 1 q10Slide presentation 1 q10
Slide presentation 1 q10
 

Mais de Ports-To-Plains Blog

Mais de Ports-To-Plains Blog (20)

Canada and U.S. Trade Overview
Canada and U.S. Trade Overview Canada and U.S. Trade Overview
Canada and U.S. Trade Overview
 
2013 Ports-to-Plains Alliance Energy Conference Handouts
2013 Ports-to-Plains Alliance Energy Conference Handouts2013 Ports-to-Plains Alliance Energy Conference Handouts
2013 Ports-to-Plains Alliance Energy Conference Handouts
 
Energy Development Impact on Transportation Infrastructure
Energy Development Impact on Transportation InfrastructureEnergy Development Impact on Transportation Infrastructure
Energy Development Impact on Transportation Infrastructure
 
Wind Energy's Future and the Impact on U.S. Manufacturing
Wind Energy's Future and the Impact on U.S. ManufacturingWind Energy's Future and the Impact on U.S. Manufacturing
Wind Energy's Future and the Impact on U.S. Manufacturing
 
Compressed Air Wind Energy Storage
Compressed Air Wind Energy StorageCompressed Air Wind Energy Storage
Compressed Air Wind Energy Storage
 
Fuels Policy, Ethanol and RFS Reform Political and Policy Implications on Gas...
Fuels Policy, Ethanol and RFS Reform Political and Policy Implications on Gas...Fuels Policy, Ethanol and RFS Reform Political and Policy Implications on Gas...
Fuels Policy, Ethanol and RFS Reform Political and Policy Implications on Gas...
 
Ports-to-Plains Letter Submitted to Department of State
Ports-to-Plains Letter Submitted to Department of StatePorts-to-Plains Letter Submitted to Department of State
Ports-to-Plains Letter Submitted to Department of State
 
News Release Keystone XL Supporting SEIS Finding 041813
News Release Keystone XL Supporting SEIS Finding 041813News Release Keystone XL Supporting SEIS Finding 041813
News Release Keystone XL Supporting SEIS Finding 041813
 
Ports-to-Plains: The Importance of a Statewide Transportation to Colorado's E...
Ports-to-Plains: The Importance of a Statewide Transportation to Colorado's E...Ports-to-Plains: The Importance of a Statewide Transportation to Colorado's E...
Ports-to-Plains: The Importance of a Statewide Transportation to Colorado's E...
 
2013 Energy Conference Save the Date
2013 Energy Conference Save the Date2013 Energy Conference Save the Date
2013 Energy Conference Save the Date
 
February 2013 Update from the Ports-to-Plains Alliance
February 2013 Update from the Ports-to-Plains AllianceFebruary 2013 Update from the Ports-to-Plains Alliance
February 2013 Update from the Ports-to-Plains Alliance
 
Draft Supplemental EIS for the Keystone XL Project
Draft Supplemental EIS for the Keystone XL ProjectDraft Supplemental EIS for the Keystone XL Project
Draft Supplemental EIS for the Keystone XL Project
 
PTP supports Heineman Keystone XL Pipeline Decision
PTP supports Heineman Keystone XL Pipeline DecisionPTP supports Heineman Keystone XL Pipeline Decision
PTP supports Heineman Keystone XL Pipeline Decision
 
Keystone XL Letter Dec 2012 NEDEQ
Keystone XL Letter Dec 2012 NEDEQKeystone XL Letter Dec 2012 NEDEQ
Keystone XL Letter Dec 2012 NEDEQ
 
News Release PTP Keystone XL Nebraska
News Release PTP Keystone XL NebraskaNews Release PTP Keystone XL Nebraska
News Release PTP Keystone XL Nebraska
 
Ports-to-Plains Alliance Webinar 113012
Ports-to-Plains Alliance Webinar 113012Ports-to-Plains Alliance Webinar 113012
Ports-to-Plains Alliance Webinar 113012
 
Comments on Interim Guidance on State Freight Plans and State Advisory Commit...
Comments on Interim Guidance on State Freight Plans and State Advisory Commit...Comments on Interim Guidance on State Freight Plans and State Advisory Commit...
Comments on Interim Guidance on State Freight Plans and State Advisory Commit...
 
Interim Guidance on State Freight Plans and State Freight Advisory Committees
Interim Guidance on State Freight Plans and State Freight Advisory CommitteesInterim Guidance on State Freight Plans and State Freight Advisory Committees
Interim Guidance on State Freight Plans and State Freight Advisory Committees
 
Ports-to-Plains Alliance Northern Working Group Strategic Plan October 2012
Ports-to-Plains Alliance Northern Working Group Strategic Plan October 2012Ports-to-Plains Alliance Northern Working Group Strategic Plan October 2012
Ports-to-Plains Alliance Northern Working Group Strategic Plan October 2012
 
Return to Rural
Return to RuralReturn to Rural
Return to Rural
 

Último

Call Girls In Noida 959961⊹3876 Independent Escort Service Noida
Call Girls In Noida 959961⊹3876 Independent Escort Service NoidaCall Girls In Noida 959961⊹3876 Independent Escort Service Noida
Call Girls In Noida 959961⊹3876 Independent Escort Service Noida
dlhescort
 
Call Girls Navi Mumbai Just Call 9907093804 Top Class Call Girl Service Avail...
Call Girls Navi Mumbai Just Call 9907093804 Top Class Call Girl Service Avail...Call Girls Navi Mumbai Just Call 9907093804 Top Class Call Girl Service Avail...
Call Girls Navi Mumbai Just Call 9907093804 Top Class Call Girl Service Avail...
Dipal Arora
 
Call Girls Kengeri Satellite Town Just Call 👗 7737669865 👗 Top Class Call Gir...
Call Girls Kengeri Satellite Town Just Call 👗 7737669865 👗 Top Class Call Gir...Call Girls Kengeri Satellite Town Just Call 👗 7737669865 👗 Top Class Call Gir...
Call Girls Kengeri Satellite Town Just Call 👗 7737669865 👗 Top Class Call Gir...
amitlee9823
 
Quick Doctor In Kuwait +2773`7758`557 Kuwait Doha Qatar Dubai Abu Dhabi Sharj...
Quick Doctor In Kuwait +2773`7758`557 Kuwait Doha Qatar Dubai Abu Dhabi Sharj...Quick Doctor In Kuwait +2773`7758`557 Kuwait Doha Qatar Dubai Abu Dhabi Sharj...
Quick Doctor In Kuwait +2773`7758`557 Kuwait Doha Qatar Dubai Abu Dhabi Sharj...
daisycvs
 
FULL ENJOY Call Girls In Mahipalpur Delhi Contact Us 8377877756
FULL ENJOY Call Girls In Mahipalpur Delhi Contact Us 8377877756FULL ENJOY Call Girls In Mahipalpur Delhi Contact Us 8377877756
FULL ENJOY Call Girls In Mahipalpur Delhi Contact Us 8377877756
dollysharma2066
 
Call Girls Hebbal Just Call 👗 7737669865 👗 Top Class Call Girl Service Bangalore
Call Girls Hebbal Just Call 👗 7737669865 👗 Top Class Call Girl Service BangaloreCall Girls Hebbal Just Call 👗 7737669865 👗 Top Class Call Girl Service Bangalore
Call Girls Hebbal Just Call 👗 7737669865 👗 Top Class Call Girl Service Bangalore
amitlee9823
 

Último (20)

Falcon Invoice Discounting platform in india
Falcon Invoice Discounting platform in indiaFalcon Invoice Discounting platform in india
Falcon Invoice Discounting platform in india
 
Call Girls In Noida 959961⊹3876 Independent Escort Service Noida
Call Girls In Noida 959961⊹3876 Independent Escort Service NoidaCall Girls In Noida 959961⊹3876 Independent Escort Service Noida
Call Girls In Noida 959961⊹3876 Independent Escort Service Noida
 
RSA Conference Exhibitor List 2024 - Exhibitors Data
RSA Conference Exhibitor List 2024 - Exhibitors DataRSA Conference Exhibitor List 2024 - Exhibitors Data
RSA Conference Exhibitor List 2024 - Exhibitors Data
 
Call Girls Navi Mumbai Just Call 9907093804 Top Class Call Girl Service Avail...
Call Girls Navi Mumbai Just Call 9907093804 Top Class Call Girl Service Avail...Call Girls Navi Mumbai Just Call 9907093804 Top Class Call Girl Service Avail...
Call Girls Navi Mumbai Just Call 9907093804 Top Class Call Girl Service Avail...
 
Forklift Operations: Safety through Cartoons
Forklift Operations: Safety through CartoonsForklift Operations: Safety through Cartoons
Forklift Operations: Safety through Cartoons
 
Organizational Transformation Lead with Culture
Organizational Transformation Lead with CultureOrganizational Transformation Lead with Culture
Organizational Transformation Lead with Culture
 
VVVIP Call Girls In Greater Kailash ➡️ Delhi ➡️ 9999965857 🚀 No Advance 24HRS...
VVVIP Call Girls In Greater Kailash ➡️ Delhi ➡️ 9999965857 🚀 No Advance 24HRS...VVVIP Call Girls In Greater Kailash ➡️ Delhi ➡️ 9999965857 🚀 No Advance 24HRS...
VVVIP Call Girls In Greater Kailash ➡️ Delhi ➡️ 9999965857 🚀 No Advance 24HRS...
 
Call Girls Ludhiana Just Call 98765-12871 Top Class Call Girl Service Available
Call Girls Ludhiana Just Call 98765-12871 Top Class Call Girl Service AvailableCall Girls Ludhiana Just Call 98765-12871 Top Class Call Girl Service Available
Call Girls Ludhiana Just Call 98765-12871 Top Class Call Girl Service Available
 
Enhancing and Restoring Safety & Quality Cultures - Dave Litwiller - May 2024...
Enhancing and Restoring Safety & Quality Cultures - Dave Litwiller - May 2024...Enhancing and Restoring Safety & Quality Cultures - Dave Litwiller - May 2024...
Enhancing and Restoring Safety & Quality Cultures - Dave Litwiller - May 2024...
 
Mondelez State of Snacking and Future Trends 2023
Mondelez State of Snacking and Future Trends 2023Mondelez State of Snacking and Future Trends 2023
Mondelez State of Snacking and Future Trends 2023
 
John Halpern sued for sexual assault.pdf
John Halpern sued for sexual assault.pdfJohn Halpern sued for sexual assault.pdf
John Halpern sued for sexual assault.pdf
 
Call Girls Kengeri Satellite Town Just Call 👗 7737669865 👗 Top Class Call Gir...
Call Girls Kengeri Satellite Town Just Call 👗 7737669865 👗 Top Class Call Gir...Call Girls Kengeri Satellite Town Just Call 👗 7737669865 👗 Top Class Call Gir...
Call Girls Kengeri Satellite Town Just Call 👗 7737669865 👗 Top Class Call Gir...
 
Quick Doctor In Kuwait +2773`7758`557 Kuwait Doha Qatar Dubai Abu Dhabi Sharj...
Quick Doctor In Kuwait +2773`7758`557 Kuwait Doha Qatar Dubai Abu Dhabi Sharj...Quick Doctor In Kuwait +2773`7758`557 Kuwait Doha Qatar Dubai Abu Dhabi Sharj...
Quick Doctor In Kuwait +2773`7758`557 Kuwait Doha Qatar Dubai Abu Dhabi Sharj...
 
Famous Olympic Siblings from the 21st Century
Famous Olympic Siblings from the 21st CenturyFamous Olympic Siblings from the 21st Century
Famous Olympic Siblings from the 21st Century
 
FULL ENJOY Call Girls In Mahipalpur Delhi Contact Us 8377877756
FULL ENJOY Call Girls In Mahipalpur Delhi Contact Us 8377877756FULL ENJOY Call Girls In Mahipalpur Delhi Contact Us 8377877756
FULL ENJOY Call Girls In Mahipalpur Delhi Contact Us 8377877756
 
Pharma Works Profile of Karan Communications
Pharma Works Profile of Karan CommunicationsPharma Works Profile of Karan Communications
Pharma Works Profile of Karan Communications
 
Monthly Social Media Update April 2024 pptx.pptx
Monthly Social Media Update April 2024 pptx.pptxMonthly Social Media Update April 2024 pptx.pptx
Monthly Social Media Update April 2024 pptx.pptx
 
Business Model Canvas (BMC)- A new venture concept
Business Model Canvas (BMC)-  A new venture conceptBusiness Model Canvas (BMC)-  A new venture concept
Business Model Canvas (BMC)- A new venture concept
 
How to Get Started in Social Media for Art League City
How to Get Started in Social Media for Art League CityHow to Get Started in Social Media for Art League City
How to Get Started in Social Media for Art League City
 
Call Girls Hebbal Just Call 👗 7737669865 👗 Top Class Call Girl Service Bangalore
Call Girls Hebbal Just Call 👗 7737669865 👗 Top Class Call Girl Service BangaloreCall Girls Hebbal Just Call 👗 7737669865 👗 Top Class Call Girl Service Bangalore
Call Girls Hebbal Just Call 👗 7737669865 👗 Top Class Call Girl Service Bangalore
 

Wyoming Trade through Ports-to-Plains Region – 2004-2010

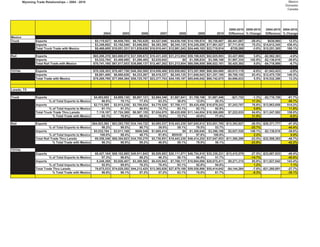
  • 1. Wyoming Trade Relationships -- 2004 - 2010 Mexico Domestic Canada 2009-2010 2009-2010 2004-2010 2004-2010 2004 2005 2006 2007 2008 2009 2010 Difference % Change Difference % Change Mexico Truck Exports $5,119,927 $6,858,785 $8,792,828 $4,527,046 $4,636,108 $14,199,974 $5,758,887 -$8,441,087 -59.4% $638,960 12.5% Imports $3,348,682 $3,192,546 $3,046,802 $6,383,395 $8,345,135 $10,249,209 $17,961,027 $7,711,818 75.2% $14,612,345 436.4% Total Truck Trade with Mexico $8,468,609 $10,051,331 $11,839,630 $10,910,441 $12,981,243 $24,449,183 $23,719,914 -$729,269 -3.0% $15,251,305 180.1% #DIV/0! Rail Exports $65,208,376 $63,608,973 $37,599,672 $10,431,420 $31,213,954 $59,198,025 $62,625,993 $3,427,968 5.8% -$2,582,383 -4.0% Imports $5,532,784 $3,408,080 $1,286,465 $2,035,842 $0 $1,398,834 $3,396,168 $1,997,334 142.8% -$2,136,616 -38.6% Total Rail Trade with Mexico $70,741,160 $67,017,053 $38,886,137 $12,467,262 $31,213,954 $60,596,859 $66,022,161 $5,425,302 9.0% -$4,718,999 -6.7% #DIV/0! TOTAL Exports $70,328,303 $70,467,758 $46,392,500 $14,958,466 $35,850,062 $73,397,999 $68,384,880 -$5,013,119 -6.8% -$1,943,423 -2.8% Imports $8,881,466 $6,600,626 $4,333,267 $8,419,237 $8,345,135 $11,648,043 $21,357,195 $9,709,152 83.4% $12,475,729 140.5% Total Trade with Mexico $79,209,769 $77,068,384 $50,725,767 $23,377,703 $44,195,197 $85,046,042 $89,742,075 $4,696,033 5.5% $10,532,306 13.3% Laredo, TX Truck Exports $4,403,602 $4,809,130 $6,807,121 $2,864,346 $1,667,841 $1,709,198 $1,687,446 -$21,752 -1.3% -$2,716,156 -61.7% % of Total Exports to Mexico 86.0% 70.1% 77.4% 63.3% 36.0% 12.0% 29.3% 17.3% -56.7% Imports $2,715,585 $2,915,239 $2,700,034 $4,770,529 $7,768,117 $9,435,456 $16,679,243 $7,243,787 76.8% $13,963,658 514.2% % of Total Imports to Mexico 81.1% 91.3% 88.6% 74.7% 93.1% 92.1% 92.9% 0.8% 11.8% Total Truck Trade Thru Laredo 7,119,187 $7,724,369 $9,507,155 $7,634,875 $9,435,958 $11,144,654 $18,366,689 $7,222,035 64.8% $11,247,502 158.0% % Total Trade with Mexico 84.1% 76.8% 80.3% 70.0% 72.7% 45.6% 77.4% 31.8% -6.6% Rail Exports $64,023,562 $63,293,755 $34,104,722 $4,065,537 $18,443,230 $47,045,612 $33,651,785 -$13,393,827 -28.5% -$30,371,777 -47.4% % of Total Exports to Mexico 98.2% 99.5% 90.7% 39.0% 59.1% 79.5% 53.7% -25.7% -44.4% Imports $5,532,784 $3,011,168 $600,548 $1,665,414 $0 $1,368,640 $3,396,168 $2,027,528 148.1% -$2,136,616 -38.6% % of Total Imports to Mexico 100.0% 88.4% 46.7% 81.8% #DIV/0! 97.8% 100.0% 2.2% 0.0% Total Rail Trade Thru Laredo 69,556,346 $66,304,923 $34,705,270 $5,730,951 $18,443,230 $48,414,252 $37,047,953 -$11,366,299 -23.5% -$32,508,393 -46.7% % Total Trade with Mexico 98.3% 98.9% 89.2% 46.0% 59.1% 79.9% 56.1% -23.8% -42.2% TOTAL Exports 68,427,164 $68,102,885 $40,911,843 $6,929,883 $20,111,071 $48,754,810 $35,339,231 -$13,415,579 -27.5% -$33,087,933 -48.4% % of Total Exports to Mexico 97.3% 96.6% 88.2% 46.3% 56.1% 66.4% 51.7% -14.7% -45.6% Imports 8,248,369 $5,926,407 $3,300,582 $6,435,943 $7,768,117 $10,804,096 $20,075,411 $9,271,315 85.8% $11,827,042 143.4% % of Total Imports to Mexico 92.9% 89.8% 76.2% 76.4% 93.1% 92.8% 94.0% 1.2% 1.1% Total Trade Thru Laredo 76,675,533 $74,029,292 $44,212,425 $13,365,826 $27,879,188 $59,558,906 $55,414,642 -$4,144,264 -7.0% -$21,260,891 -27.7% % Total Trade with Mexico 96.8% 96.1% 87.2% 57.2% 63.1% 70.0% 61.7% -8.3% -35.1%
  • 2. Wyoming Trade Relationships -- 2004 - 2010 Mexico Domestic Canada 2009-2010 2009-2010 2004-2010 2004-2010 2004 2005 2006 2007 2008 2009 2010 Difference % Change Difference % Change Eagle Pass, TX Truck Exports $0 $62,706 $9,689 $19,800 $47,696 $33,453 $33,020 -$433 -1.3% $33,020 #DIV/0! % of Total Exports to Mexico 0.0% 0.9% 0.1% 0.4% 1.0% 0.2% 0.6% 0.3% 0.6% Imports $0 $0 $0 $0 $0 $0 $0 $0 #DIV/0! $0 #DIV/0! % of Total Imports to Mexico 0.0% 0.0% 0.0% 0.0% 0.0% 0.0% 0.0% 0.0% 0.0% Total Truck Trade Thru Eagle Pass $0 $62,706 $9,689 $19,800 $47,696 $33,453 $33,020 -$433 -1.3% $33,020 #DIV/0! % Total Trade with Mexico 0.0% 0.6% 0.1% 0.2% 0.4% 0.1% 0.1% 0.0% 0.1% Rail Exports $55,841 $123,262 $0 $2,725,232 $3,131,941 $9,325,913 $17,832,017 $8,506,104 91.2% $17,776,176 31833.6% % of Total Exports to Mexico 0.1% 0.2% 0.0% 26.1% 10.0% 15.8% 28.5% 12.7% 28.4% Imports $0 $0 $0 $0 $0 $0 $0 $0 #DIV/0! $0 #DIV/0! % of Total Imports to Mexico 0.0% 0.0% 0.0% 0.0% #DIV/0! 0.0% 0.0% 0.0% 0.0% Total Rail Trade Thru Eagle Pass 55,841 $123,262 $0 $2,725,232 $3,131,941 $9,325,913 $17,832,017 $8,506,104 91.2% $17,776,176 31833.6% % Total Trade with Mexico 0.1% 0.2% 0.0% 21.9% 10.0% 15.4% 27.0% 11.6% 26.9% TOTAL Exports 55,841 $185,968 $9,689 $2,745,032 $3,179,637 $9,359,366 $17,865,037 $8,505,671 90.9% $17,809,196 31892.7% % of Total Exports to Mexico 0.1% 0.3% 0.0% 18.4% 8.9% 12.8% 26.1% 13.4% 26.0% Imports $0 $0 $0 $0 $0 $0 $0 $0 #DIV/0! $0 #DIV/0! % of Total Imports to Mexico 0.0% 0.0% 0.0% 0.0% 0.0% 0.0% 0.0% 0.0% 0.0% Total Trade Thru Eagle Pass 55,841 $185,968 $9,689 $2,745,032 $3,179,637 $9,359,366 $17,865,037 $8,505,671 90.9% $17,809,196 31892.7% % Total Trade with Mexico 0.1% 0.2% 0.0% 11.7% 7.2% 11.0% 19.9% 8.9% 19.8% Del Rio, TX Truck Exports $0 $0 $0 $5,000 $0 $0 $0 $0 #DIV/0! $0 #DIV/0! % of Total Exports to Mexico 0.0% 0.0% 0.0% 0.1% 0.0% 0.0% 0.0% 0.0% 0.0% Imports $0 $0 $0 $0 $0 $0 $0 $0 #DIV/0! $0 #DIV/0! % of Total Imports to Mexico 0.0% 0.0% 0.0% 0.0% 0.0% 0.0% 0.0% 0.0% 0.0% Total Truck Trade Thru Del Rio $0 $0 $0 $5,000 $0 $0 $0 $0 #DIV/0! $0 #DIV/0! % Total Trade with Mexico 0.0% 0.0% 0.0% 0.0% 0.0% 0.0% 0.0% 0.0% 0.0% Rail Exports $0 $0 $0 #DIV/0! $0 #DIV/0! % of Total Exports to Mexico 0.0% 0.0% #DIV/0! #DIV/0! #DIV/0! #DIV/0! #DIV/0! #DIV/0! Imports $0 $0 $0 #DIV/0! $0 #DIV/0! % of Total Imports to Mexico 0.0% 0.0% #DIV/0! #DIV/0! #DIV/0! #DIV/0! #DIV/0! #DIV/0! Total Rail Trade Thru Del Rio $0 $0 $0 #DIV/0! $0 #DIV/0! % Total Trade with Mexico 0.0% 0.0% 0.0% 0.0% 0.0% 0.0% 0.0% 0.0% TOTAL Exports $0 $0 $0 $5,000 $0 $0 $0 $0 #DIV/0! $0 #DIV/0! % of Total Exports to Mexico 0.0% 0.0% 0.0% 0.0% 0.0% 0.0% 0.0% 0.0% 0.0% Imports $0 $0 $0 $0 $0 $0 $0 $0 #DIV/0! $0 #DIV/0! % of Total Imports to Mexico 0.0% 0.0% 0.0% 0.0% 0.0% 0.0% 0.0% 0.0% 0.0% Total Trade Thru Del Rio $0 $0 $0 $5,000 $0 $0 $0 $0 #DIV/0! $0 #DIV/0! % Total Trade with Mexico 0.0% 0.0% 0.0% 0.0% 0.0% 0.0% 0.0% 0.0% 0.0%
  • 3. Wyoming Trade Relationships -- 2004 - 2010 Mexico Domestic Canada 2009-2010 2009-2010 2004-2010 2004-2010 2004 2005 2006 2007 2008 2009 2010 Difference % Change Difference % Change GPITC Truck Exports 4,403,602 $4,871,836 $6,816,810 $2,889,146 $1,715,537 $1,742,651 $1,720,466 -$22,185 -1.3% -$2,683,136 -60.9% % of Total Exports to Mexico 86.0% 71.0% 77.5% 63.8% 37.0% 12.3% 29.9% 17.6% -56.1% Imports 2,715,585 $2,915,239 $2,700,034 $4,770,529 $7,768,117 $9,435,456 $16,679,243 $7,243,787 76.8% $13,963,658 514.2% % of Total Imports to Mexico 81.1% 91.3% 88.6% 74.7% 93.1% 92.1% 92.9% 0.8% 11.8% Total Truck Trade Thru GPITC 7,119,187 $7,787,075 $9,516,844 $7,659,675 $9,483,654 $11,178,107 $18,399,709 $7,221,602 64.6% $11,280,522 158.5% % Total Trade with Mexico 84.1% 77.5% 80.4% 70.2% 73.1% 45.7% 77.6% 31.9% -6.5% Rail Exports 64,079,403 $63,417,017 $34,104,722 $6,790,769 $21,575,171 $56,371,525 $51,483,802 -$4,887,723 -8.7% -$12,595,601 -19.7% % of Total Exports to Mexico 98.3% 99.7% 90.7% 65.1% 69.1% 95.2% 82.2% -13.0% -16.1% Imports 5,532,784 $3,011,168 $600,548 $1,665,414 $0 $1,368,640 $3,396,168 $2,027,528 148.1% -$2,136,616 -38.6% % of Total Imports to Mexico 100.0% 88.4% 46.7% 81.8% #DIV/0! 97.8% 100.0% 2.2% 0.0% Total Rail Trade Thru GPITC 69,612,187 $66,428,185 $34,705,270 $8,456,183 $21,575,171 $57,740,165 $54,879,970 -$2,860,195 -5.0% -$14,732,217 -21.2% % Total Trade with Mexico 98.4% 99.1% 89.2% 67.8% 69.1% 95.3% 83.1% -12.2% -15.3% TOTAL Exports 68,483,005 $68,288,853 $40,921,532 $9,679,915 $23,290,708 $58,114,176 $53,204,268 -$4,909,908 -8.4% -$15,278,737 -22.3% % of Total Exports to Mexico 97.4% 96.9% 88.2% 64.7% 65.0% 79.2% 77.8% -1.4% -19.6% Imports 8,248,369 $5,926,407 $3,300,582 $6,435,943 $7,768,117 $10,804,096 $20,075,411 $9,271,315 85.8% $11,827,042 143.4% % of Total Imports to Mexico 92.9% 89.8% 76.2% 76.4% 93.1% 92.8% 94.0% 1.2% 1.1% Total Trade Thru GPITC 76,731,374 $74,215,260 $44,222,114 $16,115,858 $31,058,825 $68,918,272 $73,279,679 $4,361,407 6.3% -$3,451,695 -4.5% % Total Trade with Mexico 96.9% 96.3% 87.2% 68.9% 70.3% 81.0% 81.7% 0.6% -15.2%
  • 4. Wyoming Trade Relationships -- 2004 - 2010 Mexico Domestic Canada 2010 Leading Exports from Wyoming to Mexico (Surface 2010 2010 Leading Exports from Wyoming to Mexico (Surface 2010 Transportation) Transportation) Rank Export Rank Coahuila Export 1 28 Inorganic Chemicals $50,903,301 1 25 Salt; Sulfur; Plaster and Cement $1,492,823 2 25 Salt; Sulfur; Plaster and Cement $6,253,049 2 28 Inorganic Chemicals $180,772 3 27 Mineral Fuels; Oils and Waxes $5,888,157 3 87 Vehicles Other than Railway $46,410 4 7 Edible Vegetables and Roots $1,718,570 4 39 Plastics and Articles $37,525 5 76 Aluminum and Articles $716,728 5 85 Electrical Machinery; Equipment and Parts $12,216 6 84 Computer-Related Machinery and Parts $653,777 6 7 87 Vehicles Other than Railway $646,559 7 8 74 Copper and Articles $535,081 8 9 38 Miscellaneous Chemical Products $248,887 9 10 10 Cereals $229,956 10 2010 Leading Imports to Wyoming from Mexico (Surface 2010 2010 Leading Exports from Wyoming to Mexico (Surface 2010 Rank Import Rank Nuevo Leon Export 1 84 Computer-Related Machinery and Parts $7,915,692.00 1 7 Edible Vegetables and Roots $1,581,364 2 98 Special Classification Provisions $6,675,493.00 2 74 Copper and Articles $531,773 3 85 Electrical Machinery; Equipment and Parts $4,426,562.00 3 10 Cereals $229,956 4 73 Articles of Iron and Steel $521,150.00 4 84 Computer-Related Machinery and Parts $169,630 5 87 Vehicles Other than Railway $423,980.00 5 25 Salt; Sulfur; Plaster and Cement $152,934 6 95 Toys; Games and Sport Equipment $358,630.00 6 39 Plastics and Articles $10,299 7 94 Furniture; Lamps and Prefabricated Buildings $352,172.00 7 90 Measuring and Testing Instruments $9,011 8 82 Tools of Base Metal $302,481.00 8 87 Vehicles Other than Railway 4,130.00 9 28 Inorganic Chemicals $168,322.00 9 10 39 Plastics and Articles $52,548.00 10 2010 Leading Exports from Wyoming to Mexico (Surface 2010 Rank Tamaulipas Export 1 87 Vehicles Other than Railway $73,708 2 44 Wood and Articles $23,144 3 4 5 6 7 8 9 10
  • 5. Wyoming Trade Relationships -- 2004 - 2010 Mexico Domestic Canada Rail Truck Change Change Rail Truck Domestic -- 2002- 2002- 2002 Domestic -- 2007 Change Change 2015 2015 2015 Exports Rail Truck Exports Rail Truck Exports Rail Truck Colorado 90 603 44% Colorado 232 1,179 37% 0% 96% Colorado 231 1,610 41% 157% 167% Montana 0 53 3% Montana 91 238 9% #DIV/0! 349% Montana 33 362 9% #DIV/0! 583% Nebraska 88 0 6% Nebraska 238 6% 170% #DIV/0! Nebraska 189 206 9% 114% #DIV/0! New Mexico 2 9 1% New Mexico 0% -100% -100% New Mexico 48 1% -100% 431% North Dakota 0 12 1% North Dakota 44 1% #DIV/0! 267% North Dakota 7 46 1% #DIV/0! 284% Oklahoma 148 0 9% Oklahoma 261 7% 76% #DIV/0! Oklahoma 240 44 6% 62% #DIV/0! South Dakota 0 64 4% South Dakota 22 335 9% #DIV/0! 423% South Dakota 26 297 7% #DIV/0! 364% Texas 432 63 32% Texas 1,015 133 30% 135% 111% Texas 1,016 150 26% 135% 139% Wyoming Wyoming Wyoming Total (4$m) 760 804 Total ($m) 1,859 1,929 100% 145% 140% Total ($m) 1,741 2,763 100% 129% 244% 1,564 3,788 142% 4,504 188% Millions Imports Rail Truck Imports Rail Truck Imports Rail Truck Colorado 0 1,105 55% Colorado 0 2,337 40% #DIV/0! 111% Colorado 1 2,883 38% #DIV/0! 161% Montana 0 460 23% Montana 907 16% #DIV/0! 97% Montana 15 1,253 17% #DIV/0! 172% Nebraska 0 20 1% Nebraska 465 8% #DIV/0! 2225% Nebraska 4 478 6% #DIV/0! 2292% New Mexico 0 275 14% New Mexico 0% #DIV/0! -100% New Mexico - 45 1% #DIV/0! -83% North Dakota 0 12 1% North Dakota 0% #DIV/0! -100% North Dakota - 118 2% #DIV/0! 887% Oklahoma 16 0 1% Oklahoma 473 8% -100% #DIV/0! Oklahoma 178 619 11% 1013% #DIV/0! South Dakota 0 122 6% South Dakota 372 6% #DIV/0! 205% South Dakota - 472 6% #DIV/0! 287% Texas 0 0 0% Texas 29 1,192 21% #DIV/0! #DIV/0! Texas 39 1,451 20% #DIV/0! #DIV/0! Wyoming Wyoming Wyoming 0 Total ($m) 16 1,994 Total ($m) 29 5,746 100% 81% 188% Total ($m) 238 7,320 100% 1387% 267% 2,010 5,775 187% 7,558 276% Millions TOTALS Rail Truck TOTALS Rail Truck TOTALS Rail Truck Colorado 90 1,708 50% Colorado 232 3,516 39% 158% 106% Colorado 232 4,493 39% 158% 163% Montana 0 513 14% Montana 91 1,145 13% #DIV/0! 123% Montana 48 1,615 14% #DIV/0! 215% Nebraska 88 20 3% Nebraska 238 465 7% 170% 2225% Nebraska 193 685 7% 119% 3323% New Mexico 2 284 8% New Mexico 0 0 0% -100% -100% New Mexico - 93 1% -100% -67% North Dakota 0 24 1% North Dakota 0 44 0% #DIV/0! 83% North Dakota 7 165 1% #DIV/0! 585% Oklahoma 164 0 5% Oklahoma 261 473 8% 59% #DIV/0! Oklahoma 418 663 9% 155% #DIV/0! South Dakota 0 186 5% South Dakota 22 707 8% #DIV/0! 280% South Dakota 26 769 7% #DIV/0! 313% Texas 432 63 14% Texas 1,044 1,325 25% 142% 2003% Texas 1,055 1,601 22% 144% 2442% Wyoming Wyoming Wyoming 0 Total ($m) $776 $2,798 Total ($m) 1,888 7,675 100% 143% 174% Total ($m) 1,979 10,083 100% #DIV/0! 260% 3,574 9,563 168% 12,062 238%
  • 6. Wyoming Trade Relationships -- 2004 - 2010 Mexico Domestic Canada 2009-2010 2009-2010 2004-2010 2004-2010 2004 2005 2006 2007 2008 2009 2010 Difference % Change Difference % Change Canada Truck Exports $72,189,910.00 $70,972,652 $111,239,142 $108,638,684 $110,854,504 $110,586,560 $103,437,966 -$7,148,594 -6.5% $31,248,056 43.3% Imports $215,051,782.00 $253,165,113 $373,773,484 $495,976,463 $424,932,750 $328,428,351 $251,238,190 -$77,190,161 -23.5% $36,186,408 16.8% Total Truck Trade with Canada $287,241,692.00 $324,137,765 $485,012,626 $604,615,147 $535,787,254 $439,014,911 $354,676,156 -$84,338,755 -19.2% $67,434,464 23.5% #DIV/0! Rail Exports $38,422,577.00 $48,077,996 $54,092,812 $73,430,406 $173,028,729 $103,010,321 $132,350,275 $29,339,954 28.5% $93,927,698 244.5% Imports $57,220,542.00 $100,613,509 $168,789,269 $97,833,058 $125,665,661 $68,581,572 $114,872,822 $46,291,250 67.5% $57,652,280 100.8% Total Rail Trade with Canada $95,643,119.00 $148,691,505 $222,882,081 $171,263,464 $298,694,390 $171,591,893 $247,223,097 $75,631,204 44.1% $151,579,978 158.5% #DIV/0! TOTAL Exports $110,612,487.00 $119,050,648 $165,331,954 $182,069,090 $283,883,233 $213,596,881 $235,788,241 $22,191,360 10.4% $125,175,754 113.2% Imports $272,272,324.00 $353,778,622 $542,562,753 $593,809,521 $550,598,411 $397,009,923 $366,111,012 -$30,898,911 -7.8% $93,838,688 34.5% Total Trade with Canada $382,884,811.00 $472,829,270 $707,894,707 $775,878,611 $834,481,644 $610,606,804 $601,899,253 -$8,707,551 -1.4% $219,014,442 57.2% Raymond, MT Truck Exports $990,141 $3,336,776 $2,444,362 $1,875,226 $2,733,685 $5,227,509 $3,427,979 -$1,799,530 -34.4% $2,437,838 246.2% % of Total Exports to Canada 1.4% 4.7% 2.2% 1.7% 2.5% 4.7% 3.3% -1.4% 1.9% Imports $2,673,998 $4,321,524 $6,213,717 $10,684,074 $8,446,266 $10,586,099 $10,560,497 -$25,602 -0.2% $7,886,499 294.9% % of Total Imports to Canada 1.2% 1.7% 1.7% 2.2% 2.0% 3.2% 4.2% 1.0% 3.0% Total Truck Trade Thru Raymond $3,664,139 $7,658,300 $8,658,079 $12,559,300 $11,179,951 $15,813,608 $13,988,476 -$1,825,132 -11.5% $10,324,337 281.8% % Total Trade with Canada 1.3% 2.4% 1.8% 2.1% 2.1% 3.6% 3.9% 0.3% 2.7% Rail Exports $0 $0 #DIV/0! $0 #DIV/0! % of Total Exports to Canada 0.0% 0.0% 0.0% 0.0% 0.0% 0.0% 0.0% 0.0% 0.0% Imports $0 $0 #DIV/0! $0 #DIV/0! % of Total Imports to Canada 0.0% 0.0% 0.0% 0.0% 0.0% 0.0% 0.0% 0.0% 0.0% Total Truck Trade Thru Raymond $0 $0 $0 $0 $0 $0 $0 #DIV/0! $0 #DIV/0! % Total Trade with Canada 0.0% 0.0% 0.0% 0.0% 0.0% 0.0% 0.0% 0.0% 0.0% TOTAL Exports $990,141 $3,336,776 $2,444,362 $1,875,226 $2,733,685 $5,227,509 $3,427,979 -$1,799,530 -34.4% $2,437,838 246.2% % of Total Exports to Canada 0.9% 2.8% 1.5% 1.0% 1.0% 2.4% 1.5% -1.0% 0.6% Imports $2,673,998 $4,321,524 $6,213,717 $10,684,074 $8,446,266 $10,586,099 $10,560,497 -$25,602 -0.2% $7,886,499 294.9% % of Total Imports to Canada 1.0% 1.2% 1.1% 1.8% 1.5% 2.7% 2.9% 0.2% 1.9% Total Trade Thru Raymond $3,664,139 $7,658,300 $8,658,079 $12,559,300 $11,179,951 $15,813,608 $13,988,476 -$1,825,132 -11.5% $10,324,337 281.8% % Total Trade with Canada 1.0% 1.6% 1.2% 1.6% 1.3% 2.6% 2.3% -0.3% 1.4%
  • 7. Wyoming Trade Relationships -- 2004 - 2010 Mexico Domestic Canada 2009-2010 2009-2010 2004-2010 2004-2010 2004 2005 2006 2007 2008 2009 2010 Difference % Change Difference % Change Sweet Grass Truck Exports $43,466,772 $45,969,289 $67,144,212 $74,101,418 $71,289,456 $75,046,699 $69,271,053 -$5,775,646 -7.7% $25,804,281 59.4% % of Total Exports to Canada 60.2% 64.8% 60.4% 68.2% 64.3% 67.9% 67.0% -0.9% 6.8% Imports $143,883,259 $171,311,240 $270,083,843 $390,133,234 $308,180,052 $239,163,064 $162,167,172 -$76,995,892 -32.2% $18,283,913 12.7% % of Total Exports to Canada 66.9% 67.7% 72.3% 78.7% 72.5% 72.8% 64.5% -8.3% -2.4% Total Truck Trade Thru Sweet Grass 187,350,031 $217,280,529 $337,228,055 $464,234,652 $379,469,508 $314,209,763 $231,438,225 -$82,771,538 -26.3% $44,088,194 23.5% % Total Trade with Canada 65.2% 67.0% 69.5% 76.8% 70.8% 71.6% 65.3% -6.3% 0.0% Rail Exports $2,837,350 $3,809,557 $5,504,007 $12,649,453 $65,368,038 $24,097,005 $52,062,914 $27,965,909 116.1% $49,225,564 1734.9% % of Total Exports to Canada 7.4% 7.9% 10.2% 17.2% 37.8% 23.4% 39.3% 15.9% 32.0% Imports $35,281,327 $45,313,995 $63,282,823 $54,216,953 $46,010,091 $31,072,231 $40,935,220 $9,862,989 31.7% $5,653,893 16.0% % of Total Exports to Canada 61.7% 45.0% 37.5% 55.4% 36.6% 45.3% 35.6% -9.7% -26.0% Total Rail Trade Thru Sweet Grass $38,118,677 $49,123,552 $68,786,830 $66,866,406 $111,378,129 $55,169,236 $92,998,134 $37,828,898 68.6% $54,879,457 144.0% % Total Trade with Canada 39.9% 33.0% 30.9% 39.0% 37.3% 32.2% 37.6% 5.5% -2.2% TOTAL Exports $46,304,122 $49,778,846 $72,648,219 $86,750,871 $136,657,494 $99,143,704 $121,333,967 $22,190,263 22.4% $75,029,845 162.0% % of Total Exports to Canada 41.9% 41.8% 43.9% 47.6% 48.1% 46.4% 51.5% 5.0% 9.6% Imports $179,164,586 $216,625,235 $333,366,666 $444,350,187 $354,190,143 $270,235,295 $203,102,392 -$67,132,903 -24.8% $23,937,806 13.4% % of Total Imports to Canada 65.8% 61.2% 61.4% 74.8% 64.3% 68.1% 55.5% -12.6% -10.3% Total Trade Thru Sweet Grass $225,468,708 $266,404,081 $406,014,885 $531,101,058 $490,847,637 $369,378,999 $324,436,359 -$44,942,640 -12.2% $98,967,651 43.9% % Total Trade with Canada 58.9% 56.3% 57.4% 68.5% 58.8% 60.5% 53.9% -6.6% -5.0% Portal, ND Truck Exports $1,525,731 $2,343,253 $2,168,937 $3,434,969 $4,713,861 $2,257,527 $2,337,558 $80,031 3.5% $811,827 53.2% % of Total Exports to Canada 2.1% 3.3% 1.9% 3.2% 4.3% 2.0% 2.3% 0.2% 0.1% Imports $2,352,105 $2,535,344 $5,015,371 $6,387,135 $10,667,823 $3,765,523 $5,085,835 $1,320,312 35.1% $2,733,730 116.2% % of Total Imports to Canada 1.1% 1.0% 1.3% 1.3% 2.5% 1.1% 2.0% 0.9% 0.9% Total Truck Trade Thru Portal $3,877,836 $4,878,597 $9,822,104 $15,381,684 $6,023,050 $7,423,393 $1,400,343 23.2% $3,545,557 91.4% % Total Trade with Canada 1.4% 1.5% 0.0% 1.6% 2.9% 1.4% 2.1% 0.7% 0.7% Rail Exports $537,259 $680,401 $95,087 $18,321 $500,799 $1,782,999 $698,226 $603,139 -60.8% $160,967 30.0% % of Total Exports to Canada 1.4% 1.4% 0.2% 0.0% 0.3% 1.7% 0.5% -1.2% -0.9% Imports $0 $311,226 $12,192,460 $984,665 $427,586 $0 $27,102 -$12,165,358 #DIV/0! $27,102 #DIV/0! % of Total Imports to Canada 0.0% 0.3% 7.2% 1.0% 0.3% 0.0% 0.0% 0.0% 0.0% Total Rail Trade Thru Portal $537,259 $991,627 $12,287,547 $1,002,986 $928,385 $1,782,999 $725,328 -$11,562,219 -59.3% $188,069 35.0% % Total Trade with Canada 0.6% 0.7% 5.5% 0.6% 0.3% 1.0% 0.3% -0.7% -0.3% TOTAL Exports $2,062,990 $3,023,654 $2,264,024 $3,434,969 $4,713,861 $2,257,527 $2,337,558 $80,031 3.5% $972,794 13.3% % of Total Exports to Canada 1.9% 2.5% 1.4% 1.9% 1.7% 1.1% 1.0% -0.1% -0.9% Imports $2,352,105 $2,846,570 $17,207,831 $7,371,800 $11,095,409 $3,765,523 $5,112,937 $1,347,414 35.8% $2,760,832 117.4% % of Total Imports to Canada 0.9% 0.8% 3.2% 1.2% 2.0% 0.9% 1.4% 0.4% 0.5% Total Trade Thru Portal $4,415,095 $5,870,224 $12,287,547 $10,806,769 $15,809,270 $6,023,050 $7,450,495 $1,427,445 23.7% $3,733,626 68.8% % Total Trade with Canada 1.2% 1.2% 1.7% 1.4% 1.9% 1.0% 1.2% 0.3% 0.1%
  • 8. Wyoming Trade Relationships -- 2004 - 2010 Mexico Domestic Canada 2009-2010 2009-2010 2004-2010 2004-2010 2004 2005 2006 2007 2008 2009 2010 Difference % Change Difference % Change Wild Horse 0 Truck Exports $0 $0 $0 $0 $0 $0 $0 $0 #DIV/0! $0 #DIV/0! % of Total Exports to Canada 0.0% 0.0% 0.0% 19.4% 0.0% 0.0% 0.0% 0.0% 0.0% Imports $0 $985,271 $23,768 $129,827 $54,385 $311,834 $57,255 -$254,579 -81.6% $57,255 #DIV/0! % of Total Imports to Canada 0.0% 0.4% 0.0% 19.0% 0.0% 0.1% 0.0% -0.1% 0.0% Total Truck Trade Thru GPITC $0 $985,271 $23,768 $129,827 $54,385 $311,834 $57,255 -$254,579 -81.6% $57,255 #DIV/0! % Total Trade with Canada 0.0% 0.3% 0.0% 19.3% 0.0% 0.1% 0.0% -0.1% 0.0% Rail Exports $0 $0 $0 $0 $0 $0 $0 $0 #DIV/0! $0 #DIV/0! % of Total Exports to Canada 0.0% 0.0% 0.0% 11.0% 0.0% 0.0% 0.0% 0.0% 0.0% Imports $0 $0 $0 $0 #DIV/0! $0 #DIV/0! % of Total Imports to Canada 0.0% 0.0% 0.0% 22.4% 0.0% 0.0% 0.0% 0.0% 0.0% Total Rail Trade Thru GPITC $0 $0 $0 $0 $0 $0 $0 $0 #DIV/0! $0 #DIV/0! % Total Trade with Canada 0.0% 0.0% 0.0% 17.7% 0.0% 0.0% 0.0% 0.0% 0.0% TOTAL Exports $0 $0 $0 $0 $0 $0 $0 $0 #DIV/0! $0 #DIV/0! % of Total Exports to Canada 0.0% 0.0% 0.0% 0.0% 0.0% 0.0% 0.0% 0.0% 0.0% Imports $0 $985,271 $23,768 $129,827 $54,385 $311,834 $57,255 -$254,579 -81.6% $57,255 #DIV/0! % of Total Imports to Canada 0.0% 0.3% 0.0% 0.0% 0.0% 0.1% 0.0% -0.1% 0.0% Total Trade Thru GPITC $0 $985,271 $23,768 $129,827 $54,385 $311,834 $57,255 -$254,579 -81.6% $57,255 #DIV/0! % Total Trade with Canada 0.0% 0.2% 0.0% 0.0% 0.0% 0.1% 0.0% 0.0% 0.0% GPITC #DIV/0! Truck Exports $45,982,644 $51,649,318 $71,757,511 $79,411,613 $78,737,002 $82,531,735 $75,036,590 -$7,495,145 -9.1% $29,053,946 63.2% % of Total Exports to Canada 63.7% 72.8% 64.5% 73.1% 71.0% 74.6% 72.5% -2.1% 8.8% Imports $147,225,505 $178,168,631 $277,567,344 $398,525,422 $321,635,945 $248,467,930 $170,738,241 -$77,729,689 -31.3% $23,512,736 16.0% % of Total Imports to Canada 68.5% 70.4% 74.3% 80.4% 75.7% 75.7% 68.0% -7.7% -0.5% Total Truck Trade Thru GPITC $193,208,149 $229,817,949 $349,324,855 $477,937,035 $400,372,947 $330,999,665 $245,774,831 -$85,224,834 -25.7% $52,566,682 27.2% % Total Trade with Canada 67.3% 70.9% 72.0% 79.0% 74.7% 75.4% 69.3% -6.1% 2.0% Rail Exports $3,374,609 $4,489,958 $5,599,094 $12,667,774 $65,868,837 $25,880,004 $52,761,140 $26,881,136 103.9% $49,386,531 1463.5% % of Total Exports to Canada 4.7% 6.3% 5.0% 11.7% 59.4% 23.4% 51.0% 27.6% 46.3% Imports $35,281,327 $45,625,221 $75,475,283 $55,201,618 $46,437,677 $31,072,231 $40,962,322 $9,890,091 31.8% $5,680,995 16.1% % of Total Imports to Canada 16.4% 18.0% 20.2% 11.1% 10.9% 9.5% 16.3% 6.8% -0.1% Total Rail Trade Thru GPITC $38,655,936 $50,115,179 $81,074,377 $67,869,392 $112,306,514 $56,952,235 $93,723,462 $36,771,227 64.6% $55,067,526 142.5% % Total Trade with Canada 13.5% 15.5% 16.7% 11.2% 21.0% 13.0% 26.4% 13.5% 13.0% TOTAL Exports $49,357,253 $56,139,276 $77,356,605 $92,079,387 $144,605,839 $108,411,739 $127,797,730 $19,385,991 17.9% $78,440,477 158.9% % of Total Exports to Canada 44.6% 47.2% 46.8% 50.6% 50.9% 50.8% 54.2% 3.4% 9.6% Imports $182,506,832 $223,793,852 $353,042,627 $453,727,040 $368,073,622 $279,540,161 $211,700,563 -$67,839,598 -24.3% $29,193,731 16.0% % of Total Imports to Canada 67.0% 63.3% 65.1% 76.4% 66.8% 70.4% 57.8% -12.6% -9.2% Total Trade Thru GPITC $231,864,085 $279,933,128 $430,399,232 $545,806,427 $512,679,461 $387,951,900 $339,498,293 -$48,453,607 -12.5% $107,634,208 46.4% % Total Trade with Canada 60.6% 59.2% 60.8% 70.3% 61.4% 63.5% 56.4% -7.1% -4.2%
  • 9. Wyoming Trade Relationships -- 2004 - 2010 Mexico Domestic Canada 2010 Leading Exports from Wyoming to Canada (Surface 2010 2010 Leading Exports from Wyoming to Canada (Surface 2010 Transportation) Transportation) Rank Export Rank Alberta Export 1 27 Mineral Fuels; Oils and Waxes $62,578,616 1 27 Mineral Fuels; Oils and Waxes $61,572,625 2 84 Computer-Related Machinery and Parts $45,127,599 2 84 Computer-Related Machinery and Parts $39,108,160 3 28 Inorganic Chemicals $37,550,247 3 68 Stone; Plaster; Cement and Asbestos $10,009,134 4 25 Salt; Sulfur; Plaster and Cement $23,664,082 4 73 Articles of Iron and Steel $7,019,220 5 29 Organic Chemicals $12,979,058 5 25 Salt; Sulfur; Plaster and Cement $4,856,694 6 68 Stone; Plaster; Cement and Asbestos $12,630,791 6 87 Vehicles Other than Railway $4,635,941 7 73 Articles of Iron and Steel $7,403,717 7 29 Organic Chemicals $2,776,879 8 87 Vehicles Other than Railway $6,245,516 8 28 Inorganic Chemicals $2,761,666 9 22 Beverages; Spirits and Vinegar $4,343,636 9 90 Measuring and Testing Instruments $2,583,350 10 31 Fertilizers $3,879,351 10 31 Fertilizers $2,180,004 2010 Leading Imports to Wyoming from Canada (Surface 2010 Rank Import 2010 Leading Exports from Wyoming to Canada (Surface 2010 1 27 Mineral Fuels; Oils and Waxes $1,080,200,788 Rank British Colombia Export 2 84 Computer-Related Machinery and Parts $103,561,164 1 28 Inorganic Chemicals $4,331,941 3 73 Articles of Iron and Steel $44,805,397 2 29 Organic Chemicals $3,431,230 4 98 Special Classification Provisions $38,277,965 3 84 Computer-Related Machinery and Parts $2,611,841 5 31 Fertilizers $34,446,856 4 40 Rubber and Articles $506,218 6 28 Inorganic Chemicals $27,841,126 5 25 Salt; Sulfur; Plaster and Cement $433,804 7 85 Electrical Machinery; Equipment and Parts $17,207,477 6 85 Electrical Machinery; Equipment and Parts $343,489 8 39 Plastics and Articles $13,752,070 7 39 Plastics and Articles $248,919 9 94 Furniture; Lamps and Prefabricated Buildings $11,787,134 8 23 Food Residues and Waste $240,788 10 90 Measuring and Testing Instruments $10,224,603 9 13 Lac; Gums; Resins and Saps $231,452 10 68 Stone; Plaster; Cement and Asbestos $209,239 2010 Leading Exports from Wyoming to Canada (Surface 2010 Rank Saskatchewan Export 1 28 Inorganic Chemicals $1,627,344 2 84 Computer-Related Machinery and Parts $1,609,721 3 31 Fertilizers $1,531,270 4 87 Vehicles Other than Railway $329,670 5 40 Rubber and Articles $260,205 6 25 Salt; Sulfur; Plaster and Cement $147,544 7 82 Tools of Base Metal $113,268 8 27 Mineral Fuels; Oils and Waxes $110,121 9 68 Stone; Plaster; Cement and Asbestos $81,613 10 34 Soap and Organic Surface-Active Agents $67,531