Calculate 2-Year Bond Rate Using Expectations Theory
•
0 gostou•6 visualizações
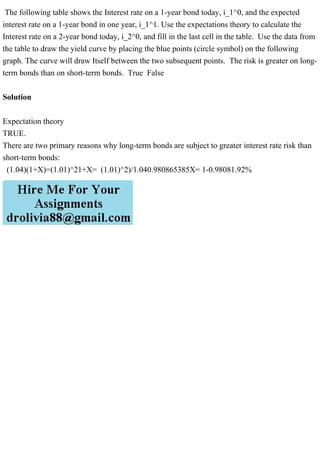
The document shows a table with the current 1-year interest rate (i_1^0) of 1.04 and the expected 1-year rate next year (i_1^1) of 1.01. Using expectations theory, the interest rate on a 2-year bond today (i_2^0) can be calculated as 1.0192 by setting the expected future value of a 2-year bond equal to its present value and solving for i_2^0. The risk is greater on long-term bonds than short-term bonds is stated as true.
Denunciar
Compartilhar
Denunciar
Compartilhar
Baixar para ler offline

Recomendados
Recomendados
APM Welcome, APM North West Network Conference, Synergies Across Sectors

APM Welcome, APM North West Network Conference, Synergies Across SectorsAssociation for Project Management
Mais conteúdo relacionado
Último
APM Welcome, APM North West Network Conference, Synergies Across Sectors

APM Welcome, APM North West Network Conference, Synergies Across SectorsAssociation for Project Management
Último (20)
Measures of Central Tendency: Mean, Median and Mode

Measures of Central Tendency: Mean, Median and Mode
Measures of Dispersion and Variability: Range, QD, AD and SD

Measures of Dispersion and Variability: Range, QD, AD and SD
Interactive Powerpoint_How to Master effective communication

Interactive Powerpoint_How to Master effective communication
social pharmacy d-pharm 1st year by Pragati K. Mahajan

social pharmacy d-pharm 1st year by Pragati K. Mahajan
Presentation by Andreas Schleicher Tackling the School Absenteeism Crisis 30 ...

Presentation by Andreas Schleicher Tackling the School Absenteeism Crisis 30 ...
APM Welcome, APM North West Network Conference, Synergies Across Sectors

APM Welcome, APM North West Network Conference, Synergies Across Sectors
Beyond the EU: DORA and NIS 2 Directive's Global Impact

Beyond the EU: DORA and NIS 2 Directive's Global Impact
Russian Escort Service in Delhi 11k Hotel Foreigner Russian Call Girls in Delhi

Russian Escort Service in Delhi 11k Hotel Foreigner Russian Call Girls in Delhi
IGNOU MSCCFT and PGDCFT Exam Question Pattern: MCFT003 Counselling and Family...

IGNOU MSCCFT and PGDCFT Exam Question Pattern: MCFT003 Counselling and Family...
A Critique of the Proposed National Education Policy Reform

A Critique of the Proposed National Education Policy Reform
Destaque
Destaque (20)
Product Design Trends in 2024 | Teenage Engineerings

Product Design Trends in 2024 | Teenage Engineerings
How Race, Age and Gender Shape Attitudes Towards Mental Health

How Race, Age and Gender Shape Attitudes Towards Mental Health
AI Trends in Creative Operations 2024 by Artwork Flow.pdf

AI Trends in Creative Operations 2024 by Artwork Flow.pdf
Content Methodology: A Best Practices Report (Webinar)

Content Methodology: A Best Practices Report (Webinar)
How to Prepare For a Successful Job Search for 2024

How to Prepare For a Successful Job Search for 2024
Social Media Marketing Trends 2024 // The Global Indie Insights

Social Media Marketing Trends 2024 // The Global Indie Insights
Trends In Paid Search: Navigating The Digital Landscape In 2024

Trends In Paid Search: Navigating The Digital Landscape In 2024
5 Public speaking tips from TED - Visualized summary

5 Public speaking tips from TED - Visualized summary
Google's Just Not That Into You: Understanding Core Updates & Search Intent

Google's Just Not That Into You: Understanding Core Updates & Search Intent
The six step guide to practical project management

The six step guide to practical project management
Beginners Guide to TikTok for Search - Rachel Pearson - We are Tilt __ Bright...

Beginners Guide to TikTok for Search - Rachel Pearson - We are Tilt __ Bright...
Calculate 2-Year Bond Rate Using Expectations Theory
- 1. The following table shows the Interest rate on a 1-year bond today, i_1^0, and the expected interest rate on a 1-year bond in one year, i_1^1. Use the expectations theory to calculate the Interest rate on a 2-year bond today, i_2^0, and fill in the last cell in the table. Use the data from the table to draw the yield curve by placing the blue points (circle symbol) on the following graph. The curve will draw Itself between the two subsequent points. The risk is greater on long- term bonds than on short-term bonds. True False Solution Expectation theory TRUE. There are two primary reasons why long-term bonds are subject to greater interest rate risk than short-term bonds: (1.04)(1+X)=(1.01)^21+X= (1.01)^2)/1.040.980865385X= 1-0.98081.92%