

Recomendados
Mais conteúdo relacionado
Mais procurados
Mais procurados (20)
Destaque
Semelhante a Dmaic phases & tools
Semelhante a Dmaic phases & tools (20)
Dmaic phases & tools
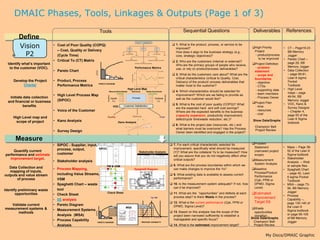
- 1. DMAIC Phases, Tools, Linkages & Outputs (Page 1 of 3) Tools Sequential Questions Deliverables References Define Vision Critical To Satisfaction • Cost of Poor Quality (COPQ) 1. What is the product, process, or service to be improved? High Priority • CT – Page19-23 – Cost, Quality or Delivery Quality Delivery Cost CTQ CTD CTC P2 CTQ CTC How does it align to the business strategy (e.g., Project BB Memory (Cycle Time) CTQ Product Quality CTQ CTC Low Total Cost CTC core, strategic objectives)? - product/process Jogger • Critical To (CT) Matrix CTD CTD to be improved • Pareto Chart – 2. Who are the customers (internal or external)? Order Service/Information Shipment accuracy and condition Identify what’s important page 29, BB CTD Fill Rate/On time delivery scheduling Who are the primary groups of people who receive, Project Definition to the customer (VOC). Performance Metrics - problem Memory Jogger A use, or rely on product/process deliverables? • Data Collection • Pareto Chart statement COPQ UCL=22.39 3. What do the customers care about? What are the – page 69-81, 20 B - scope and Individual Value C D E Mean=12.82 critical characteristics (critical to Quality, Cost, boundaries Lean 6 sigma Develop the Project • Product, Process 10 Delivery) of the product/ process deliverables that - objective Pocket PARETO DIAGRAM Charter Performance Metrics 0 LCL=3.244 matter most to the customer? - CTSs Toolbook High Level Map 0 5 10 - supporting data • High Level Where your Work Originates What You Do Results of your Process 4. Which characteristics should be selected for maps – page • High Level Process Map Upstream Downstream improvement? Which are we failing to provide as - team members Customers Suppliers Initiate data collection Process - Process Owner 49-54, BB Inputs Outputs well as the customer would like? and financial or business (SIPOC) X’s Y’s Memory Jogger Project Plan • VOC, Kano & 5. What is the cost of poor quality (COPQ)? What benefits VOC Customer Satisfaction - time Survey Designs are the expected hard and soft cost savings? • Voice of the Customer Where are the expected benefits to the business - resources – Chapter 4, - cost page 55 of the Delivery (capacity expansion, productivity improvement, High Level map and Quality Cost defect/cycle time/waste reduction, etc.)? Lean 6 Sigma • Kano Analysis Show Data/Graphs Delighters scope of project Value Kano Analysis toolbook 6. What is the project plan (resources, etc.) and Linear Performance Champion/ Belt what barriers must be overcome? Has the Process • Survey Design Satisfier – Non-smoking room available Owner been identified and engaged in the project? Project Review Satisfiers Measure 7. For each critical characteristic selected for Problem • SIPOC - Supplier, input, SIPOC improvement, specifically what should be measured Statement • Maps – Page 38- Quantify current process, output, (narrowed project 52 of the Lean 6 customer Stakeholder Analysis (Y)? What are the collateral Ys to be measured? How performance and estimate will you assure that you do not negatively affect other scope) Sigma toolbook improvement target. • Stakeholder • Stakeholder analysis critical outputs? Measurement Analysis – Web 8. What are the process boundaries within which we System Analysis PM & VSM or sample files Data Collection and • Process Mapping, Baseline Spaghetti Diagram can make changes to improve the Ys? • Spaghetti Chart Front Desk T:6 T:16 Q Existing Customer Front Desk Mins New Mins Customer Arrival Service Customer? Existing 70% Processing Custom er Service X - Inputs X - Inputs mapping of inputs, C: Day of the w eek C: CSR - Greeter C: Time of the day New 30% C: Customer C: Customer Mix C: Credit Bureau Report S: Work Order Accuracy including Value Streams, New Customer Processing T:21 Mins Need Assistance? Self 30% 9. What existing data is available to assess current Process/Product – page 42, Lean outputs and value stream Custom er Processing X - Inputs C: Credit Bureau Report C: CSR - New Customer C: Work Type Assisted 70% Performance C: Customer 6 sigma Pocket C: Contact Info S: Work Order Accuracy of process VSM Production Assisted Service T:90 Mins Self Service T:18 Mins performance? (Cpk, PPM or X - Inputs X - Inputs C: Operator/Shift - Production C: Counter Operational Toolbook C: Equipment C: Equipment C: Materials C: Materials C: Work Type C: Work Type S: Equipment Maintenance S: Equipment Maintenance Scrap • Spaghetti Chart – waste 10. Is the measurement system adequate? If not, how T:25 Quality DPMO, Sigma • MSA – page 73- Mins Assurance Quality Service Assurance X - Inputs C: QC person C: Work Order C: Sample C: Production Pull Unhappy Customers Unhappy Customer Exit Payment Service T:17 Mins High Priority? Yes High Priority can it be improved? Level) 94, BB Memory tool Custom er Customer Exit Identify preliminary waste X - Inputs C: Customer C: Work Order Accuracy No Scrap Low C: Customer discount Priority Custmoer Jogger opportunities • Check Sheet Check Sheet 11. What are the “opportunities” and defects at each Estimated process step? Is there Waste in the process? • Process Cp, Cpk Improvement • 5S analysis Capability –, 12. What is the current performance (Cpk, PPM or Target SS page 135-140 of Validate current • Pareto Diagram Week DPMO, Sigma Level)? MSA2 the Lean 6 measurement systems & • Measurement Systems A Defect Incorrect SSN G a ge R & R (A N O V A ) fo r R e s po ns e 1 G age nam e: D ate of s tudy : R eported by : 3 4 Totals Waste Sigma toolbook Toleranc e: M is c : 13. Based on this analysis has the scope of the C o m p o n e n ts o f Va ria tio n B y P a rt COPQ Incorrect Address opportunities 1 .1 methods 200 % C o n trib u tio n 1 .0 % S tu d y Va r 0 .9 P erc ent % To le ra n ce 0 .8 100 0 .7 0 .6 Incorrect Work History 0 .5 or page 95-100 0 0 .4 Analysis (MSA) Gage R &R Repeat R e p ro d P a rt-to -P a rt P art 1 2 3 4 5 6 7 8 9 10 R C h a rt b y O p e ra to r B y O p e ra to r project been narrowed sufficiently to establish a 0 .1 5 1 2 3 1 .1 Incorrect Safety History identified U C L = 0 .1 2 5 2 1 .0 S am ple R ange B 0 .1 0 0 .9 0 .8 0 .7 0 .0 5 C D E R = 0 .0 3 8 3 3 0 .6 0 .5 0 .0 0 L C L =0 0 .4 Show Data/Graphs of BB Memory 0 O perator 1 2 3 Xb a r C h a rt b y O p e ra to r O p e ra to r*P a rt In te ra c tio n O perator - 4.5 - 3.5 - 2.5 - 1.5 0 1.5 2.5 3.5 4.5 • Process Capability 1 .1 1 2 3 1 .1 manageable and specific focus? 1 .0 1 1 .0 S am ple Mean 0 .9 2 U C L = 0 .8 7 9 6 0 .9 Average 0 .8 Me a n = 0 .8 0 7 5 3 L C L = 0 .7 3 5 4 0 .8 0 .7 0 .7 0 .6 0 .6 0 .5 0 .4 0 .5 0 .3 0 .4 Champion/ Belt Jogger 0 P art 1 2 3 4 5 6 7 8 9 10 PARETO DIAGRAM PROCESS CAPABILITY Analysis 14. What is the estimated improvement target? Project Review My Docs/DMAIC Graphic