SlideShare uma empresa Scribd logo
1 de 9
Baixar para ler offline
International Journal of Obesity (2000) 24, 906±914
     ß 2000 Macmillan Publishers Ltd All rights reserved 0307±0565/00 $15.00
                                                              www.nature.com/ijo

Appetite after weight loss by energy restriction
and a low-fat diet±exercise follow-up

                                           Â             Á
E Doucet1, P Imbeault1, S St-Pierre1, N Almeras1, P Mauriege1, D Richard1 and A Tremblay1*
1
                                                                                                        Â
    Division of Kinesiology, Department of Social and Preventive Medicine, Laval University, Ste-Foy, Quebec, Canada G1K 7P4


OBJECTIVE: The aim of the present study was to determine the impact of weight loss on appetite as measured by
visual analog scale (VAS).
METHODS: Seventeen subjects (10 men and seven women) took part in a 15 week weight loss program which
consisted of drug therapy (fen¯uramine 60 mgaday) or placebo coupled to an energy restriction (À2930 kJaday; phase
1) followed by an 18 week low-fat diet ± exercise follow-up (phase 2). Subjects were given a standardized breakfast
before and after phase 1 as well as after phase 2. Individuals were asked to ®ll out VAS before and at 0, 10, 20, 30, 40,
50 and 60 min after this test meal. Blood samples were drawn before the meal and at 0, 30 and 60 min postprandially
and analyzed for glucose and insulin. Fasting plasma cortisol and leptin were also determined.
RESULTS: An increase in the fasting desire to eat, hunger and prospective food consumption (PFC) was observed after
phase 1 and to an even greater extent after phase 2 in both men and women. In the fasting state, positive correlations
were observed between changes in the desire to eat (r ˆ 0.76; P ` 0.05) as well as changes of PFC (r ˆ 0.82; P ` 0.05)
and changes in cortisol at the end of phase 1 for women. In response to phase 1, statistically signi®cant correlations
were found between changes of hunger (r ˆ 0.64; P ` 0.05) and desire to eat (r ˆ 0.67; P ` 0.05) as measured by AUC in
response to the meal and changes of fasting plasma cortisol in men. The most consistent predictor of changes of
baseline desire to eat (r ˆ 0.68 P ` 0.05), fullness (r ˆ À0.78, P ` 0.05) and PFC (r ˆ 0.91, P ` 0.01) during phase 2 was
the change in fasting cortisol in men. Changes of fullness were also associated with changes of fasting leptin in men
(r ˆ 0.68; P ` 0.05) during phase 2.
CONCLUSION: These results suggest that weight loss is accompanied by an increase of baseline appetite in both men
and women and that the most consistent predictor of these changes in appetite seems to be changes in fasting
plasma cortisol.
International Journal of Obesity (2000) 24, 906±914

Keywords: weight loss; appetite; cortisol; visual analog scale


Introduction                                                                       etiology of obesity, and nutritional strategies are
                                                                                   now consequently being developed by health profes-
                                                                                   sionals to promote satiety with a minimal energy
Obesity prevalence has increased considerably                                      intake.
throughout the latter half of this century. This increase                             Another important dimension of this problem that
in obesity was paralleled to important changes in food                             has been scarcely documented up to now is the
consumption patterns.1 In a context where virtually                                question as to whether appetite is altered by weight
unlimited access to high-fat foods is made possible,                               loss. This hypothesis came from the fact that weight
the maintenance of energy balance seems to be                                      loss is characterized by numerous metabolic andaor
dif®cult to achieve for many individuals. This might                               endocrine adaptations that might in turn affect appe-
be due to the fact that this type of dietary regimen has                           tite in the reduced-obese state. Indeed, weight loss has
a weak potential to produce potent satiety signals and                             been shown to reduce sympathetic nervous system
to inhibit subsequent energy intake.2,3 This situation                             activity,4 plasma leptin5 and insulin,6 all of which have
often leads to passive overconsumption and thus to                                 been shown to inhibit food and energy intake.7 ± 10
positive energy and fat balance, and over time to                                  Moreover, weight loss has also been shown to
excess body fat storage. In this context, it can be                                improve glycemic control,11 which is partly re¯ected
speculated that the potential of this type of dietary                              by a decrease in fasting glucose. This might be
regimen to suppress appetite-related feelings may not                              problematic in a context where a decrease in glycemia
be as effective as that which characterized the lifestyle                          has been shown to trigger episodes of feeding.12,13 It is
of our ancestors. Thus, subjective feelings of hunger                              thus possible that, in order to achieve a comparable
and satiety might play an important role in the                                    level of satiety to what was experienced while still
                                                                                   obese, a more substantial amount of energy has to be
                                                                                   consumed to compensate for the reduced impact of the
*Correspondence: A Tremblay, Division of Kinesiology, PEPS,                        above-mentioned factors on appetite-related variables.
Laval University, Ste-Foy, Quebec, Canada G1K 7P4.
                             Â                                                     This phenomenon might in turn partly explain the fact
E-mail: angelo.tremblay@kin.msp.ulaval.ca
Received 23 July 1999; revised 17 December 1999; accepted                          that most reduced-obese individuals regain the weight
23 February 2000                                                                   lost within a relatively short period of time if no
Weight loss and appetite
                                                           E Doucet et al
                                                                                                                                 907
intervention is undertaken to prevent this unfortunate     valvular function,20,21 all subjects (including placebos)
outcome.14                                                 were subjected to an echocardiogram. Following this
   Few studies have directly addressed the issue as to     assessment, a detailed analysis of cardiac valvular
whether appetite scores are affected by prolonged          function was performed by cardiologists, who
energy de®cit and consequent weight loss. In this          detected no abnormalities in response to the use of
context, Heini et al 15 have observed that during          fen¯uramine under these conditions.22
controlled weight loss, although no signi®cant
changes in hunger±satiety levels were found, some
positive correlations were observed between postpran-      Weight loss program
dial changes in these variables and fractional changes     This program was designed as a two-phase program as
in glucose and insulin. Results from the same group        previously described.19 Phase 1 consisted of a 15-
have also demonstrated that during energy restriction,     week non-macronutrient speci®c energy restriction of
changes in leptin are accompanied by changes in            2930 kJaday (À700 kcaladay) coupled to drug therapy
hunger±satiety ratings16 which might be partly             (fen¯uramine 60 mgaday) or placebo. Following
explained by the fact that leptin levels were shown        phase 1, a low fat diet from which 30% of total
to predict palatability scores.17 It has also been         energy intake (EI; 8445 Æ 158 and 7590 Æ 273 kJ for
reported that, in response to weight loss induced by       men and women, respectively) came from fat, 53%
energy restriction and physical activity, changes in       from carbohydrates and 17% from proteins, as well as
day-long visual analog scale (VAS) measurements            an aerobic exercise prescription (60±75% of VO2
were associated with changes in leptin and glucose.18      max; 3±5 times a week; 45±60 minasession) were
   We thus hypothesized that the reduced-obese state       prescribed to subjects for a mean duration of 18 weeks
would be characterized by an increase of VAS vari-         (phase 2). To ensure proper monitoring of exercise
ables measured in the fasting state and that a given       intensity and duration and to verify the subjects'
amount of calories would exert a lesser in¯uence over      compliance to the exercise prescription, they had to
the subjective feelings of hunger and satiety due to       wear a heart rate monitor (Polar Vantage XLTM HRM,
some hormonal adaptations to weight loss. In this          Stamford, CT) during their exercise sessions to assess
study, we measured the impact of a standardized            mean heart rate and duration of the training sessions.
breakfast test meal on the subjective feelings of             Noteworthy is the fact that phase 2 was continued
appetite as measured by VAS as well as their relation      until a resistance to further lose fat was achieved in
to changes in fasting plasma glucose, insulin, leptin      subjects. That is, a threshold beyond which a further
and cortisol in the obese state, after a 15-week drug      reduction andaor manipulation of energy intake
therapy intervention in the reduced-obese state, and       andaor an increase in energy expenditure derived
after an additional 18-week low-fat diet±exercise          from physical activities would have caused subjects
follow-up.                                                 to feel unable to comply with the prescription over
                                                           time. This was done to ensure long term maintenance
                                                           of the healthier lifestyle which resulted from this
                                                           intervention program. Since this approach was indivi-
Methods                                                    dualized, some subjects reached this resistance to
                                                           further lose fat before others and thus the duration
                                                           of this follow-up period was different amongst indi-
Seventeen obese subjects (10 men and seven women)          viduals (from 8 to 24 weeks).
underwent weight loss by drug therapy (60 mgaday of
fen¯uramine) or placebo treatment coupled to a non-
macronutrient speci®c energy restriction for a 15-         Standardized breakfast test meal
week period (phase 1). Since this study was double-        Subjects were asked to come to the laboratory after a
blind, subjects were given a number in the order in        12 h overnight fast. They were then asked to eat a
which they were recruited for the study. Drug or           standardized breakfast meal test which consisted of
placebo had already been randomly assigned to              whole wheat bread, butter, peanut butter, strawberry
these numbers while respecting the ratio of 5 to 1         jam, mozzarella cheese and orange juice. The meal
drug- or placebo-treated individual, respectively.         was designed to have a food quotient of 0.85 and an
Phase 1 was followed by an $18-week low-fat                energy content of 2993 kJ (715 kcal) and 2574 kJ
diet±exercise follow-up (phase 2). A detailed descrip-     (615 kcal) for men and women, respectively (see
tion of this two-phase weight loss program is given        Appendix A). To increase the energy content of the
below and has been previously described.19 Subjects        test meal in men without changing the food quotient, a
gave their written consent to participate in this study,   glass of 2% milk fat milk was added to this breakfast
which received approval from the Laval University          test meal. Subjects were instructed to eat everything
Medical Ethics Committee.                                  within a 20 min period. This test meal measurement
   It is important to note that following the suspension   was performed at three different times during the
of fen¯uramine and dexfen¯uramine further to a             protocol, before phase 1 as well as after phases 1
potential association with disturbances in cardiac         and 2.
                                                                                                     International Journal of Obesity
Weight loss and appetite
                                                            E Doucet et al
908
          Visual analog scale measurements (VAS)                             Glucose and insulin concentrations
          Desire to eat, hunger, fullness and prospective food               Blood samples were collected in tubes containing
          consumption (PFC) were rated immediately before                    EDTA and Trasylol (Miles Pharmaceutics, Rexdale,
          (after a 12 h overnight fast) and at 0, 10, 20, 30, 40,            Ontario, Canada) in the fasting state at 0, 30 and
          50 and 60 min after the standardized test meal on a                60 min after the meal. Plasma glucose was measured
          150 mm VAS which was adapted from Hill and                         enzymatically,25 whereas plasma insulin concentra-
          Blundell.23 Questions were asked as follows: (1)                   tion was determined by radioimmunoassay with poly-
          `How strong is your desire to eat?' (very weak±very                ethylene glycol separation.26
          strong); (2) `How hungry do you feel?' (not hungry at
          all±as hungry as I have ever felt); (3) `How full do
          you feel?' (not full at all±very full); and (4) `How               Plasma leptin and cortisol concentrations
          much food do you think you could eat?' (nothing at                 Fasting plasma leptin concentrations were determined
          all±a large amount). The before breakfast measure-                 with a highly sensitive commercial double-antibody
          ment was considered as the fasting measurement for                 RIA (Human Leptin Speci®c RIA Kit, LINCO
          all four variables. In order to calculate values of AUC            Research, St Louis, MO, USA), which detects rela-
          in response to the meal for the above variables,                   tively low leptin levels of 0.5 ngaml and which does
          measurements at 0, 10, 20, 30, 40, 50 and 60 min                   not crossreact with human insulin, proinsulin, gluca-
          were considered in this calculation by using the                   gon, pancreatic polypeptide or somatostatin. Our
          trapezoid method, thus not including the fasting                   coef®cients of variation for the repeated assays
          score obtained before breakfast. Hence, higher                     ranged from 4.0 to 5.5% for the lower leptin concen-
          values for AUC in response to the meal are indicative              trations and from 6.5 to 8.5% for higher plasma leptin
          of a lesser suppression of the test meal for the desire to         concentrations.27 Plasma cortisol concentrations were
          eat, hunger and PFC and at the opposite greater values             determined by radioimmunoassay (ICN Biomedicals
          of AUC in response to the meal for fullness indicate a             Inc., Costa Mesa, CA) from fasting plasma samples.
          greater impact of the meal over this variable. Note-
          worthy is the fact that the measurements of VAS were
          performed at least 2±4 weeks after the interruption of             Statistical analysis
          drug therapy after phase 1 and at least 48 h after the             Jump Sofware 3.1.6.2. from the SAS Institute Inc.
          last bout of exercise following phase 2, when they had             (Cary, NC, USA) was used for all analysis. Multi-
          become resistant to further losses of body fat. At all             variate analysis of variance (MANOVA) for repeated
          sampling times subjects had been weight stable. In                 measures were ®rst performed on all variables to
          this sense, we can consider that subjects were in                  assess the effects of gender, treatment, time and
          energy balance even if weight stability is a gross                 their interaction. Since gender effects as well as
          index of energy balance. Moreover, before every                    genderÂtime interactions were observed, genders
          visit to the laboratory subjects were instructed to eat            were analysed separately. Moreover, since no treat-
          as they would normally. Women were also tested                     mentÂtime interactions were noted, placebos and
          between days 5 and 12 of their menstrual cycle at                  drug treated individuals were pooled together for
          all three testing periods. Also of importance is the fact          further analysis. To verify the effect of treatment on
          that VAS measurements were always performed in the                 VAS variables, paired t-tests were performed with a
          same environment, ie at the same table with the same               Bonnferroni correction. For these analyses, since two
          lighting in the same room, which was kept free of                  comparisons were performed, the alpha level was set
          odors and sounds as well as other factors that might               at 0.025. Pearson correlations were also performed
          contaminate this measurement (visual stimuli, indivi-              between the changes of VAS variables (fasting and
          duals in the room, etc). Under these conditions, VAS               AUC in response to the test meal) as well as hormonal
          measurements in our laboratory have been shown to                  changes. The alpha level for Pearson correlations was
          be highly reliable both before and in response to a                set at P ` 0.05. All data are expressed as mean
          meal.24                                                            Æ s.e.m.


          Blood sampling and analysis
          It is important to note that all blood samples were                Results
          drawn after an overnight fast of at least 12 h through a
          venous catheter from an antecubital vein at around
          08:00 at all three sampling times. Moreover, subjects              As shown in Table 1, phase 1 caused a signi®cant
          were instructed to abstain from physical exercise 48 h             decrease in body weight (À11.6 and À7.3 kg), body
          before blood sampling. Subjects were also instructed               mass index (À3.8 andÀ2.9 kgam2) and fat mass (À9.9
          to eat as they would normally before visits to the                 and À5.6 kg) in men and women respectively,
          laboratory and women were tested between days 5 and                whereas phase 2 caused a signi®cant decrease in fat
          12 of their menstrual cycle before and after phase 1 as            mass in men only (À4.1 kg). Fat-free mass was also
          well as after phase 2.                                             slightly reduced in response to phase 1 in both men
International Journal of Obesity
Weight loss and appetite
                                                                      E Doucet et al
                                                                                                                                                      909
         Table 1     Subjects' characteristics before and after treatment

                                        Before phase1                   After phase1                      After phase 2

         Variables                   Men           Women            Men              Women          Men              Women

         Age (y)                   45.0 Æ 1.1     40.1 Æ 1.8         Ð                 Ð             Ð                  Ð
         Body weight (kg)         102.2 Æ 3.3     86.7 Æ 2.3     90.6 Æ 2.4a       79.4 Æ 3.2a   88.2 Æ 1.8a       77.6 Æ 3.3a
         BMI (kgam2)               33.6 Æ 0.7     34.3 Æ 0.8     29.8 Æ 0.6a       31.4 Æ 1.2a   29.1 Æ 0.4a       30.1 Æ 1.3a
         Fat mass (kg)             37.5 Æ 2.1     41.6 Æ 2.4     27.6 Æ 1.5a       36.0 Æ 2.4a   23.5 Æ 1.1b       33.4 Æ 3.1a
         Fat-free mass (kg)        64.8 Æ 2.0     45.1 Æ 1.7     63.1 Æ 2.0        43.3 Æ 1.3    64.7 Æ 1.9        44.3 Æ 2.0

         Mean Æ standard error of the mean; n ˆ 10 and n ˆ 7 for men and women, respectively; BMI ˆ body mass index;
         means which do not share the same letter are signi®cantly different from one another.


and women and, as expected, a slight non-signi®cant                   hunger were signi®cantly greater than before phase 1
increase of this variable was noted after phase 2.                    values, while PFC was only signi®cantly different
                                                                      from before phase 1 values in women. The measure-
Changes of fasting VAS scores in response to phases 1                 ment of fasting fullness remained statistically
and 2                                                                 unchanged in response to this whole program, be it
Figure 1 presents results from the comparison of the                  after phase 1 or 2 in both sexes.M
effects of weight loss on VAS variables measured in
the fasting state in the 17 subjects who completed both               Changes of post-prandial VAS scores in response to
phases 1 and 2. As a result of this program, the fasting              phases 1 and 2
desire to eat, hunger and PFC were all increased in                   Values of AUC in response to the test meal for VAS
response to phase 1, although not signi®cantly. More-                 variables are shown in Table 2. No signi®cant differ-
over, at the end of phase 2 fasting desire to eat and                 ence was observed for both men and women be it after


Figure 1 Effects of weight loss on VAS variables measured in the fasting state before and after 15 weeks of drug therapy (phase 1) as
well as after an 18 week low-fat diet ± exercise follow-up (phase 2). *,**signi®cantly different from before phase 1 measurement at 0.03
and 0.01, respectively. PFC ˆ prospective food consumption and n ˆ 10 men and 7 women.

                                                                                                                          International Journal of Obesity
Weight loss and appetite
                                                                 E Doucet et al
910
          phases 1 or 2, indicating that a meal of a given caloric                   only variable that came close to statistical signi®cance
          content seems to in¯uence variables of VAS in a                            was fullness (r ˆ 0.71, P ˆ 0.07).
          similar fashion before and after weight loss.                                 Simple correlations were also performed on
                                                                                     changes of VAS variables calculated as AUC in
                                                                                     response to the test meal which occurred during
          Correlates of changes of VAS scores in the fasting and                     phase 2 of VAS and changes of fasting insulin,
          postprandial states during phase 1                                         glucose, leptin and cortisol as well as AUC for
          Simple correlations between changes in VAS vari-                           glucose and insulin measured during the test meal.
          ables measured in the fasting state and changes in                         These analyses failed to reveal any signi®cant asso-
          fasting insulin, glucose, leptin and cortisol which                        ciation (results not shown).
          occurred during phase 1 were performed for both                               Figure 2 presents the regression lines for changes in
          men and women. These analyses did not reveal any                           desire to eat and PFC in the fasting state plotted
          signi®cant association, except for changes in cortisol                     against changes in fasting cortisol, insulin and
          which were signi®cantly associated to changes in                           leptin. As expected, even when pooling men and
          desire to eat (r ˆ 0.76, P ` 0.05) and to changes                          women together, the association was still statistically
          in PFC (r ˆ 0.82, P ` 0.05) in the fasting state for                       signi®cant between fasting values of desire to eat
          women. As for changes in the variables of VAS                              (r ˆ 0.58, P ` 0.01) and PFC (r ˆ 0.67, P ` 0.01)
          calculated as AUC in response to the test meal,                            and fasting cortisol. On the other hand, no signi®cant
          signi®cant associations were found between changes                         associations were found between these two markers of
          in fasting cortisol and changes in AUC desire to eat                       appetite and fasting insulin and leptin.
          (r ˆ 0.66, P ` 0.05) and hunger (r ˆ 0.64, P ` 0.05)
          in men. On the other hand, negative associations were
          found between changes in AUC of hunger (r ˆ À0.87,
          P ` 0.05) and PFC (r ˆ À0.84, P ` 0.05) in response                        Discussion
          to the test meal and changes in fasting plasma insulin
          for women in response to phase 1 of this program.
             Correlation analyses were also performed between                        The main ®nding of this study is that, in men and
          changes in VAS variables in the fasting state and in                       women having undergone considerable weight loss
          response to a meal and changes in body weight and fat                      through energy restriction followed by a low-fat diet±
          mass. These analyses revealed a signi®cant associa-                        physical exercise intervention, an increase in appetite
          tion between changes in fat mass and changes in                            scores as measured by VAS is observed in the fasting
          fasting PFC (r ˆ 0.64, P ` 0.05) in men in response
          to phase 1.                                                                Table 3 Correlation coef®cients between fasting changes of
                                                                                     leptin, cortisol, insulin and glucose and fasting subjective
                                                                                     feelings of hunger and satiety as measured by VAS during
          Correlates of changes of VAS scores in the fasting and                     phase 2
          postprandial states during phase 2                                                                                Phase 2
          Presented in Table 3 are results from correlation
          analyses performed between changes of VAS vari-                                              Insulin     Glucose        Leptin   Cortisol
          ables in the fasting state and changes in fasting                          Men
          insulin, glucose, leptin and cortisol which occurred                       Desire to eat      0.09         0.07        À0.42      0.68*
          during phase 2. In men, changes in leptin were                             Hunger             0.11         0.02        À0.35      0.57
                                                                                     Fullness           0.26         0.02         0.68*    À0.78**
          positively and signi®cantly associated with changes                        PFCa              À0.07         0.05        À0.33      0.91**
          in fullness (r ˆ 0.68, P ` 0.05). In addition, it would                    Women
          seem that in men the change of fasting plasma cortisol                     Desire to eat      0.41       À0.66          0.59      0.60
                                                                                     Hunger             0.40       À0.63          0.54      0.55
          was the most consistent predictor of changes in desire                     Fullness          À0.43        0.71b        À0.35      0.13
          to eat (r ˆ 0.68, P ` 0.05), fullness (r ˆ À0.78,                          PFCa               0.21       À0.18          0.37      0.06
          P ` 0.01) and PFC (r ˆ 0.91, P ` 0.01). In women,                          *,**P ` 0.05 and 0.01, respectively.
          the best predictor of changes in the variables of VAS                      a
                                                                                      PFC ˆ prospective food consumption.
          would seem to be changes in glycemia, even if the                          b
                                                                                      P ˆ 0.07.


                      Table 2 Comparison of VAS measurements calculated as area under the curve in response to a test meal
                      before and after phase 1 as well as after phase 2

                                             Before phase1                        After phase1                   After phase 2

                      Variables          Men           Women                Men             Women           Men              Women

                      Desire to eat    867 Æ 315      1499 Æ 627        1330 Æ 437        1561 Æ 604    1436 Æ 530          1544 Æ 695
                      Hunger           956 Æ 334      1546 Æ 621        1379 Æ 469        1494 Æ 615    1506 Æ 535          1532 Æ 701
                      Fullness        7402 Æ 480      6665 Æ 867        6998 Æ 491        7261 Æ 713    6898 Æ 638          7210 Æ 678
                      PFCa            1122 Æ 333      2055 Æ 744        1497 Æ 439        1507 Æ 599    1529 Æ 504          1749 Æ 696

                      Mean ˆ s.e.m. PFC ˆ prospective food consumption; n ˆ 10 men and 7 women, respectively.

International Journal of Obesity
Weight loss and appetite
                                                                      E Doucet et al
                                                                                                                                                  911


Figure 2 Correlation analysis between changes in fasting desire to eat and prospective food consumption (PFC) and changes in
fasting cortisol, insulin and leptin in response to an 18-week low-fat diet ± exercise follow-up in obese men (n ˆ 10) and women (n ˆ 7)
having initially undergone 15 weeks of drug therapy.


state. However, a test meal of a given caloric content                et al,18 who have found an increase in day long VAS
seems to exert a similar in¯uence over these variables                AUC for desire to eat and hunger after 2 and 8 weeks
in the postprandial period once the reduced-obese                     of energy restriction and physical activity. Further-
state is achieved. Furthermore, the inter-subject varia-              more, our results show that these increased feelings of
bility in the the changes of VAS variables in response                appetite persist beyond 12 weeks, as demonstrated in
to this program permitted us to investigate the con-                  the latter study, since our intervention lasted approxi-
tribution of hormonal adaptations to weight loss to                   mately 33 weeks. These ®ndings are important since
these variations. In this sense, it would seem that                   appetite feelings might dictate the quantity and the
changes in appetite scores that occur during weight                   quality of the foods that will be prepared and con-
loss are partly explained by changes in fasting plasma                sumed during the day. Thus, it can easily be specu-
cortisol.                                                             lated that individuals with increased appetite before
   The most consistent ®nding of this study is the                    the initiation of a meal would rather choose readily
increase of baseline appetite across the intervention in              accessible processed foods which generally have a
both men and women. Indeed, as shown in Figure 1,                     high fat and sucrose content. Moreover, it is also
the desire to eat, hunger and PFC were all increased                  possible that the amount of food prepared would be
after phase 1 and to a further extent after phase 2.                  commensurate with the appetite scores. This is in
These results are in accordance with those of Keim                    agreement with recently reported results which have
                                                                                                                      International Journal of Obesity
Weight loss and appetite
                                                            E Doucet et al
912
          shown that after an initial weight loss induced over 2             increase to a greater extent in some individuals than in
          months by an energy restricted diet, hunger as mea-                others during weight loss, it would be expected that
          sured by the Dutch Eating Behaviour Questionnaire                  these particular individuals would lose less fat
          scores was a signi®cant predictor of weight regain                 because of the in¯uence that cortisol seems to exert
          over a 14 month period.28 Beyond these observations,               over subjective feelings of hunger and satiety and
          it would have been expected that, after drug therapy,              possibly on food intake.
          the low-fat diet±exercise follow-up would have at                     The recent discovery of the Ob gene product,
          least partly corrected for the increase in appetite                leptin,31 has brought new insights into the regulation
          scores noted after weight loss since the exercise                  of energy balance. Even if this hormone does not
          prescription was of 72% and 52% of VO2 max for                     seem to be acutely affected by food intake,5,32 it has
          men and women, respectively,19 and that high-inten-                been shown to ¯uctuate considerably with body
          sity exercise seems to reduce ad libitum energy intake             weight variations5 and prolonged energy de®cit.33
          in the postexercise period in lean healthy men.29                  Since leptin has been shown to reduce food intake
          However, the fact that an increase in appetite scores              in animals,8 it is also probable that it might affect
          was still observed during phase 2 is somewhat in                   energy balance in humans. Even if leptin levels do not
          agreement with the observation that the anorectic                  seem to be associated with hunger and desire to eat
          effect of strenuous physical exercise is not necessarily           in obese women, be it in the fasting state or after
          observed in obese individuals.30 From this, it can be              exposure to food,32 other results have demonstrated
          argued that the gender difference in exercise intensity            that, in response to prolonged energy de®cit induced
          which was observed during phase 2 of this weight                   either by caloric restriction,16 or caloric restriction and
          loss±weight maintenance program probably did not                   aerobic activity,18 changes in hunger±satiety feelings
          affect appetite responses differently between men and              were related to changes in leptin. Our results do not
          women. In this regard, it is also important to consider            show as strong a relationship between changes in
          that a delay of at least 48 h elapsed between the last             leptin and changes in VAS scores. However, our
          bout of exercise and VAS measurements, which might                 results are partly in accordance with those of Heini
          be suf®cient to lose a possible acute anorectic effect of          et al,16 who reported that leptin seems to be a satiety
          exercise.                                                          hormone since fullness was signi®cantly associated
              Another issue which needs to be discussed is the               with changes in leptin in the present study.
          fact that, despite a different weight loss, the increases             The fact that in women a negative association was
          in appetite scores as measured by VAS scale were                   observed between changes in fasting plasma insulin
          quite similar between men and women. It should                     and changes in variables of VAS measured as AUC is
          however be kept in mind that no associations were                  in accordance with the idea that insulin might affect
          observed between changes in body weight and                        appetite-related variables15 and food intake9 by mod-
          changes in appetite-related variables. In this context,            ulating the expression of neuropeptide Y.10 Results
          it is tempting to speculate that one of the reasons why            from a decade ago have also emphasized the impor-
          women generally lose less body weight than do men                  tance of changes in blood glucose in regards to eating
          during weight loss programs is because comparable                  behavior.12,13 More recent results have shed some new
          metabolic adaptations to prevent further weight loss               light on this issue since Heini et al;15 have demon-
          occur in women at a lesser amount of weight lost. This             strated that changes in glucose and insulin seem to
          ®ts well with our results since we document an                     predict changes in appetite-related variables. Even if
          increase in appetite-related variables which is related            our data do not provide statistical support to these
          to an increase in circulating plasma cortisol more                 latter results, it nevertheless appears that changes of
          particularly during phase 2. Despite a difference in               VAS variables also seem to be associated with varia-
          changes of body weight and composition, the increase               tions in fasting plasma glucose in women.
          in the main predictor of changes in appetite-related                  On the basis of our results, it would seem that the
          scores, ie cortisol levels in this case, was remarkably            most consistent predictor of changes in appetite-
          similar between men and women. Hence, we can                       related scores, be it at baseline or in response to a
          speculate that a lesser weight loss in women than in               test meal, is the change in fasting cortisolemia.
          men might trigger a similar increase in cortisol levels            Indeed, as shown in Figure 2, an increase in fasting
          which is in turn associated to similar increases in                cortisol seems to better predict an increase of fasting
          appetite-related scores more particularly when a resis-            desire to eat and PFC when compared to changes in
          tance to further loss of fat is achieved.                          insulinemia or leptinemia. To our knowledge, this is
              It is also intriguing to observe a positive relation-          the ®rst paper to report such ®ndings in humans
          ship between changes in PFC and changes in fat mass                having undergone a weight loss intervention program.
          in men in response to phase 1. However, this observa-              Convincing demonstrations of the effects of glucocor-
          tion does not necessarily contradict the main ®nding               ticoids on food intake in animals have, however, been
          of this study. Indeed, it would seem that the increases            reported.34,35 Whether or not these results can be
          in appetite scores which occurs during weight loss are             transposed to humans remains unclear, but our results
          best predicted by increases in cortisol levels and not             seem to support observations from the animal litera-
          by weight loss per se. In this context, if cortisol levels         ture. It is however unclear as to why cortisol comes
International Journal of Obesity
Weight loss and appetite
                                                                        E Doucet et al
                                                                                                                                                    913
out as such a strong predictor of changes of VAS                         8 Halaas JL, Gajiwala KS, Maffei M, Cohen SL, Chait BT,
variables. Since glucorticoids are involved in glucose                     Rabinowitz D, Lallone RL, Burley SK, Friedman JM. Weight-
                                                                           reducing effects of the plasma protein encoded by the obese
homeostasis, and that weight loss is accompanied by                        gene. Science 1995; 269: 543 ± 546.
important changes in glucose metabolism, changes in                      9 Schwartz MS, Figlewicz DP, Baskin DG, Woods SC, Porte D.
cortisol might re¯ect an attempt at re-establishing                        Insulin in the brain: a hormonal regulator of energy balance.
glucose homeostasis by increasing food intake. Note-                       Endocrinol Rev 1992; 13: 387 ± 414.
worthy is the fact that an increase in hypothalamic±                    10 Schwartz MW, Sipols AJ, Marks JL, Sanacora G, White JD,
                                                                           Scheurink A, Kahn SE, Baskin DG, Woods SC, Figlewicz DP,
pituitary±adrenal axis activity, as indicated by an                        Porte D. Inhibition of hypothalamic neuropeptide Y gene
increase in circulating plasma cortisol, might re¯ect                      expression by insulin. Endocrinology 1992; 130: 3608 ± 3616.
an increase in the level of stress. Even if the role of                 11 Wing RR, Klein R, Moss SE. Weight gain associated with
stress in the development of obesity remains to be                         improved glycemic control in population-based sample of
determined, there is some evidence to the effect that                      subjects with type I diabetes. Diabetes Care 1990; 13:
                                                                           1106 ± 1109.
stress can trigger episodes of feeding in animals36 and                 12 Camp®eld LA, Smith FJ. Functional coupling between tran-
that some animals display a considerable stress                            sient declines in blood glucose and feeding behavior: temporal
response when food deprived.37 From these observa-                         relationships. Brain Res Bull 1986; 17: 427 ± 433.
tions, it might be speculated that energy-restricted                    13 Camp®eld LA, Smith FJ. Transient declines in blood glucose
humans might respond similarly to a prolonged                              signal meal initiation. Int J Obes 1990; 14: 15 ± 31.
                                                                        14 Weinsier RL, Neslon KM, Hensrud DD, Darnell BE, Hunter
energy de®cit as do animals and, for undetermined                          GR, Schutz Y. Metabolic predictors of obesity. J Clin Invest
reasons, increase their food intake to alleviate this                      1995; 95: 980 ± 985.
stressful status.                                                       15 Heini AF, Kirk KA, Lara-Castro C, Weinsier RL. Relationship
   In summary, our results demonstrate that weight                         between hunger-satiety feelings and various metabolic param-
loss is accompanied by an increase in appetite-related                     eters in women with obesity during controlled weight loss.
                                                                           Obes Res 1998; 6: 225 ± 230.
variables in the fasting state. Moreover, based on our                  16 Heini AF, Lara-Castro C, Kirk KA, Considine RV, Caro JF,
results the most consistent predictor of these changes                     Weinsier RL. Association of leptin and hunger-satiety ratings
seems to be changes in fasting plasma cortisol. More                       in obese women. Int J Obes 1998; 22: 1084 ± 1087.
studies need to be performed to further clarify how                     17 Raynaud E, Brun JF, Perez-Martin A, Sagnes C, Boularan
cortisolemia is implicated in the control of energy                        AM, Fedou C, Mercier J. Serum leptin is associated with the
                                                                           perception of palatability during a standardized high-carbohy-
balance in the reduced obese state and to what extent                      drate breakfast test. Clin Sci (Colch) 1999; 96: 343 ± 348.
these changes are acutely affected by food intake.                      18 Keim NL, Stern JS, Havel PJ. Relation between circulating
Hence, nutritional strategies must be developed to                         leptin concentrations and appetite during a prolonged,
prevent the overfeeding which might result from                            moderate energy de®cit in women. Am J Clin Nutr 1998; 68:
these increased appetite scores, otherwise a very                          794 ± 801.
                                                                        19 Doucet E, Imbeault P, Almeras N, Tremblay A. Physical
plausible scenario is weight regain as is most often                       activity and low-fat diet: is it enough to maintain weight
seen in reduced obese individuals.                                         stability in the reduced-obese individual following weight
                                                                           loss by drug therapy and energy restriction? Obes Res 1999;
                                                                           7: 323 ± 333.
                                                                        20 Khan MA, Herzog CA, St Peter JV, Hartley GG, Madlon-Kay
Acknowledgements                                                           R, Dick CD, Asinger RW, Vessey JT. The prevalence of
This research was supported by grants from Servier                         cardiac valvular insuf®ciency assessed by transthoracic echo-
                     Â
Canada and FCAR Quebec.                                                    cardiography in obese patients treated with appetite-suppres-
                                                                           santdrugs. N Engl J Med 1998; 10: 713 ± 718.
                                                                        21 Weissman NJ, Tighe JFJ, Gottdiener JS, Gwynne JT. An
                                                                           assessment of heart-valve abnormalities in obese patients
References                                                                 taking dexfen¯uramine, sustained-release dexfen¯uramine, or
 1 Leaf A, Weber PC. A new era for science in nutrition. Am J              placebo. Sustained-release dexfen¯uramine study group.
   Clin Nutr 1987; 45: 1048 ± 1053.                                        N Engl J Med 1998; 10: 725 ± 732.
 2 Blundell J, Burley VJ, Cotton JR, Lawton CL. Dietary fat and         22 Prud'homme D, Langlais M, Samson MP, Gallagher P, Tur-
   control of energy intake: evaluating the effects of fat on                                             Â
                                                                           cotte J, Tremblay A, Despres J-P. Lack of major cardiac
   meal size and postmeal satiety. Am J Clin Nutr 1993; 57:                valvular abnormalities in asymptomathic obese men and
   772S ± 778S.                                                            women following a 3-month fen¯uramine or dexfen¯uramine
 3 Lawton CL, Burley VJ, Wales JK, Blundell JE. Dietary fat and            treatment. Int J Obes 1999; 23: S175.
   appetite control in obese subjects: weak effects on satiety. Int J   23 Hill AJ, Blundell JE. The effects of a high-protein or high-
   Obes 1993; 17: 409 ± 416.                                               carbohydrate meal on subjective motivation to eat and food
 4 Aronne LJ, Mackintosh R, Rosenbaum M, Leibel RL, Hirsch                 preferences. Nutr Behav 1986; 3: 133 ± 144.
   J. Autonomic nervous system activity in weight gain and              24 Arvaniti K, Richard D, Tremblay A. Reproducibility of energy
   weight loss. Am J Physiol 1995; 269: R222 ± R225.                       and macronutrient intake and related substrate oxidation rates
 5 Considine RV, Shina MK, Heiman ML, Kriauciunas A,                       in a buffet-type meal. Br J Nutr (in press).
   Stephens TW, Nyce MR, Ohanessian JP, Marco CC, McKee                 25 Richterich R, Dauwwalder H. Zur bestimmung der plasma-
   LJ, Bauer TL, Caro JF. Serum immunoreactive-leptin concen-              glukose-konzentration mit der hexokinase-glucose-6-phos-
   trations in normal-weight and obese subjects. N Engl J Med              phat-deshydrogenase-methode. Schweiz Med Wochenschr
   1996; 334: 292 ± 295.                                                   1971; 101: 615 ± 618.
 6 Goldstein DJ. Bene®cial health effects of modest weight loss.        26 Desbuquois B, Aurbach GD. Use of polyethylene glycol
   Int J Obes 1992; 16: 397 ± 415.                                         to separate free and antibody-bound peptide hormones in
 7 Bray GA. Food intake, sympathetic activity, and adrenal                 radioimmunoassays. J Clin Endocrinol Metab 1971; 37:
   steroids. Brain Res Bull 1993; 32: 537 ± 541.                           732 ± 738.

                                                                                                                        International Journal of Obesity
Weight loss and appetite
                                                                   E Doucet et al
914
          27 Couillard C, Mauriege P, Prud'homme D, Nadeau A, Trem-                     33 Scholz GH, Englaro P, Thiele I, Scholz M, Klusmann T,
             blay A, Bouchard C, Despres JP. Plasma leptin concentrations:                 Kellner K, Rascher W, Blum WF. Dissociation of serum leptin
             gender differences and associations with metabolic risk                       concentration and body fat content during long term dietary
             factors for cardiovascular disease. Diabetologia 1997; 40:                    intervention in obese individuals. Horm Metab Res 1996; 28:
             1178 ± 1184.                                                                  718 ± 723.
          28 Pasman WJ, Saris WH, Westerterp-Plantenga MS. Predictors                   34 Arvaniti K, Deshaies Y, Richard D. Effect of leptin on energy
             of weight maintenance. Obes Res 1999; 7: 43 ± 50.                             balance does not require the presence of intact adrenals. Am J
          29 Imbeault P, Saint-Pierre S, Almeras N, Tremblay A. Acute                      Physiol 1998; 275: R105 ± 111.
             effects of exercise on energy intake and feeding behaviour.                35 Dagnault A, Deshais Y, Richard D. Effects of the
             Br J Nutr 1997; 77: 511 ± 521.                                                5-hydroxytryptamine agonist D, L-fen¯uramine on energy
          30 Kissileff HR, Pi-Sunyer FX, Segal K, Meltzer S, Foelsch PA.                   balance in rats: in¯uence of gender. Int J Obes 1993; 17:
             Acute effects of exercise on food intake in obese and nonobese                367 ± 373.
             women. Am J Clin Nutr 1990; 52: 240 ± 245.                                 36 Burlet C. Stress and feeding behavior. Ann Endocrinol 1988;
          31 Zhang Y, Proenca R, Maffei M, Barone M, Leopold L,                            49: 141 ± 145.
             Friedman JM. Positional cloning of the mouse obese gene                    37 Timofeeva E, Richard D. Functional activation of
             and its human homologue. Nature 1994; 372: 425 ± 432.                         CRH neurons and expression of the genes encoding
          32 Karhunen L, Haffner S, Lappalainen R, Turpeinen A, Mietti-                    CRH and its receptors in food-deprived lean ( Faa?) and
             nen H, Uusitupa M. Serum leptin and short-term regulation of                  obese ( faafa) Zucker rats. Neuroendocrinology 1997; 66:
             eating in obese women. Clin Sci 1997; 92: 573 ± 578.                          327 ± 340.


          Appendix A         Composition of the breakfast meal test in men and women

          Foods                                     Weight (g)              Proteins (g)             CHO (g)             Fat (g)          Energy kJ (kcal)

          Wholewheat bread                              55                      6.9                   31.2                1.9                712.(170)
          Smooth peanut butter                          17                      4.3                    3.2                8.6                448.(107)
          Strawberry jam (Kraft)                        20                      0.1                   14                  0                  234.(56)
          Mozzarella cheese, 17% m.f.                   50                     13.7                    1.6                8.6                582.(139)
          Butter                                        10                      0.1                    0                  8.1                306.(73)
          Orange juice                                 150                      1                     16.2                0.1                293.(70)
          Milk, 2% m.f.a                               200                      6.7                    9.6                3.8                414.(99)

          Total women                                 302 g                    26.1 g                 66.2 g             27.3 g             2575.(615)
          Total men                                   502 g                    32.8 g                 75.8 g             31.1 g             2989.(715)
          a
           Milk was only included in the test meal for men. m.f. ˆ milk fat.


International Journal of Obesity

Mais conteúdo relacionado

Mais procurados

Importance of nutrition in hospitalized patients
Importance of nutrition in hospitalized patientsImportance of nutrition in hospitalized patients
Importance of nutrition in hospitalized patientsAzam Jafri
 
Journal of clinical nutrition : How to treat obesity with calorically unrestr...
Journal of clinical nutrition : How to treat obesity with calorically unrestr...Journal of clinical nutrition : How to treat obesity with calorically unrestr...
Journal of clinical nutrition : How to treat obesity with calorically unrestr...Wouter de Heij
 
Bariatric surgery for the treatment of Type II Diabetes
Bariatric surgery for the treatment of Type II Diabetes Bariatric surgery for the treatment of Type II Diabetes
Bariatric surgery for the treatment of Type II Diabetes Ross Finesmith M.D.
 
Importance of nutritional management during hospitalization
Importance of nutritional management during hospitalizationImportance of nutritional management during hospitalization
Importance of nutritional management during hospitalizationBushra Tariq
 
Case study on Holistic Diabetic Care using Diet, Yoga, Resisted Exercises usi...
Case study on Holistic Diabetic Care using Diet, Yoga, Resisted Exercises usi...Case study on Holistic Diabetic Care using Diet, Yoga, Resisted Exercises usi...
Case study on Holistic Diabetic Care using Diet, Yoga, Resisted Exercises usi...iosrjce
 
AssociationsBetweenBMIandFatTasteSensitivityInHumans.full
AssociationsBetweenBMIandFatTasteSensitivityInHumans.fullAssociationsBetweenBMIandFatTasteSensitivityInHumans.full
AssociationsBetweenBMIandFatTasteSensitivityInHumans.fullClaire Edlinger
 
Feasting or fasting in ICU? by Professor Marianne Chapman
Feasting or fasting in ICU? by Professor Marianne ChapmanFeasting or fasting in ICU? by Professor Marianne Chapman
Feasting or fasting in ICU? by Professor Marianne ChapmanSMACC Conference
 
The taming of the sprue
The taming of the sprueThe taming of the sprue
The taming of the sprueEd McDonald
 
Functional Gastrointestinal disorders
Functional Gastrointestinal disordersFunctional Gastrointestinal disorders
Functional Gastrointestinal disordersJane Ricaforte-Campos
 
Malnutrition in the hospital
Malnutrition in the hospitalMalnutrition in the hospital
Malnutrition in the hospitalCorrie T
 
Antalya poster presentation
Antalya poster presentationAntalya poster presentation
Antalya poster presentationperparim ferunaj
 
Welch Final Poster
Welch Final PosterWelch Final Poster
Welch Final PosterCook Welch
 
ACG: American College of Gastroenterology Poster - Acute Gastric Dilation
ACG: American College of Gastroenterology Poster - Acute Gastric DilationACG: American College of Gastroenterology Poster - Acute Gastric Dilation
ACG: American College of Gastroenterology Poster - Acute Gastric DilationEd McDonald
 
Anti Diabetes Operations: The Foundation for New Procedures
Anti Diabetes Operations: The Foundation for New ProceduresAnti Diabetes Operations: The Foundation for New Procedures
Anti Diabetes Operations: The Foundation for New ProceduresGeorge S. Ferzli
 

Mais procurados (20)

Espen uci 2019
Espen uci 2019Espen uci 2019
Espen uci 2019
 
Importance of nutrition in hospitalized patients
Importance of nutrition in hospitalized patientsImportance of nutrition in hospitalized patients
Importance of nutrition in hospitalized patients
 
Journal of clinical nutrition : How to treat obesity with calorically unrestr...
Journal of clinical nutrition : How to treat obesity with calorically unrestr...Journal of clinical nutrition : How to treat obesity with calorically unrestr...
Journal of clinical nutrition : How to treat obesity with calorically unrestr...
 
Bariatric surgery for the treatment of Type II Diabetes
Bariatric surgery for the treatment of Type II Diabetes Bariatric surgery for the treatment of Type II Diabetes
Bariatric surgery for the treatment of Type II Diabetes
 
Importance of nutritional management during hospitalization
Importance of nutritional management during hospitalizationImportance of nutritional management during hospitalization
Importance of nutritional management during hospitalization
 
Nutirion Training Module By Mili
Nutirion Training Module By Mili Nutirion Training Module By Mili
Nutirion Training Module By Mili
 
Case study on Holistic Diabetic Care using Diet, Yoga, Resisted Exercises usi...
Case study on Holistic Diabetic Care using Diet, Yoga, Resisted Exercises usi...Case study on Holistic Diabetic Care using Diet, Yoga, Resisted Exercises usi...
Case study on Holistic Diabetic Care using Diet, Yoga, Resisted Exercises usi...
 
AssociationsBetweenBMIandFatTasteSensitivityInHumans.full
AssociationsBetweenBMIandFatTasteSensitivityInHumans.fullAssociationsBetweenBMIandFatTasteSensitivityInHumans.full
AssociationsBetweenBMIandFatTasteSensitivityInHumans.full
 
Chron's Case Study
Chron's Case StudyChron's Case Study
Chron's Case Study
 
Nutrition in icu
Nutrition in icuNutrition in icu
Nutrition in icu
 
Feasting or fasting in ICU? by Professor Marianne Chapman
Feasting or fasting in ICU? by Professor Marianne ChapmanFeasting or fasting in ICU? by Professor Marianne Chapman
Feasting or fasting in ICU? by Professor Marianne Chapman
 
The taming of the sprue
The taming of the sprueThe taming of the sprue
The taming of the sprue
 
Functional Gastrointestinal disorders
Functional Gastrointestinal disordersFunctional Gastrointestinal disorders
Functional Gastrointestinal disorders
 
Malnutrition in the hospital
Malnutrition in the hospitalMalnutrition in the hospital
Malnutrition in the hospital
 
Antalya poster presentation
Antalya poster presentationAntalya poster presentation
Antalya poster presentation
 
Ibs
IbsIbs
Ibs
 
Welch Final Poster
Welch Final PosterWelch Final Poster
Welch Final Poster
 
ACG: American College of Gastroenterology Poster - Acute Gastric Dilation
ACG: American College of Gastroenterology Poster - Acute Gastric DilationACG: American College of Gastroenterology Poster - Acute Gastric Dilation
ACG: American College of Gastroenterology Poster - Acute Gastric Dilation
 
Enteral nutrition ICU
Enteral nutrition ICU Enteral nutrition ICU
Enteral nutrition ICU
 
Anti Diabetes Operations: The Foundation for New Procedures
Anti Diabetes Operations: The Foundation for New ProceduresAnti Diabetes Operations: The Foundation for New Procedures
Anti Diabetes Operations: The Foundation for New Procedures
 

Destaque

Designing great customer experiences: NACE presentation
Designing great customer experiences: NACE presentationDesigning great customer experiences: NACE presentation
Designing great customer experiences: NACE presentationStephanie Weaver
 
Wiki Virtuarts
Wiki VirtuartsWiki Virtuarts
Wiki Virtuartsvirtuarts
 
Leading Museum Transformations
Leading Museum TransformationsLeading Museum Transformations
Leading Museum TransformationsStephanie Weaver
 
Speaker coaching: Learn how to give TEDx style presentations
Speaker coaching: Learn how to give TEDx style presentationsSpeaker coaching: Learn how to give TEDx style presentations
Speaker coaching: Learn how to give TEDx style presentationsStephanie Weaver
 
The Participatory Museum with Nina Simon
The Participatory Museum with Nina SimonThe Participatory Museum with Nina Simon
The Participatory Museum with Nina SimonStephanie Weaver
 
Participatory museum experiences and performative practices in museum education
Participatory museum experiences and performative practices in museum educationParticipatory museum experiences and performative practices in museum education
Participatory museum experiences and performative practices in museum educationMarco Peri
 

Destaque (7)

Designing great customer experiences: NACE presentation
Designing great customer experiences: NACE presentationDesigning great customer experiences: NACE presentation
Designing great customer experiences: NACE presentation
 
Wiki Virtuarts
Wiki VirtuartsWiki Virtuarts
Wiki Virtuarts
 
Leading Museum Transformations
Leading Museum TransformationsLeading Museum Transformations
Leading Museum Transformations
 
Speaker coaching: Learn how to give TEDx style presentations
Speaker coaching: Learn how to give TEDx style presentationsSpeaker coaching: Learn how to give TEDx style presentations
Speaker coaching: Learn how to give TEDx style presentations
 
The Participatory Museum with Nina Simon
The Participatory Museum with Nina SimonThe Participatory Museum with Nina Simon
The Participatory Museum with Nina Simon
 
Fql questions
Fql questionsFql questions
Fql questions
 
Participatory museum experiences and performative practices in museum education
Participatory museum experiences and performative practices in museum educationParticipatory museum experiences and performative practices in museum education
Participatory museum experiences and performative practices in museum education
 

Semelhante a Appetitie and Weight Loss

An extensive literature review on Nutrigenetics -A new trajectory in obesity...
 An extensive literature review on Nutrigenetics -A new trajectory in obesity... An extensive literature review on Nutrigenetics -A new trajectory in obesity...
An extensive literature review on Nutrigenetics -A new trajectory in obesity...nutritionistrepublic
 
04 May 2015Page 1 of 28ProQuestIntegrating Fundamental Conce.docx
04 May 2015Page 1 of 28ProQuestIntegrating Fundamental Conce.docx04 May 2015Page 1 of 28ProQuestIntegrating Fundamental Conce.docx
04 May 2015Page 1 of 28ProQuestIntegrating Fundamental Conce.docxmercysuttle
 
Effect of fasting and fat ingestion in athletes
Effect of fasting and fat ingestion in athletesEffect of fasting and fat ingestion in athletes
Effect of fasting and fat ingestion in athletesKrishitaMukherjee
 
Mechanisms of Glucose Homeostasis Final
Mechanisms of Glucose Homeostasis FinalMechanisms of Glucose Homeostasis Final
Mechanisms of Glucose Homeostasis FinalDan Svedberg
 
Type 2 dm etiology & reversibility (diabetes care, april 2013)
Type 2 dm etiology & reversibility (diabetes care, april 2013)Type 2 dm etiology & reversibility (diabetes care, april 2013)
Type 2 dm etiology & reversibility (diabetes care, april 2013)Endocrinology Department, BSMMU
 
Hyperemesis Case Study
Hyperemesis Case StudyHyperemesis Case Study
Hyperemesis Case Studyemschumann
 
nutrition, obesity and body weight regulation
nutrition, obesity and body weight regulationnutrition, obesity and body weight regulation
nutrition, obesity and body weight regulationDrQamarYasmeen
 
SCOPE School Dublin - David Heber
SCOPE School Dublin - David HeberSCOPE School Dublin - David Heber
SCOPE School Dublin - David Heber_IASO_
 
Pancreatic enzyme replacement therapy in pancreatic insufficiency
Pancreatic enzyme replacement therapy in pancreatic insufficiencyPancreatic enzyme replacement therapy in pancreatic insufficiency
Pancreatic enzyme replacement therapy in pancreatic insufficiencyDrRahul Singh
 
1_Nutrition_in_critical_care_dr_Daniel_Maranata.pdf
1_Nutrition_in_critical_care_dr_Daniel_Maranata.pdf1_Nutrition_in_critical_care_dr_Daniel_Maranata.pdf
1_Nutrition_in_critical_care_dr_Daniel_Maranata.pdfwisnukuncoro11
 
Biochemical aspects of Obesity and its complications.ppt
Biochemical aspects of Obesity and its complications.pptBiochemical aspects of Obesity and its complications.ppt
Biochemical aspects of Obesity and its complications.pptRevathy Gunaseelan
 
Food intake, energy balance and body weight controlE Douce.docx
Food intake, energy balance and body weight controlE Douce.docxFood intake, energy balance and body weight controlE Douce.docx
Food intake, energy balance and body weight controlE Douce.docxbudbarber38650
 

Semelhante a Appetitie and Weight Loss (20)

An extensive literature review on Nutrigenetics -A new trajectory in obesity...
 An extensive literature review on Nutrigenetics -A new trajectory in obesity... An extensive literature review on Nutrigenetics -A new trajectory in obesity...
An extensive literature review on Nutrigenetics -A new trajectory in obesity...
 
04 May 2015Page 1 of 28ProQuestIntegrating Fundamental Conce.docx
04 May 2015Page 1 of 28ProQuestIntegrating Fundamental Conce.docx04 May 2015Page 1 of 28ProQuestIntegrating Fundamental Conce.docx
04 May 2015Page 1 of 28ProQuestIntegrating Fundamental Conce.docx
 
Queen's Study
Queen's StudyQueen's Study
Queen's Study
 
Effect of fasting and fat ingestion in athletes
Effect of fasting and fat ingestion in athletesEffect of fasting and fat ingestion in athletes
Effect of fasting and fat ingestion in athletes
 
Mechanisms of Glucose Homeostasis Final
Mechanisms of Glucose Homeostasis FinalMechanisms of Glucose Homeostasis Final
Mechanisms of Glucose Homeostasis Final
 
weight loss.pdf
weight loss.pdfweight loss.pdf
weight loss.pdf
 
Type 2 dm etiology & reversibility (diabetes care, april 2013)
Type 2 dm etiology & reversibility (diabetes care, april 2013)Type 2 dm etiology & reversibility (diabetes care, april 2013)
Type 2 dm etiology & reversibility (diabetes care, april 2013)
 
FInal Draft
FInal DraftFInal Draft
FInal Draft
 
Hyperemesis Case Study
Hyperemesis Case StudyHyperemesis Case Study
Hyperemesis Case Study
 
Energy Balance
Energy BalanceEnergy Balance
Energy Balance
 
Obesity
ObesityObesity
Obesity
 
nutrition, obesity and body weight regulation
nutrition, obesity and body weight regulationnutrition, obesity and body weight regulation
nutrition, obesity and body weight regulation
 
Resultados de la cirugía metabólica
Resultados de la cirugía metabólicaResultados de la cirugía metabólica
Resultados de la cirugía metabólica
 
SCOPE School Dublin - David Heber
SCOPE School Dublin - David HeberSCOPE School Dublin - David Heber
SCOPE School Dublin - David Heber
 
Publication
PublicationPublication
Publication
 
Pancreatic enzyme replacement therapy in pancreatic insufficiency
Pancreatic enzyme replacement therapy in pancreatic insufficiencyPancreatic enzyme replacement therapy in pancreatic insufficiency
Pancreatic enzyme replacement therapy in pancreatic insufficiency
 
1_Nutrition_in_critical_care_dr_Daniel_Maranata.pdf
1_Nutrition_in_critical_care_dr_Daniel_Maranata.pdf1_Nutrition_in_critical_care_dr_Daniel_Maranata.pdf
1_Nutrition_in_critical_care_dr_Daniel_Maranata.pdf
 
Biochemical aspects of Obesity and its complications.ppt
Biochemical aspects of Obesity and its complications.pptBiochemical aspects of Obesity and its complications.ppt
Biochemical aspects of Obesity and its complications.ppt
 
Amazing Results From Japanese Tonic
Amazing Results From Japanese TonicAmazing Results From Japanese Tonic
Amazing Results From Japanese Tonic
 
Food intake, energy balance and body weight controlE Douce.docx
Food intake, energy balance and body weight controlE Douce.docxFood intake, energy balance and body weight controlE Douce.docx
Food intake, energy balance and body weight controlE Douce.docx
 

Último

Choosing the Right CBSE School A Comprehensive Guide for Parents
Choosing the Right CBSE School A Comprehensive Guide for ParentsChoosing the Right CBSE School A Comprehensive Guide for Parents
Choosing the Right CBSE School A Comprehensive Guide for Parentsnavabharathschool99
 
Barangay Council for the Protection of Children (BCPC) Orientation.pptx
Barangay Council for the Protection of Children (BCPC) Orientation.pptxBarangay Council for the Protection of Children (BCPC) Orientation.pptx
Barangay Council for the Protection of Children (BCPC) Orientation.pptxCarlos105
 
Difference Between Search & Browse Methods in Odoo 17
Difference Between Search & Browse Methods in Odoo 17Difference Between Search & Browse Methods in Odoo 17
Difference Between Search & Browse Methods in Odoo 17Celine George
 
Visit to a blind student's school🧑‍🦯🧑‍🦯(community medicine)
Visit to a blind student's school🧑‍🦯🧑‍🦯(community medicine)Visit to a blind student's school🧑‍🦯🧑‍🦯(community medicine)
Visit to a blind student's school🧑‍🦯🧑‍🦯(community medicine)lakshayb543
 
Inclusivity Essentials_ Creating Accessible Websites for Nonprofits .pdf
Inclusivity Essentials_ Creating Accessible Websites for Nonprofits .pdfInclusivity Essentials_ Creating Accessible Websites for Nonprofits .pdf
Inclusivity Essentials_ Creating Accessible Websites for Nonprofits .pdfTechSoup
 
Transaction Management in Database Management System
Transaction Management in Database Management SystemTransaction Management in Database Management System
Transaction Management in Database Management SystemChristalin Nelson
 
Virtual-Orientation-on-the-Administration-of-NATG12-NATG6-and-ELLNA.pdf
Virtual-Orientation-on-the-Administration-of-NATG12-NATG6-and-ELLNA.pdfVirtual-Orientation-on-the-Administration-of-NATG12-NATG6-and-ELLNA.pdf
Virtual-Orientation-on-the-Administration-of-NATG12-NATG6-and-ELLNA.pdfErwinPantujan2
 
Field Attribute Index Feature in Odoo 17
Field Attribute Index Feature in Odoo 17Field Attribute Index Feature in Odoo 17
Field Attribute Index Feature in Odoo 17Celine George
 
Proudly South Africa powerpoint Thorisha.pptx
Proudly South Africa powerpoint Thorisha.pptxProudly South Africa powerpoint Thorisha.pptx
Proudly South Africa powerpoint Thorisha.pptxthorishapillay1
 
4.16.24 21st Century Movements for Black Lives.pptx
4.16.24 21st Century Movements for Black Lives.pptx4.16.24 21st Century Movements for Black Lives.pptx
4.16.24 21st Century Movements for Black Lives.pptxmary850239
 
ENGLISH 7_Q4_LESSON 2_ Employing a Variety of Strategies for Effective Interp...
ENGLISH 7_Q4_LESSON 2_ Employing a Variety of Strategies for Effective Interp...ENGLISH 7_Q4_LESSON 2_ Employing a Variety of Strategies for Effective Interp...
ENGLISH 7_Q4_LESSON 2_ Employing a Variety of Strategies for Effective Interp...JhezDiaz1
 
AUDIENCE THEORY -CULTIVATION THEORY - GERBNER.pptx
AUDIENCE THEORY -CULTIVATION THEORY -  GERBNER.pptxAUDIENCE THEORY -CULTIVATION THEORY -  GERBNER.pptx
AUDIENCE THEORY -CULTIVATION THEORY - GERBNER.pptxiammrhaywood
 
Earth Day Presentation wow hello nice great
Earth Day Presentation wow hello nice greatEarth Day Presentation wow hello nice great
Earth Day Presentation wow hello nice greatYousafMalik24
 
Culture Uniformity or Diversity IN SOCIOLOGY.pptx
Culture Uniformity or Diversity IN SOCIOLOGY.pptxCulture Uniformity or Diversity IN SOCIOLOGY.pptx
Culture Uniformity or Diversity IN SOCIOLOGY.pptxPoojaSen20
 
Concurrency Control in Database Management system
Concurrency Control in Database Management systemConcurrency Control in Database Management system
Concurrency Control in Database Management systemChristalin Nelson
 
Judging the Relevance and worth of ideas part 2.pptx
Judging the Relevance  and worth of ideas part 2.pptxJudging the Relevance  and worth of ideas part 2.pptx
Judging the Relevance and worth of ideas part 2.pptxSherlyMaeNeri
 
ECONOMIC CONTEXT - PAPER 1 Q3: NEWSPAPERS.pptx
ECONOMIC CONTEXT - PAPER 1 Q3: NEWSPAPERS.pptxECONOMIC CONTEXT - PAPER 1 Q3: NEWSPAPERS.pptx
ECONOMIC CONTEXT - PAPER 1 Q3: NEWSPAPERS.pptxiammrhaywood
 

Último (20)

Choosing the Right CBSE School A Comprehensive Guide for Parents
Choosing the Right CBSE School A Comprehensive Guide for ParentsChoosing the Right CBSE School A Comprehensive Guide for Parents
Choosing the Right CBSE School A Comprehensive Guide for Parents
 
Barangay Council for the Protection of Children (BCPC) Orientation.pptx
Barangay Council for the Protection of Children (BCPC) Orientation.pptxBarangay Council for the Protection of Children (BCPC) Orientation.pptx
Barangay Council for the Protection of Children (BCPC) Orientation.pptx
 
Raw materials used in Herbal Cosmetics.pptx
Raw materials used in Herbal Cosmetics.pptxRaw materials used in Herbal Cosmetics.pptx
Raw materials used in Herbal Cosmetics.pptx
 
Difference Between Search & Browse Methods in Odoo 17
Difference Between Search & Browse Methods in Odoo 17Difference Between Search & Browse Methods in Odoo 17
Difference Between Search & Browse Methods in Odoo 17
 
FINALS_OF_LEFT_ON_C'N_EL_DORADO_2024.pptx
FINALS_OF_LEFT_ON_C'N_EL_DORADO_2024.pptxFINALS_OF_LEFT_ON_C'N_EL_DORADO_2024.pptx
FINALS_OF_LEFT_ON_C'N_EL_DORADO_2024.pptx
 
Visit to a blind student's school🧑‍🦯🧑‍🦯(community medicine)
Visit to a blind student's school🧑‍🦯🧑‍🦯(community medicine)Visit to a blind student's school🧑‍🦯🧑‍🦯(community medicine)
Visit to a blind student's school🧑‍🦯🧑‍🦯(community medicine)
 
Inclusivity Essentials_ Creating Accessible Websites for Nonprofits .pdf
Inclusivity Essentials_ Creating Accessible Websites for Nonprofits .pdfInclusivity Essentials_ Creating Accessible Websites for Nonprofits .pdf
Inclusivity Essentials_ Creating Accessible Websites for Nonprofits .pdf
 
Transaction Management in Database Management System
Transaction Management in Database Management SystemTransaction Management in Database Management System
Transaction Management in Database Management System
 
Virtual-Orientation-on-the-Administration-of-NATG12-NATG6-and-ELLNA.pdf
Virtual-Orientation-on-the-Administration-of-NATG12-NATG6-and-ELLNA.pdfVirtual-Orientation-on-the-Administration-of-NATG12-NATG6-and-ELLNA.pdf
Virtual-Orientation-on-the-Administration-of-NATG12-NATG6-and-ELLNA.pdf
 
Field Attribute Index Feature in Odoo 17
Field Attribute Index Feature in Odoo 17Field Attribute Index Feature in Odoo 17
Field Attribute Index Feature in Odoo 17
 
Proudly South Africa powerpoint Thorisha.pptx
Proudly South Africa powerpoint Thorisha.pptxProudly South Africa powerpoint Thorisha.pptx
Proudly South Africa powerpoint Thorisha.pptx
 
4.16.24 21st Century Movements for Black Lives.pptx
4.16.24 21st Century Movements for Black Lives.pptx4.16.24 21st Century Movements for Black Lives.pptx
4.16.24 21st Century Movements for Black Lives.pptx
 
ENGLISH 7_Q4_LESSON 2_ Employing a Variety of Strategies for Effective Interp...
ENGLISH 7_Q4_LESSON 2_ Employing a Variety of Strategies for Effective Interp...ENGLISH 7_Q4_LESSON 2_ Employing a Variety of Strategies for Effective Interp...
ENGLISH 7_Q4_LESSON 2_ Employing a Variety of Strategies for Effective Interp...
 
AUDIENCE THEORY -CULTIVATION THEORY - GERBNER.pptx
AUDIENCE THEORY -CULTIVATION THEORY -  GERBNER.pptxAUDIENCE THEORY -CULTIVATION THEORY -  GERBNER.pptx
AUDIENCE THEORY -CULTIVATION THEORY - GERBNER.pptx
 
Earth Day Presentation wow hello nice great
Earth Day Presentation wow hello nice greatEarth Day Presentation wow hello nice great
Earth Day Presentation wow hello nice great
 
Culture Uniformity or Diversity IN SOCIOLOGY.pptx
Culture Uniformity or Diversity IN SOCIOLOGY.pptxCulture Uniformity or Diversity IN SOCIOLOGY.pptx
Culture Uniformity or Diversity IN SOCIOLOGY.pptx
 
Concurrency Control in Database Management system
Concurrency Control in Database Management systemConcurrency Control in Database Management system
Concurrency Control in Database Management system
 
YOUVE_GOT_EMAIL_PRELIMS_EL_DORADO_2024.pptx
YOUVE_GOT_EMAIL_PRELIMS_EL_DORADO_2024.pptxYOUVE_GOT_EMAIL_PRELIMS_EL_DORADO_2024.pptx
YOUVE_GOT_EMAIL_PRELIMS_EL_DORADO_2024.pptx
 
Judging the Relevance and worth of ideas part 2.pptx
Judging the Relevance  and worth of ideas part 2.pptxJudging the Relevance  and worth of ideas part 2.pptx
Judging the Relevance and worth of ideas part 2.pptx
 
ECONOMIC CONTEXT - PAPER 1 Q3: NEWSPAPERS.pptx
ECONOMIC CONTEXT - PAPER 1 Q3: NEWSPAPERS.pptxECONOMIC CONTEXT - PAPER 1 Q3: NEWSPAPERS.pptx
ECONOMIC CONTEXT - PAPER 1 Q3: NEWSPAPERS.pptx
 

Appetitie and Weight Loss

  • 1. International Journal of Obesity (2000) 24, 906±914 ß 2000 Macmillan Publishers Ltd All rights reserved 0307±0565/00 $15.00 www.nature.com/ijo Appetite after weight loss by energy restriction and a low-fat diet±exercise follow-up  Á E Doucet1, P Imbeault1, S St-Pierre1, N Almeras1, P Mauriege1, D Richard1 and A Tremblay1* 1  Division of Kinesiology, Department of Social and Preventive Medicine, Laval University, Ste-Foy, Quebec, Canada G1K 7P4 OBJECTIVE: The aim of the present study was to determine the impact of weight loss on appetite as measured by visual analog scale (VAS). METHODS: Seventeen subjects (10 men and seven women) took part in a 15 week weight loss program which consisted of drug therapy (fen¯uramine 60 mgaday) or placebo coupled to an energy restriction (À2930 kJaday; phase 1) followed by an 18 week low-fat diet ± exercise follow-up (phase 2). Subjects were given a standardized breakfast before and after phase 1 as well as after phase 2. Individuals were asked to ®ll out VAS before and at 0, 10, 20, 30, 40, 50 and 60 min after this test meal. Blood samples were drawn before the meal and at 0, 30 and 60 min postprandially and analyzed for glucose and insulin. Fasting plasma cortisol and leptin were also determined. RESULTS: An increase in the fasting desire to eat, hunger and prospective food consumption (PFC) was observed after phase 1 and to an even greater extent after phase 2 in both men and women. In the fasting state, positive correlations were observed between changes in the desire to eat (r ˆ 0.76; P ` 0.05) as well as changes of PFC (r ˆ 0.82; P ` 0.05) and changes in cortisol at the end of phase 1 for women. In response to phase 1, statistically signi®cant correlations were found between changes of hunger (r ˆ 0.64; P ` 0.05) and desire to eat (r ˆ 0.67; P ` 0.05) as measured by AUC in response to the meal and changes of fasting plasma cortisol in men. The most consistent predictor of changes of baseline desire to eat (r ˆ 0.68 P ` 0.05), fullness (r ˆ À0.78, P ` 0.05) and PFC (r ˆ 0.91, P ` 0.01) during phase 2 was the change in fasting cortisol in men. Changes of fullness were also associated with changes of fasting leptin in men (r ˆ 0.68; P ` 0.05) during phase 2. CONCLUSION: These results suggest that weight loss is accompanied by an increase of baseline appetite in both men and women and that the most consistent predictor of these changes in appetite seems to be changes in fasting plasma cortisol. International Journal of Obesity (2000) 24, 906±914 Keywords: weight loss; appetite; cortisol; visual analog scale Introduction etiology of obesity, and nutritional strategies are now consequently being developed by health profes- sionals to promote satiety with a minimal energy Obesity prevalence has increased considerably intake. throughout the latter half of this century. This increase Another important dimension of this problem that in obesity was paralleled to important changes in food has been scarcely documented up to now is the consumption patterns.1 In a context where virtually question as to whether appetite is altered by weight unlimited access to high-fat foods is made possible, loss. This hypothesis came from the fact that weight the maintenance of energy balance seems to be loss is characterized by numerous metabolic andaor dif®cult to achieve for many individuals. This might endocrine adaptations that might in turn affect appe- be due to the fact that this type of dietary regimen has tite in the reduced-obese state. Indeed, weight loss has a weak potential to produce potent satiety signals and been shown to reduce sympathetic nervous system to inhibit subsequent energy intake.2,3 This situation activity,4 plasma leptin5 and insulin,6 all of which have often leads to passive overconsumption and thus to been shown to inhibit food and energy intake.7 ± 10 positive energy and fat balance, and over time to Moreover, weight loss has also been shown to excess body fat storage. In this context, it can be improve glycemic control,11 which is partly re¯ected speculated that the potential of this type of dietary by a decrease in fasting glucose. This might be regimen to suppress appetite-related feelings may not problematic in a context where a decrease in glycemia be as effective as that which characterized the lifestyle has been shown to trigger episodes of feeding.12,13 It is of our ancestors. Thus, subjective feelings of hunger thus possible that, in order to achieve a comparable and satiety might play an important role in the level of satiety to what was experienced while still obese, a more substantial amount of energy has to be consumed to compensate for the reduced impact of the *Correspondence: A Tremblay, Division of Kinesiology, PEPS, above-mentioned factors on appetite-related variables. Laval University, Ste-Foy, Quebec, Canada G1K 7P4.  This phenomenon might in turn partly explain the fact E-mail: angelo.tremblay@kin.msp.ulaval.ca Received 23 July 1999; revised 17 December 1999; accepted that most reduced-obese individuals regain the weight 23 February 2000 lost within a relatively short period of time if no
  • 2. Weight loss and appetite E Doucet et al 907 intervention is undertaken to prevent this unfortunate valvular function,20,21 all subjects (including placebos) outcome.14 were subjected to an echocardiogram. Following this Few studies have directly addressed the issue as to assessment, a detailed analysis of cardiac valvular whether appetite scores are affected by prolonged function was performed by cardiologists, who energy de®cit and consequent weight loss. In this detected no abnormalities in response to the use of context, Heini et al 15 have observed that during fen¯uramine under these conditions.22 controlled weight loss, although no signi®cant changes in hunger±satiety levels were found, some positive correlations were observed between postpran- Weight loss program dial changes in these variables and fractional changes This program was designed as a two-phase program as in glucose and insulin. Results from the same group previously described.19 Phase 1 consisted of a 15- have also demonstrated that during energy restriction, week non-macronutrient speci®c energy restriction of changes in leptin are accompanied by changes in 2930 kJaday (À700 kcaladay) coupled to drug therapy hunger±satiety ratings16 which might be partly (fen¯uramine 60 mgaday) or placebo. Following explained by the fact that leptin levels were shown phase 1, a low fat diet from which 30% of total to predict palatability scores.17 It has also been energy intake (EI; 8445 Æ 158 and 7590 Æ 273 kJ for reported that, in response to weight loss induced by men and women, respectively) came from fat, 53% energy restriction and physical activity, changes in from carbohydrates and 17% from proteins, as well as day-long visual analog scale (VAS) measurements an aerobic exercise prescription (60±75% of VO2 were associated with changes in leptin and glucose.18 max; 3±5 times a week; 45±60 minasession) were We thus hypothesized that the reduced-obese state prescribed to subjects for a mean duration of 18 weeks would be characterized by an increase of VAS vari- (phase 2). To ensure proper monitoring of exercise ables measured in the fasting state and that a given intensity and duration and to verify the subjects' amount of calories would exert a lesser in¯uence over compliance to the exercise prescription, they had to the subjective feelings of hunger and satiety due to wear a heart rate monitor (Polar Vantage XLTM HRM, some hormonal adaptations to weight loss. In this Stamford, CT) during their exercise sessions to assess study, we measured the impact of a standardized mean heart rate and duration of the training sessions. breakfast test meal on the subjective feelings of Noteworthy is the fact that phase 2 was continued appetite as measured by VAS as well as their relation until a resistance to further lose fat was achieved in to changes in fasting plasma glucose, insulin, leptin subjects. That is, a threshold beyond which a further and cortisol in the obese state, after a 15-week drug reduction andaor manipulation of energy intake therapy intervention in the reduced-obese state, and andaor an increase in energy expenditure derived after an additional 18-week low-fat diet±exercise from physical activities would have caused subjects follow-up. to feel unable to comply with the prescription over time. This was done to ensure long term maintenance of the healthier lifestyle which resulted from this intervention program. Since this approach was indivi- Methods dualized, some subjects reached this resistance to further lose fat before others and thus the duration of this follow-up period was different amongst indi- Seventeen obese subjects (10 men and seven women) viduals (from 8 to 24 weeks). underwent weight loss by drug therapy (60 mgaday of fen¯uramine) or placebo treatment coupled to a non- macronutrient speci®c energy restriction for a 15- Standardized breakfast test meal week period (phase 1). Since this study was double- Subjects were asked to come to the laboratory after a blind, subjects were given a number in the order in 12 h overnight fast. They were then asked to eat a which they were recruited for the study. Drug or standardized breakfast meal test which consisted of placebo had already been randomly assigned to whole wheat bread, butter, peanut butter, strawberry these numbers while respecting the ratio of 5 to 1 jam, mozzarella cheese and orange juice. The meal drug- or placebo-treated individual, respectively. was designed to have a food quotient of 0.85 and an Phase 1 was followed by an $18-week low-fat energy content of 2993 kJ (715 kcal) and 2574 kJ diet±exercise follow-up (phase 2). A detailed descrip- (615 kcal) for men and women, respectively (see tion of this two-phase weight loss program is given Appendix A). To increase the energy content of the below and has been previously described.19 Subjects test meal in men without changing the food quotient, a gave their written consent to participate in this study, glass of 2% milk fat milk was added to this breakfast which received approval from the Laval University test meal. Subjects were instructed to eat everything Medical Ethics Committee. within a 20 min period. This test meal measurement It is important to note that following the suspension was performed at three different times during the of fen¯uramine and dexfen¯uramine further to a protocol, before phase 1 as well as after phases 1 potential association with disturbances in cardiac and 2. International Journal of Obesity
  • 3. Weight loss and appetite E Doucet et al 908 Visual analog scale measurements (VAS) Glucose and insulin concentrations Desire to eat, hunger, fullness and prospective food Blood samples were collected in tubes containing consumption (PFC) were rated immediately before EDTA and Trasylol (Miles Pharmaceutics, Rexdale, (after a 12 h overnight fast) and at 0, 10, 20, 30, 40, Ontario, Canada) in the fasting state at 0, 30 and 50 and 60 min after the standardized test meal on a 60 min after the meal. Plasma glucose was measured 150 mm VAS which was adapted from Hill and enzymatically,25 whereas plasma insulin concentra- Blundell.23 Questions were asked as follows: (1) tion was determined by radioimmunoassay with poly- `How strong is your desire to eat?' (very weak±very ethylene glycol separation.26 strong); (2) `How hungry do you feel?' (not hungry at all±as hungry as I have ever felt); (3) `How full do you feel?' (not full at all±very full); and (4) `How Plasma leptin and cortisol concentrations much food do you think you could eat?' (nothing at Fasting plasma leptin concentrations were determined all±a large amount). The before breakfast measure- with a highly sensitive commercial double-antibody ment was considered as the fasting measurement for RIA (Human Leptin Speci®c RIA Kit, LINCO all four variables. In order to calculate values of AUC Research, St Louis, MO, USA), which detects rela- in response to the meal for the above variables, tively low leptin levels of 0.5 ngaml and which does measurements at 0, 10, 20, 30, 40, 50 and 60 min not crossreact with human insulin, proinsulin, gluca- were considered in this calculation by using the gon, pancreatic polypeptide or somatostatin. Our trapezoid method, thus not including the fasting coef®cients of variation for the repeated assays score obtained before breakfast. Hence, higher ranged from 4.0 to 5.5% for the lower leptin concen- values for AUC in response to the meal are indicative trations and from 6.5 to 8.5% for higher plasma leptin of a lesser suppression of the test meal for the desire to concentrations.27 Plasma cortisol concentrations were eat, hunger and PFC and at the opposite greater values determined by radioimmunoassay (ICN Biomedicals of AUC in response to the meal for fullness indicate a Inc., Costa Mesa, CA) from fasting plasma samples. greater impact of the meal over this variable. Note- worthy is the fact that the measurements of VAS were performed at least 2±4 weeks after the interruption of Statistical analysis drug therapy after phase 1 and at least 48 h after the Jump Sofware 3.1.6.2. from the SAS Institute Inc. last bout of exercise following phase 2, when they had (Cary, NC, USA) was used for all analysis. Multi- become resistant to further losses of body fat. At all variate analysis of variance (MANOVA) for repeated sampling times subjects had been weight stable. In measures were ®rst performed on all variables to this sense, we can consider that subjects were in assess the effects of gender, treatment, time and energy balance even if weight stability is a gross their interaction. Since gender effects as well as index of energy balance. Moreover, before every genderÂtime interactions were observed, genders visit to the laboratory subjects were instructed to eat were analysed separately. Moreover, since no treat- as they would normally. Women were also tested mentÂtime interactions were noted, placebos and between days 5 and 12 of their menstrual cycle at drug treated individuals were pooled together for all three testing periods. Also of importance is the fact further analysis. To verify the effect of treatment on that VAS measurements were always performed in the VAS variables, paired t-tests were performed with a same environment, ie at the same table with the same Bonnferroni correction. For these analyses, since two lighting in the same room, which was kept free of comparisons were performed, the alpha level was set odors and sounds as well as other factors that might at 0.025. Pearson correlations were also performed contaminate this measurement (visual stimuli, indivi- between the changes of VAS variables (fasting and duals in the room, etc). Under these conditions, VAS AUC in response to the test meal) as well as hormonal measurements in our laboratory have been shown to changes. The alpha level for Pearson correlations was be highly reliable both before and in response to a set at P ` 0.05. All data are expressed as mean meal.24 Æ s.e.m. Blood sampling and analysis It is important to note that all blood samples were Results drawn after an overnight fast of at least 12 h through a venous catheter from an antecubital vein at around 08:00 at all three sampling times. Moreover, subjects As shown in Table 1, phase 1 caused a signi®cant were instructed to abstain from physical exercise 48 h decrease in body weight (À11.6 and À7.3 kg), body before blood sampling. Subjects were also instructed mass index (À3.8 andÀ2.9 kgam2) and fat mass (À9.9 to eat as they would normally before visits to the and À5.6 kg) in men and women respectively, laboratory and women were tested between days 5 and whereas phase 2 caused a signi®cant decrease in fat 12 of their menstrual cycle before and after phase 1 as mass in men only (À4.1 kg). Fat-free mass was also well as after phase 2. slightly reduced in response to phase 1 in both men International Journal of Obesity
  • 4. Weight loss and appetite E Doucet et al 909 Table 1 Subjects' characteristics before and after treatment Before phase1 After phase1 After phase 2 Variables Men Women Men Women Men Women Age (y) 45.0 Æ 1.1 40.1 Æ 1.8 Ð Ð Ð Ð Body weight (kg) 102.2 Æ 3.3 86.7 Æ 2.3 90.6 Æ 2.4a 79.4 Æ 3.2a 88.2 Æ 1.8a 77.6 Æ 3.3a BMI (kgam2) 33.6 Æ 0.7 34.3 Æ 0.8 29.8 Æ 0.6a 31.4 Æ 1.2a 29.1 Æ 0.4a 30.1 Æ 1.3a Fat mass (kg) 37.5 Æ 2.1 41.6 Æ 2.4 27.6 Æ 1.5a 36.0 Æ 2.4a 23.5 Æ 1.1b 33.4 Æ 3.1a Fat-free mass (kg) 64.8 Æ 2.0 45.1 Æ 1.7 63.1 Æ 2.0 43.3 Æ 1.3 64.7 Æ 1.9 44.3 Æ 2.0 Mean Æ standard error of the mean; n ˆ 10 and n ˆ 7 for men and women, respectively; BMI ˆ body mass index; means which do not share the same letter are signi®cantly different from one another. and women and, as expected, a slight non-signi®cant hunger were signi®cantly greater than before phase 1 increase of this variable was noted after phase 2. values, while PFC was only signi®cantly different from before phase 1 values in women. The measure- Changes of fasting VAS scores in response to phases 1 ment of fasting fullness remained statistically and 2 unchanged in response to this whole program, be it Figure 1 presents results from the comparison of the after phase 1 or 2 in both sexes.M effects of weight loss on VAS variables measured in the fasting state in the 17 subjects who completed both Changes of post-prandial VAS scores in response to phases 1 and 2. As a result of this program, the fasting phases 1 and 2 desire to eat, hunger and PFC were all increased in Values of AUC in response to the test meal for VAS response to phase 1, although not signi®cantly. More- variables are shown in Table 2. No signi®cant differ- over, at the end of phase 2 fasting desire to eat and ence was observed for both men and women be it after Figure 1 Effects of weight loss on VAS variables measured in the fasting state before and after 15 weeks of drug therapy (phase 1) as well as after an 18 week low-fat diet ± exercise follow-up (phase 2). *,**signi®cantly different from before phase 1 measurement at 0.03 and 0.01, respectively. PFC ˆ prospective food consumption and n ˆ 10 men and 7 women. International Journal of Obesity
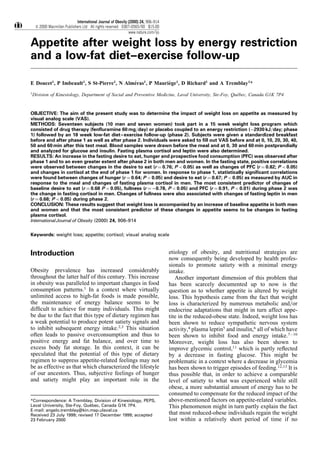
  • 5. Weight loss and appetite E Doucet et al 910 phases 1 or 2, indicating that a meal of a given caloric only variable that came close to statistical signi®cance content seems to in¯uence variables of VAS in a was fullness (r ˆ 0.71, P ˆ 0.07). similar fashion before and after weight loss. Simple correlations were also performed on changes of VAS variables calculated as AUC in response to the test meal which occurred during Correlates of changes of VAS scores in the fasting and phase 2 of VAS and changes of fasting insulin, postprandial states during phase 1 glucose, leptin and cortisol as well as AUC for Simple correlations between changes in VAS vari- glucose and insulin measured during the test meal. ables measured in the fasting state and changes in These analyses failed to reveal any signi®cant asso- fasting insulin, glucose, leptin and cortisol which ciation (results not shown). occurred during phase 1 were performed for both Figure 2 presents the regression lines for changes in men and women. These analyses did not reveal any desire to eat and PFC in the fasting state plotted signi®cant association, except for changes in cortisol against changes in fasting cortisol, insulin and which were signi®cantly associated to changes in leptin. As expected, even when pooling men and desire to eat (r ˆ 0.76, P ` 0.05) and to changes women together, the association was still statistically in PFC (r ˆ 0.82, P ` 0.05) in the fasting state for signi®cant between fasting values of desire to eat women. As for changes in the variables of VAS (r ˆ 0.58, P ` 0.01) and PFC (r ˆ 0.67, P ` 0.01) calculated as AUC in response to the test meal, and fasting cortisol. On the other hand, no signi®cant signi®cant associations were found between changes associations were found between these two markers of in fasting cortisol and changes in AUC desire to eat appetite and fasting insulin and leptin. (r ˆ 0.66, P ` 0.05) and hunger (r ˆ 0.64, P ` 0.05) in men. On the other hand, negative associations were found between changes in AUC of hunger (r ˆ À0.87, P ` 0.05) and PFC (r ˆ À0.84, P ` 0.05) in response Discussion to the test meal and changes in fasting plasma insulin for women in response to phase 1 of this program. Correlation analyses were also performed between The main ®nding of this study is that, in men and changes in VAS variables in the fasting state and in women having undergone considerable weight loss response to a meal and changes in body weight and fat through energy restriction followed by a low-fat diet± mass. These analyses revealed a signi®cant associa- physical exercise intervention, an increase in appetite tion between changes in fat mass and changes in scores as measured by VAS is observed in the fasting fasting PFC (r ˆ 0.64, P ` 0.05) in men in response to phase 1. Table 3 Correlation coef®cients between fasting changes of leptin, cortisol, insulin and glucose and fasting subjective feelings of hunger and satiety as measured by VAS during Correlates of changes of VAS scores in the fasting and phase 2 postprandial states during phase 2 Phase 2 Presented in Table 3 are results from correlation analyses performed between changes of VAS vari- Insulin Glucose Leptin Cortisol ables in the fasting state and changes in fasting Men insulin, glucose, leptin and cortisol which occurred Desire to eat 0.09 0.07 À0.42 0.68* during phase 2. In men, changes in leptin were Hunger 0.11 0.02 À0.35 0.57 Fullness 0.26 0.02 0.68* À0.78** positively and signi®cantly associated with changes PFCa À0.07 0.05 À0.33 0.91** in fullness (r ˆ 0.68, P ` 0.05). In addition, it would Women seem that in men the change of fasting plasma cortisol Desire to eat 0.41 À0.66 0.59 0.60 Hunger 0.40 À0.63 0.54 0.55 was the most consistent predictor of changes in desire Fullness À0.43 0.71b À0.35 0.13 to eat (r ˆ 0.68, P ` 0.05), fullness (r ˆ À0.78, PFCa 0.21 À0.18 0.37 0.06 P ` 0.01) and PFC (r ˆ 0.91, P ` 0.01). In women, *,**P ` 0.05 and 0.01, respectively. the best predictor of changes in the variables of VAS a PFC ˆ prospective food consumption. would seem to be changes in glycemia, even if the b P ˆ 0.07. Table 2 Comparison of VAS measurements calculated as area under the curve in response to a test meal before and after phase 1 as well as after phase 2 Before phase1 After phase1 After phase 2 Variables Men Women Men Women Men Women Desire to eat 867 Æ 315 1499 Æ 627 1330 Æ 437 1561 Æ 604 1436 Æ 530 1544 Æ 695 Hunger 956 Æ 334 1546 Æ 621 1379 Æ 469 1494 Æ 615 1506 Æ 535 1532 Æ 701 Fullness 7402 Æ 480 6665 Æ 867 6998 Æ 491 7261 Æ 713 6898 Æ 638 7210 Æ 678 PFCa 1122 Æ 333 2055 Æ 744 1497 Æ 439 1507 Æ 599 1529 Æ 504 1749 Æ 696 Mean ˆ s.e.m. PFC ˆ prospective food consumption; n ˆ 10 men and 7 women, respectively. International Journal of Obesity
  • 6. Weight loss and appetite E Doucet et al 911 Figure 2 Correlation analysis between changes in fasting desire to eat and prospective food consumption (PFC) and changes in fasting cortisol, insulin and leptin in response to an 18-week low-fat diet ± exercise follow-up in obese men (n ˆ 10) and women (n ˆ 7) having initially undergone 15 weeks of drug therapy. state. However, a test meal of a given caloric content et al,18 who have found an increase in day long VAS seems to exert a similar in¯uence over these variables AUC for desire to eat and hunger after 2 and 8 weeks in the postprandial period once the reduced-obese of energy restriction and physical activity. Further- state is achieved. Furthermore, the inter-subject varia- more, our results show that these increased feelings of bility in the the changes of VAS variables in response appetite persist beyond 12 weeks, as demonstrated in to this program permitted us to investigate the con- the latter study, since our intervention lasted approxi- tribution of hormonal adaptations to weight loss to mately 33 weeks. These ®ndings are important since these variations. In this sense, it would seem that appetite feelings might dictate the quantity and the changes in appetite scores that occur during weight quality of the foods that will be prepared and con- loss are partly explained by changes in fasting plasma sumed during the day. Thus, it can easily be specu- cortisol. lated that individuals with increased appetite before The most consistent ®nding of this study is the the initiation of a meal would rather choose readily increase of baseline appetite across the intervention in accessible processed foods which generally have a both men and women. Indeed, as shown in Figure 1, high fat and sucrose content. Moreover, it is also the desire to eat, hunger and PFC were all increased possible that the amount of food prepared would be after phase 1 and to a further extent after phase 2. commensurate with the appetite scores. This is in These results are in accordance with those of Keim agreement with recently reported results which have International Journal of Obesity
  • 7. Weight loss and appetite E Doucet et al 912 shown that after an initial weight loss induced over 2 increase to a greater extent in some individuals than in months by an energy restricted diet, hunger as mea- others during weight loss, it would be expected that sured by the Dutch Eating Behaviour Questionnaire these particular individuals would lose less fat scores was a signi®cant predictor of weight regain because of the in¯uence that cortisol seems to exert over a 14 month period.28 Beyond these observations, over subjective feelings of hunger and satiety and it would have been expected that, after drug therapy, possibly on food intake. the low-fat diet±exercise follow-up would have at The recent discovery of the Ob gene product, least partly corrected for the increase in appetite leptin,31 has brought new insights into the regulation scores noted after weight loss since the exercise of energy balance. Even if this hormone does not prescription was of 72% and 52% of VO2 max for seem to be acutely affected by food intake,5,32 it has men and women, respectively,19 and that high-inten- been shown to ¯uctuate considerably with body sity exercise seems to reduce ad libitum energy intake weight variations5 and prolonged energy de®cit.33 in the postexercise period in lean healthy men.29 Since leptin has been shown to reduce food intake However, the fact that an increase in appetite scores in animals,8 it is also probable that it might affect was still observed during phase 2 is somewhat in energy balance in humans. Even if leptin levels do not agreement with the observation that the anorectic seem to be associated with hunger and desire to eat effect of strenuous physical exercise is not necessarily in obese women, be it in the fasting state or after observed in obese individuals.30 From this, it can be exposure to food,32 other results have demonstrated argued that the gender difference in exercise intensity that, in response to prolonged energy de®cit induced which was observed during phase 2 of this weight either by caloric restriction,16 or caloric restriction and loss±weight maintenance program probably did not aerobic activity,18 changes in hunger±satiety feelings affect appetite responses differently between men and were related to changes in leptin. Our results do not women. In this regard, it is also important to consider show as strong a relationship between changes in that a delay of at least 48 h elapsed between the last leptin and changes in VAS scores. However, our bout of exercise and VAS measurements, which might results are partly in accordance with those of Heini be suf®cient to lose a possible acute anorectic effect of et al,16 who reported that leptin seems to be a satiety exercise. hormone since fullness was signi®cantly associated Another issue which needs to be discussed is the with changes in leptin in the present study. fact that, despite a different weight loss, the increases The fact that in women a negative association was in appetite scores as measured by VAS scale were observed between changes in fasting plasma insulin quite similar between men and women. It should and changes in variables of VAS measured as AUC is however be kept in mind that no associations were in accordance with the idea that insulin might affect observed between changes in body weight and appetite-related variables15 and food intake9 by mod- changes in appetite-related variables. In this context, ulating the expression of neuropeptide Y.10 Results it is tempting to speculate that one of the reasons why from a decade ago have also emphasized the impor- women generally lose less body weight than do men tance of changes in blood glucose in regards to eating during weight loss programs is because comparable behavior.12,13 More recent results have shed some new metabolic adaptations to prevent further weight loss light on this issue since Heini et al;15 have demon- occur in women at a lesser amount of weight lost. This strated that changes in glucose and insulin seem to ®ts well with our results since we document an predict changes in appetite-related variables. Even if increase in appetite-related variables which is related our data do not provide statistical support to these to an increase in circulating plasma cortisol more latter results, it nevertheless appears that changes of particularly during phase 2. Despite a difference in VAS variables also seem to be associated with varia- changes of body weight and composition, the increase tions in fasting plasma glucose in women. in the main predictor of changes in appetite-related On the basis of our results, it would seem that the scores, ie cortisol levels in this case, was remarkably most consistent predictor of changes in appetite- similar between men and women. Hence, we can related scores, be it at baseline or in response to a speculate that a lesser weight loss in women than in test meal, is the change in fasting cortisolemia. men might trigger a similar increase in cortisol levels Indeed, as shown in Figure 2, an increase in fasting which is in turn associated to similar increases in cortisol seems to better predict an increase of fasting appetite-related scores more particularly when a resis- desire to eat and PFC when compared to changes in tance to further loss of fat is achieved. insulinemia or leptinemia. To our knowledge, this is It is also intriguing to observe a positive relation- the ®rst paper to report such ®ndings in humans ship between changes in PFC and changes in fat mass having undergone a weight loss intervention program. in men in response to phase 1. However, this observa- Convincing demonstrations of the effects of glucocor- tion does not necessarily contradict the main ®nding ticoids on food intake in animals have, however, been of this study. Indeed, it would seem that the increases reported.34,35 Whether or not these results can be in appetite scores which occurs during weight loss are transposed to humans remains unclear, but our results best predicted by increases in cortisol levels and not seem to support observations from the animal litera- by weight loss per se. In this context, if cortisol levels ture. It is however unclear as to why cortisol comes International Journal of Obesity
  • 8. Weight loss and appetite E Doucet et al 913 out as such a strong predictor of changes of VAS 8 Halaas JL, Gajiwala KS, Maffei M, Cohen SL, Chait BT, variables. Since glucorticoids are involved in glucose Rabinowitz D, Lallone RL, Burley SK, Friedman JM. Weight- reducing effects of the plasma protein encoded by the obese homeostasis, and that weight loss is accompanied by gene. Science 1995; 269: 543 ± 546. important changes in glucose metabolism, changes in 9 Schwartz MS, Figlewicz DP, Baskin DG, Woods SC, Porte D. cortisol might re¯ect an attempt at re-establishing Insulin in the brain: a hormonal regulator of energy balance. glucose homeostasis by increasing food intake. Note- Endocrinol Rev 1992; 13: 387 ± 414. worthy is the fact that an increase in hypothalamic± 10 Schwartz MW, Sipols AJ, Marks JL, Sanacora G, White JD, Scheurink A, Kahn SE, Baskin DG, Woods SC, Figlewicz DP, pituitary±adrenal axis activity, as indicated by an Porte D. Inhibition of hypothalamic neuropeptide Y gene increase in circulating plasma cortisol, might re¯ect expression by insulin. Endocrinology 1992; 130: 3608 ± 3616. an increase in the level of stress. Even if the role of 11 Wing RR, Klein R, Moss SE. Weight gain associated with stress in the development of obesity remains to be improved glycemic control in population-based sample of determined, there is some evidence to the effect that subjects with type I diabetes. Diabetes Care 1990; 13: 1106 ± 1109. stress can trigger episodes of feeding in animals36 and 12 Camp®eld LA, Smith FJ. Functional coupling between tran- that some animals display a considerable stress sient declines in blood glucose and feeding behavior: temporal response when food deprived.37 From these observa- relationships. Brain Res Bull 1986; 17: 427 ± 433. tions, it might be speculated that energy-restricted 13 Camp®eld LA, Smith FJ. Transient declines in blood glucose humans might respond similarly to a prolonged signal meal initiation. Int J Obes 1990; 14: 15 ± 31. 14 Weinsier RL, Neslon KM, Hensrud DD, Darnell BE, Hunter energy de®cit as do animals and, for undetermined GR, Schutz Y. Metabolic predictors of obesity. J Clin Invest reasons, increase their food intake to alleviate this 1995; 95: 980 ± 985. stressful status. 15 Heini AF, Kirk KA, Lara-Castro C, Weinsier RL. Relationship In summary, our results demonstrate that weight between hunger-satiety feelings and various metabolic param- loss is accompanied by an increase in appetite-related eters in women with obesity during controlled weight loss. Obes Res 1998; 6: 225 ± 230. variables in the fasting state. Moreover, based on our 16 Heini AF, Lara-Castro C, Kirk KA, Considine RV, Caro JF, results the most consistent predictor of these changes Weinsier RL. Association of leptin and hunger-satiety ratings seems to be changes in fasting plasma cortisol. More in obese women. Int J Obes 1998; 22: 1084 ± 1087. studies need to be performed to further clarify how 17 Raynaud E, Brun JF, Perez-Martin A, Sagnes C, Boularan cortisolemia is implicated in the control of energy AM, Fedou C, Mercier J. Serum leptin is associated with the perception of palatability during a standardized high-carbohy- balance in the reduced obese state and to what extent drate breakfast test. Clin Sci (Colch) 1999; 96: 343 ± 348. these changes are acutely affected by food intake. 18 Keim NL, Stern JS, Havel PJ. Relation between circulating Hence, nutritional strategies must be developed to leptin concentrations and appetite during a prolonged, prevent the overfeeding which might result from moderate energy de®cit in women. Am J Clin Nutr 1998; 68: these increased appetite scores, otherwise a very 794 ± 801. 19 Doucet E, Imbeault P, Almeras N, Tremblay A. Physical plausible scenario is weight regain as is most often activity and low-fat diet: is it enough to maintain weight seen in reduced obese individuals. stability in the reduced-obese individual following weight loss by drug therapy and energy restriction? Obes Res 1999; 7: 323 ± 333. 20 Khan MA, Herzog CA, St Peter JV, Hartley GG, Madlon-Kay Acknowledgements R, Dick CD, Asinger RW, Vessey JT. The prevalence of This research was supported by grants from Servier cardiac valvular insuf®ciency assessed by transthoracic echo-  Canada and FCAR Quebec. cardiography in obese patients treated with appetite-suppres- santdrugs. N Engl J Med 1998; 10: 713 ± 718. 21 Weissman NJ, Tighe JFJ, Gottdiener JS, Gwynne JT. An assessment of heart-valve abnormalities in obese patients References taking dexfen¯uramine, sustained-release dexfen¯uramine, or 1 Leaf A, Weber PC. A new era for science in nutrition. Am J placebo. Sustained-release dexfen¯uramine study group. Clin Nutr 1987; 45: 1048 ± 1053. N Engl J Med 1998; 10: 725 ± 732. 2 Blundell J, Burley VJ, Cotton JR, Lawton CL. Dietary fat and 22 Prud'homme D, Langlais M, Samson MP, Gallagher P, Tur- control of energy intake: evaluating the effects of fat on  cotte J, Tremblay A, Despres J-P. Lack of major cardiac meal size and postmeal satiety. Am J Clin Nutr 1993; 57: valvular abnormalities in asymptomathic obese men and 772S ± 778S. women following a 3-month fen¯uramine or dexfen¯uramine 3 Lawton CL, Burley VJ, Wales JK, Blundell JE. Dietary fat and treatment. Int J Obes 1999; 23: S175. appetite control in obese subjects: weak effects on satiety. Int J 23 Hill AJ, Blundell JE. The effects of a high-protein or high- Obes 1993; 17: 409 ± 416. carbohydrate meal on subjective motivation to eat and food 4 Aronne LJ, Mackintosh R, Rosenbaum M, Leibel RL, Hirsch preferences. Nutr Behav 1986; 3: 133 ± 144. J. Autonomic nervous system activity in weight gain and 24 Arvaniti K, Richard D, Tremblay A. Reproducibility of energy weight loss. Am J Physiol 1995; 269: R222 ± R225. and macronutrient intake and related substrate oxidation rates 5 Considine RV, Shina MK, Heiman ML, Kriauciunas A, in a buffet-type meal. Br J Nutr (in press). Stephens TW, Nyce MR, Ohanessian JP, Marco CC, McKee 25 Richterich R, Dauwwalder H. Zur bestimmung der plasma- LJ, Bauer TL, Caro JF. Serum immunoreactive-leptin concen- glukose-konzentration mit der hexokinase-glucose-6-phos- trations in normal-weight and obese subjects. N Engl J Med phat-deshydrogenase-methode. Schweiz Med Wochenschr 1996; 334: 292 ± 295. 1971; 101: 615 ± 618. 6 Goldstein DJ. Bene®cial health effects of modest weight loss. 26 Desbuquois B, Aurbach GD. Use of polyethylene glycol Int J Obes 1992; 16: 397 ± 415. to separate free and antibody-bound peptide hormones in 7 Bray GA. Food intake, sympathetic activity, and adrenal radioimmunoassays. J Clin Endocrinol Metab 1971; 37: steroids. Brain Res Bull 1993; 32: 537 ± 541. 732 ± 738. International Journal of Obesity
  • 9. Weight loss and appetite E Doucet et al 914 27 Couillard C, Mauriege P, Prud'homme D, Nadeau A, Trem- 33 Scholz GH, Englaro P, Thiele I, Scholz M, Klusmann T, blay A, Bouchard C, Despres JP. Plasma leptin concentrations: Kellner K, Rascher W, Blum WF. Dissociation of serum leptin gender differences and associations with metabolic risk concentration and body fat content during long term dietary factors for cardiovascular disease. Diabetologia 1997; 40: intervention in obese individuals. Horm Metab Res 1996; 28: 1178 ± 1184. 718 ± 723. 28 Pasman WJ, Saris WH, Westerterp-Plantenga MS. Predictors 34 Arvaniti K, Deshaies Y, Richard D. Effect of leptin on energy of weight maintenance. Obes Res 1999; 7: 43 ± 50. balance does not require the presence of intact adrenals. Am J 29 Imbeault P, Saint-Pierre S, Almeras N, Tremblay A. Acute Physiol 1998; 275: R105 ± 111. effects of exercise on energy intake and feeding behaviour. 35 Dagnault A, Deshais Y, Richard D. Effects of the Br J Nutr 1997; 77: 511 ± 521. 5-hydroxytryptamine agonist D, L-fen¯uramine on energy 30 Kissileff HR, Pi-Sunyer FX, Segal K, Meltzer S, Foelsch PA. balance in rats: in¯uence of gender. Int J Obes 1993; 17: Acute effects of exercise on food intake in obese and nonobese 367 ± 373. women. Am J Clin Nutr 1990; 52: 240 ± 245. 36 Burlet C. Stress and feeding behavior. Ann Endocrinol 1988; 31 Zhang Y, Proenca R, Maffei M, Barone M, Leopold L, 49: 141 ± 145. Friedman JM. Positional cloning of the mouse obese gene 37 Timofeeva E, Richard D. Functional activation of and its human homologue. Nature 1994; 372: 425 ± 432. CRH neurons and expression of the genes encoding 32 Karhunen L, Haffner S, Lappalainen R, Turpeinen A, Mietti- CRH and its receptors in food-deprived lean ( Faa?) and nen H, Uusitupa M. Serum leptin and short-term regulation of obese ( faafa) Zucker rats. Neuroendocrinology 1997; 66: eating in obese women. Clin Sci 1997; 92: 573 ± 578. 327 ± 340. Appendix A Composition of the breakfast meal test in men and women Foods Weight (g) Proteins (g) CHO (g) Fat (g) Energy kJ (kcal) Wholewheat bread 55 6.9 31.2 1.9 712.(170) Smooth peanut butter 17 4.3 3.2 8.6 448.(107) Strawberry jam (Kraft) 20 0.1 14 0 234.(56) Mozzarella cheese, 17% m.f. 50 13.7 1.6 8.6 582.(139) Butter 10 0.1 0 8.1 306.(73) Orange juice 150 1 16.2 0.1 293.(70) Milk, 2% m.f.a 200 6.7 9.6 3.8 414.(99) Total women 302 g 26.1 g 66.2 g 27.3 g 2575.(615) Total men 502 g 32.8 g 75.8 g 31.1 g 2989.(715) a Milk was only included in the test meal for men. m.f. ˆ milk fat. International Journal of Obesity