SlideShare uma empresa Scribd logo
1 de 6
Baixar para ler offline
PHYSICAL REVIEW B 72, 184428 ͑2005͒

Effect of dipolar interaction observed in iron-based nanoparticles
J. M. Vargas,1,2,* W. C. Nunes,2 L. M. Socolovsky,2 M. Knobel,2 and D. Zanchet1
1Laboratório

Nacional de Luz Síncrotron, Giuseppe M. Scolfaro 10000, Campinas (SP) 13084-971, Brazil
de Física “Gleb Wataghin”, Universidade Estadual de Campinas, Campinas (SP) 13083-970 Brazil
͑Received 1 April 2005; revised manuscript received 18 August 2005; published 23 November 2005͒

2Instituto

Spherical magnetic nanoparticles with narrow size distribution and organic capping were diluted in paraffin
with different concentrations to verify the role of dipolar interactions on the macroscopic magnetic behavior.
Increasing concentration of magnetic nanoparticles leads to higher blocking temperatures. The experimental
data were analyzed by means of a recently proposed model that takes into account magnetic interactions of
dipolar origin, and an excellent agreement was found. Considering the magnetic interaction among particles it
was possible to obtain the real magnetic moment and estimate structural parameters that are consistent with the
ones obtained by small angle x-ray scattering and transmission electron microscopy.
DOI: 10.1103/PhysRevB.72.184428

PACS number͑s͒: 75.50.Tt, 75.20.Ϫg, 75.75.ϩa

I. INTRODUCTION

A superparamagnetic system is composed by magnetic
monodomain nanoparticles whose atomic magnetic moments
rigidly align through exchange interaction. All the individual
magnetic moments add to form a magnetic supermoment,
usually of the order of thousands of Bohr magnetons ͑␮B͒.
The canonical description of superparamagnetism, following
the Langevin formalism, considers a negligible anisotropy
for each particle and neglects the effect of interparticle interactions, which can manifest through exchange, indirect exchange, Ruderman-Kittel-Kasuya-Yosida ͑RKKY͒, or even
dipole-dipole interactions.1–3
Although many nanostructured systems ͑i.e., systems with
particle sizes of the order of nanometers͒ have been reported
as superparamagnetic, a lack of agreement is commonly observed between experimental data and the standard superparamagnetic theory. These differences are usually ascribed
to the intrinsic particle size distribution, anisotropies of different origins, and interactions among magnetic particles.
One significant difference appears when particle size distribution functions obtained from apparently good fits performed using a weighted sum of Langevin functions are
compared to the ones obtained from direct structural data,
such as transmission electron microscopy ͑TEM͒ images.4,5
Besides the lack of agreement, usually the fitted mean magnetic moment strongly increases with increasing temperature,
a fact that confirms the spurious nature of the obtained
parameters.4–6 Such unusual behavior has been also observed
in antiferromagnetic particles, and an alternative theoretical
model based on the existence of a thermally activated surface
net magnetic moment has been recently proposed to explain
such a trend in those nanoparticles, but it remains
controversial.7,8
Extensive experimental and theoretical works agree that
the interaction among magnetic particles play a fundamental
role in the magnetic behavior of granular systems.8–14 However, several inconsistencies have been discussed since the
late 1980s, trying to conciliate theory and different experimental data. For instance, in the limit of weak interactions,
an increase of the blocking temperature with particle density
1098-0121/2005/72͑18͒/184428͑6͒/$23.00

has been observed in some experiments,9,10 but other results
show the opposite trend.11 For high density particle systems,
the picture is more complex since the blocking process of
each nanoparticle is highly dependent on its neighborhood.
The observation of properties resembling spin glasses has
suggested the existence of a spin glasslike state or magnetic
order in such systems. Nonetheless, most results have also
been explained by progressive blocking of independent particles, leading to an intensive debate in the last years.12–16
In the effort to better understand this complex issue, a
recent study took into account the dipolar interactions by
introducing a phenomenological temperature, T*, in the argument of the Langevin function, which has been known as the
T* model.4 This assumption considers that dipolar interactions tend to increase the orientational disorder of the magnetic moments, so that thermal agitation would be somewhat
“enhanced” owing to dipolar interactions.
Undoubtedly, a major challenge to better understand the
magnetic interactions in nanosystems and test the existing
models is to produce good quality samples. In fact, the limited knowledge of nanoparticle shape, composition gradient,
size distribution, or even touching nanoparticles can prevent
having an accurate picture of the whole system. We have
contributed to overcoming this problem by producing nanosized iron-based nanoparticles of approximately spherical
shape and narrow size distribution by colloidal methods. The
presence of organic, insulating capping on the surface of the
magnetic particles prevents the formation of agglomerates or
chains, leading to pure dipolar interactions. Furthermore, the
strength of the dipolar interaction among particles can be
tuned by diluting the same sample in different amounts of
paraffin, allowing one to systematically study just the effect
of dipolar interactions, avoiding variations in chemical composition, size distribution, and magnetic anisotropy among
samples.
II. EXPERIMENTAL PROCEDURE AND SAMPLES

Magnetic iron-based nanoparticles were prepared by colloidal synthesis ͑see further details in Ref. 17͒ and wellcharacterized by TEM and small angle x-ray scattering

184428-1

©2005 The American Physical Society
PHYSICAL REVIEW B 72, 184428 ͑2005͒

VARGAS et al.

FIG. 1. A TEM image of the nanoparticle sample used in this
work. The insets show the SAXS curve of the same sample ͑the fit
is represented by the white line͒ and the distribution of sizes obtained from both techniques.

͑SAXS͒. The results of both analyses are shown in Fig. 1.
The TEM image shows spherical nanoparticles with mean
diameter, dav = 7.1 nm and very narrow size distribution ͑␴
= 0.08͒. This result is corroborated by the SAXS data of the
same sample, which shows an oscillatory behavior typical of
narrow size distribution spherical particles ͑inset of Fig. 1͒.
SAXS data treatment was done using the GNOM program,18
for which a sphere distribution was assumed. The SAXS
analysis gave dav = 7.3 nm, similar to TEM, but a larger size
distribution ͑␴ = 0.17͒. The distribution of particle sizes obtained by TEM and SAXS are shown in the inset of Fig. 1. It
is important to point out that the difference found between
the size distributions obtained by TEM and SAXS is not
surprising for this kind of sample. It is known that during the
solvent evaporation on the TEM grid the nanoparticles selfassemble forming large ordered regions of particles of similar sizes, excluding the smaller ones to the edges.19 This may
underestimate the TEM size distribution width. In this work
we have used the size distribution obtained by SAXS since it
gives an average signal and we consider that it better describes the actual system. In the following analysis, the
SAXS distribution of particle sizes has been converted to a
volume distribution and fitted with a Gaussian function,
given a volume distribution of ␴V = 0.38.
The as-synthesized nanoparticles are mainly composed by
amorphous Fe and capped by oleyl-sarcosine molecules,
which avoid agglomeration. The colloidal solution can be
precipitated using methanol or ethanol and easily redispersed
in toluene or Decalin. The slow oxidation process leads to a
disordered Fe oxide, whose majority magnetic phase locally
resembles magnetite ͑Fe3O4͒, as identified by Mössbauer
spectroscopy.17 To evaluate the dipolar magnetic interaction

FIG. 2. The ZFC-FC curves as a function of nanoparticle concentration ͑H = 20 Oe͒. Note that the blocking temperature clearly
shifts to higher values when nanoparticle concentration increases.
The irreversibility region in the FC curves shows qualitatively the
increase of the dipolar interaction for higher nanoparticle
concentration.

in this system, some quantity of the same batch of the colloidal solution was precipitated ͑powder sample͒ or diluted
in paraffin, in different concentrations. This strategy was
adopted to minimize little variations that may occur when
using different batches of samples or due to the oxidation
process. The dilutions used in this work were 0.05, 0.5, 5,
and 45 % mass of colloid/mass of paraffin, hereinafter
named C005, C05, C5, and C45, respectively. However, it is
important to point out that the absolute values are just indicative of the degree of concentration due to the intrinsic large
errors in the determination of the actual magnetic nanoparticle core mass.
Zero-field-cooled ͑ZFC͒ and field-cooled ͑FC͒ magnetization and magnetization vs applied field ͑M vs H͒ measurements ͑magnetization loops͒ were performed in a commercial superconducting quantum interference device ͑SQUID͒
magnetometer ͑quantum design MPMS XL7͒. The diamagnetic contribution of the paraffin was subtracted from the
magnetization data and the results were presented in the reduced form for all samples, i.e., M / M S vs H, to avoid misleading results due to the uncertainties in the nanoparticle
mass determination.
III. RESULTS AND DISCUSSION
A. Magnetic properties

ZFC and FC curves as functions of particle concentration
are shown in Fig. 2 ͑H = 20 Oe͒. As can be clearly seen, for
increasing particle concentration the splitting points between
ZFC and FC curves as well as the maxima of the ZFC curves
shift to higher temperatures, indicating an increase in the
blocking temperature, TB.20 A similar trend was previously
observed by Dormann et al., Zysler et al.,21,22 and in Monte
Carlo simulations,23,24 for example. Such results qualitatively

184428-2
PHYSICAL REVIEW B 72, 184428 ͑2005͒

EFFECT OF DIPOLAR INTERACTION OBSERVED IN…

agree with the Dormann-Bessais-Fiorani model.9 Also, the
FC magnetization curvature in the irreversibility region ͑below blocking temperature͒ qualitatively marks the strength of
interparticle interaction, diminishing its relative height with
respect to the maximum of the ZFC curve as the concentration increases. It is worth mentioning that the overall shape
of the ZFC curves for all samples is similar, indicating that
no percolation occurs among particles, so reassuring that the
magnetic properties can be, in principle, described in the
framework of the superparamagnetic model. In some systems composed by nanoparticles, when the volume concentration of the magnetic element reaches 17–25 %, a clear
distinctive shape of the ZFC curve appears due to direct contact among magnetic nanoparticles.25,26
It is known that the ZFC curve is sensitive to the distribution of activation energy ͑25 kTB͒ that can be easily calculated considering a system of noninteracting particles with
x volume concentration of particles.20 For a single particle of
volume, V, the magnetization, M, under low magnetic field,
H, is expressed as M = ͑M core͒2 VH / kT in the superparamagS
netic region ͑T Ͼ TB͒, and M = ͑M core͒2 H / 3 K in the blocked
S
region ͑T Ͻ TB͒, respectively ͑T is the system temperature,
M core is the saturation magnetization of the nanoparticle
S
magnetic core, k is the Boltzmann constant, and K is the
anisotropy constant͒. Therefore, for a noninteracting fine particle system the total magnetization can be written as27
M ZFC͑H,T͒ M coreH
= S
MS
3K
+

͵
͵
ϱ

f͑V͒dV

Vb͑T͒

M coreH
S
3kT

Vb͑T͒

Vf͑V͒dV,

͑1͒

0

where Vb͑T͒ = 25kT / K, and f͑V͒ is the particle volume distribution, and M S is the sample saturation magnetization, ͑x
is the magnetic core volume fraction͒. The first term in Eq.
͑1͒ describes the contribution of the particles in the blocked
state. Its relative contribution drops with increasing temperature, as the number of the blocked particles decreases. The
f͑V͒ can be related to the distribution of blocking temperature by the linear expression 25kTB = KV. Therefore, one can
obtain K by fitting the ZFC curves using ␴V = 0.38 obtained
by SAXS, and the M S value obtained from the M vs H measured at low temperatures ͑keeping M core and K as free fitting
S
parameters͒. Figure 3 shows the reduced curve for the most
diluted sample ͑C005͒ and the corresponding fit. From this
analysis, K = 3.6ϫ 105 erg/ cm3 and M core = 490 emu/ cm3. As
S
can be seen in Fig. 3, the superparamagnetic model is a good
approach to describe the C005 sample behavior, suggesting
that the possibility of particles agglomeration is not significant in that sample. In addition, this result confirms the morphological information derived from SAXS.
The coercive field, HC, obtained from the M / M S vs H
curves measured at different temperatures is shown in Fig. 4
͑at temperatures below the blocking one͒. The coercive field
temperature behavior of systems of identical noninteracting
particles with random anisotropy axes follows the wellknown relation,28

FIG. 3. The zero-field cooled curve of a C005 sample measured
with H = 20 Oe. The line is the best fit of Eq. ͑1͒ to the experimental
data ͑symbol͒ using the SAXS distribution and M core and K as free
S
parameters.

Hc = 0.96

K
͓1 − ͑T/TB͒1/2͔.
M core
S

͑2͒

It can be inferred from Fig. 4 that the HC behavior of the
samples C5 and C45 can be described by Eq. ͑2͒ at least in
the low temperature range, giving K / M core = 670 Oe and 636
S
Oe, respectively. This simple approximation, however, does
not hold reasonably for the powder sample. The decrease of
the HC value for sample C45 compared to C5 is in agreement
with the demagnetizing role played by the dipolar interaction
as simulated by Kechrakos and Trohidou.29 The Hc vs T
trends also confirm that the only parameter change in our
samples is the particle concentration. Using the K value obtained from the ZFC analysis of C005 sample, we find

FIG. 4. HC vs T0.5 obtained for the C5, C45, and powder
samples. Similar behavior of samples C5 and C45 can be seen. In
addition, these samples present a linear dependence with T0.5 in the
low temperature range. The lines serve as a guide to the eyes.

184428-3
PHYSICAL REVIEW B 72, 184428 ͑2005͒

VARGAS et al.

is not simply a fitting parameter. It can be related to the rms
dipolar energy ␧D,
␧D = kT* = ␣ ␮2/D3 ,

͑4͒

where ␣ is a constant ͑derived from the sum of all dipolar
energy contributions͒, and D is the average interparticle
distance.4 This is the main assumption of the T* model that
considers that a dipolar field exerts a disordering and random
torque to the magnetic moments of the particles, “decreasing” the ordering effect played by the applied magnetic field
͑similar to the effect of temperature͒.
Using the condition ND3 = 1 and M S = N␮, T* can be calculated as
FIG. 5. The M vs H curves of C5, C45 and powder samples
pointing out the effect of the dipolar interaction. The inset shows
the C5 data as a function of temperature and the corresponding fits
using the conventional superparamagnetic model showing a nice
agreement but spurious ␮ values ͑these values correspond to the ␮a
in the T* model͒.

M core = 537 emu/ cm3 and M core = 564 emu/ cm3 for samples
S
S
C5 and C45. Considering the approximations involved in
both fits, the results are in very good agreement with the
ZFC analysis.
M / M S vs H curves have been measured at several temperatures for all samples. The loops of sample C005 and C05
were strongly influenced by paraffin diamagnetism, which
screens the high-field region of the measurements, and therefore those results will not be considered in the following
analysis. Figure 5 shows the M / M S vs H of C5, C45, and
powder samples measured at 300 K showing the effect of
dilution. The inset shows the evolution of M / M S vs H of C5
as a function of temperature. It is important to mention that
the universal curve M / M S vs H / T, expected in a canonical
superparamagnetic system when plotting M vs H curves
taken at different temperatures, cannot be obtained.30 This
lack of agreement is more pronounced for the powder
sample, as expected due to stronger interparticle interactions.

T* =

␮a =

͵ ͩ
ϱ

0

␮L

ͪ

␮H
f͑␮͒d␮ ,
k͑T + T*͒

1

͑3͒

where N is the number of particles per unit volume, f͑␮͒ is
the distribution of magnetic moments that is determined
from the experimental volume distribution ͑␮ = M coreV͒, and
S
L is the Langevin function. It is important to remark that T*

ͩ ͪ

*␮.

Na = 1 +

T
1+
T

T*
N,
T

͑6͒

and, as a consequence,

͵ ͩ ͪ
ϱ

M͑H,T͒ = Na

␮ aL

0

␮ aH
f͑␮a͒d␮a .
kT

͑7͒

The only two fitting parameters are Na and ␮a for each
temperature and Na is assumed to be independent of temperature, since f͑ua͒ was obtained from SAXS. In this work
we used the reduced form of Eq. ͑7͒, reducing the fitting
parameters to a single parameter, ␮a, for each temperature:

͵ ͩ ͪ
͵
ϱ

M͑H,T͒
=
MS

To study in more detail the effect of interparticle interactions as function of particle concentration, we have employed the T* model.4 In such a model, the effect of the
dipolar interaction is introduced by means of a fictitious temperature, T*, which is added to the actual temperature T in
the denominator of the Langevin function argument. This
phenomenological theory can be used to relate the experimental magnetization M of a set of interacting nanoparticles
to their actual magnetic moment ␮,

͑5͒

Equation ͑3͒ can be rewritten as a weighted sum of standard Langevin functions, but considering instead an apparent
magnetic moment ␮a and an apparent particle density, Na,
given by,4

B. Influence of the dipolar interaction

M͑H,T͒ = N

␣ ␮2 ␣
␣ M2
S
2
.
3 = N ␮ =
kD
k
k N

␮ aL

0

ϱ

␮ aH
f͑␮a͒d␮a
kT
.

͑8͒

␮a f͑␮a͒d␮a

0

The M / M S vs H curves fits for each temperature were
very good in all cases ͑see inset in Fig. 5 for the analysis of
C5 sample͒ and the inset of Fig. 6 shows the ␮a as a function
of temperature for the three considered samples. It can be
inferred from Fig. 6 an increase of ␮a with the temperature
up to a maximum value, depending on sample concentration.
Since all samples have the same magnetic anisotropy, this
reinforces the hypothesis of the existence of a strict relationship between the dipolar interaction and the anomalous thermal behavior of ␮a, commonly observed in single domain
particle systems.4
The only required parameter to calculate the real magnetic
moment ␮ from ␮a is T* ͓see Eq. ͑6͔͒. The T* can be derived
from the low-field susceptibility of an interacting superparamagnetic system within the framework of this model,

184428-4
PHYSICAL REVIEW B 72, 184428 ͑2005͒

EFFECT OF DIPOLAR INTERACTION OBSERVED IN…

FIG. 6. ␮a and ␮ values as a function of temperature for C5 ͑␮
taken constant͒. The inset shows the ␮a values for the three
samples.

␹=

N␮2
,
3k͑T + T*͒

͑9͒

which, for a system with size distribution, can be expressed
as4

ͩ ͪ

␳
T
= 3kN
+ 3␣ = AT + C,
␹
M2
S

͑10͒

where ␳ = ͗␮2͘ / ͗␮͘2 = ͗␮2͘ / ͗␮a͘2, the brackets indicating the
a
average over the values of the distribution of magnetic moments ͑see details in Ref. 4͒. T* can now be readily obtained
from the ratio C / A ͓͑see Eqs. ͑5͒ and ͑10͔͒. The curve
␳ / ␹ vs T can be independently obtained from different
routes, such as the high-temperature region of the ZFC-FC
curves, i.e., above blocking temperature, or from the lowfield region of the anhysteretic curves ͑average of two
branches of a hysteresis loop31͒. In the present case, the ␹͑T͒
values were obtained of the linear region of the anhysteretic
magnetization curves. The fit was performed in the linear
region of the normalized form of Eq. ͑10͒, ␳ M S / ␹ vs T, using M S ͑in emu͒ at 20 K, and the results are presented in
Table I and Fig. 7. It is interesting to note in Fig. 7 that the
angular coefficient, M SA, which is equal to 3k / ␮, is similar
to the three samples as it should be expected since the only
variable parameter among samples is the concentration. It is
important to point out, however, that T* may be underestimated by taking the normalization, M S, at 20 K, but the
TABLE I. The values of M SA and M SC derived from the fit of
␳ M S / ␹ vs T using Eq. ͑10͒ and the resulting values of T*. The ␳
value obtained from the SAXS volume distribution was 1.13.

FIG. 7. The ␳ M S / ␹ vs T graphic obtained from the linear region
of the magnetization curves ͑magnetization under low field H͒ for
the three samples. The solid lines are the best fits done to derive the
T* values ͑see the text͒.

correct trend among samples is still obtained.
Figure 6 shows the real magnetic moment ␮ obtained
from ␮a and T* ͑considering M S constant with temperature͒.
To corroborate the analysis, the temperature dependence of
the ␮a calculated by using the T* and ␮ are shown by lines in
the inset of Fig. 6, showing a good agreement with the results obtained via the fit of M / H vs H curves at different
temperatures.
We have also tested different approaches to fit the
M / M S x H curves, for example, considering T* and ␮ as
fitting parameters, where curves taken at different temperatures are fitted simultaneously. The results and goodness of
the fits were similar to the previous case. We have also tested
to leave the moment distribution width as a free parameter,
and it converged to the value derived from the SAXS analysis for all samples, further validating the analysis.
It is worth emphasizing that good fits using a properly
weighted set of Langevin functions are not surprising, but
often the obtained size distribution parameters are quite different from those obtained from direct structural
measurements.4–6,32 However, considering the T* model applied in the present work, the fitting parameters agree rather
well with structural data. One can estimate the mean magnetic moment, ͗␮͘ = M coreV, by considering spherical parS
ticles, dav = 7.3 nm, and M S = 537 emu/ cm3 ͑calculated from
the coercivity measurements for sample C5͒. This procedure
leads to a value of the magnetic moment, ͗␮͘ = 11802 ␮B,
which is rather close to the values obtained from the T*
model.

Sample

M SA

M SC

T* ͑K͒

IV. CONCLUSION

C5
C45
Powder

3.3
3.5
3.2

173
266
622

51.7
76.1
196.1

In this work, spherical magnetic nanoparticles with narrow size distribution and organic capping were diluted in
paraffin with different concentrations to tune interparticle
dipole-dipole interactions. We clearly demonstrated that a
184428-5
PHYSICAL REVIEW B 72, 184428 ͑2005͒

VARGAS et al.

shift of the blocking temperature with increasing concentrations is observed when solely dipolar interactions are
strengthened. Morover, to the best of our knowledge, this is
the first experimental test of the T* model using a wellbehaved system composed by truly isolated spherical nanoparticles with narrow size distribution. Using this model, we
were able to derive the correct trends among samples and the
real magnetic moment, which was in good agreement with
ZFC-FC and Hc analysis. Also, different fit routes were
tested, and all of them converged to very similar values, very
close to those obtained from structural data. Such data and
their analysis point to an adequacy of such a phenomenologi-

*Present address: Centro Atómico Bariloche, Avenue Bustillo 9.
500͑R8402AGP͒ San Carlos de Bariloche ͑RN͒, Argentina.
1 L. Néel, Ann. Geophys. ͑C.N.R.S.͒ 5, 99 ͑1949͒.
2
X. Battle and A. Labarta, J. Phys. D 35, R15 ͑2002͒.
3 R. Skomski, J. Phys.: Condens. Matter 15, R841 ͑2003͒.
4
P. Allia, M. Coisson, P. Tiberto, F. Vinai, M. Knobel, M. A. Novak, and W. C. Nunes, Phys. Rev. B 64, 144420 ͑2001͒.
5
A. L. Brandl, J. C. Denardin, L. M. Socolovsky, M. Knobel, and
P. Allia, J. Magn. Magn. Mater. 272-276, 1526 ͑2004͒.
6 H. Mamiya, I. Nakatani, T. Furubayashi, and M. Ohnuma, Trans.
Magn. Soc. Jpn. 2, 36 ͑2002͒.
7 S. Mørup and C. Frandsen, Phys. Rev. Lett. 92, 217201 ͑2004͒;N.
J. O. Silva, L. D. Carlos, and V. S. Amaral, ibid. 94, 039707
͑2005͒;S. Morup and C. Frandsen, ibid. 94, 039708 ͑2005͒;A.
H. MacDonald and C. M. Canali, ibid. 94, 089701 ͑2005͒;S.
Morup and C. Frandsen, ibid. 94, 089702 ͑2005͒.
8 M. Knobel, W. C. Nunes, A. L. Brandl, J. M. Vargas, L. M.
Socolovsky, and D. Zanchet, Physica B 354, 80 ͑2004͒.
9 J. L. Dormann, L. Bessais, and D. Fiorani, J. Phys. C 21, 2015
͑1988͒;J. L. Dormann, D. Fiorani, and E. Tronc, J. Magn. Magn.
Mater. 202, 251 ͑1999͒.
10 W. Luo, S. R. Nagel, T. F. Rosenbaum, and R. E. Rosensweig,
Phys. Rev. Lett. 67, 2721 ͑1991͒.
11 S. Mørup and E. Tronc, Phys. Rev. Lett. 72, 3278 ͑1994͒.
12 Y. Sun, M. B. Salamon, K. Garnier, and R. S. Averback, Phys.
Rev. Lett. 91, 167206 ͑2003͒;M. Sasaki, P. E. Jönsson, H.
Takayama, and P. Nordblad, ibid. 93, 139701 ͑2004͒.
13
M. F. Hansen et al., J. Phys.: Condens. Matter 14, 4901 ͑2002͒.
14 W. Kleemann, O. Petracic, C. Binek, G. N. Kakazei, Y. G.
Pogorelov, J. B. Sousa, O. S. Cardos, and P. P. Freitas, Phys.
Rev. B 63, 134423 ͑2001͒.
15 E. P. Wohlfarth, Physica B & C 86, 852 ͑1977͒.
16
S. Chakraverty, M. Bandyopadhyay, S. Chatterjee, S. Dattagupta,

cal model to explain the trends of the intricate macroscopic
magnetic behavior of a superparamagnetic system with the
presence of dipolar interactions among magnetic particles.
However, further analysis should be carried out to further
corroborate quantitatively the results derived from this
model.
ACKNOWLEDGMENT

Brazilian funding agencies FAPESP, CAPES, CNPq, and
Brazilian Synchrotron Light Laboratory ͑SAXS beamline
and LME͒ are acknowledged for their support.

A. Frydman, S. Sengupta, and P. A. Sreeram, Phys. Rev. B 71,
054401 ͑2005͒.
17 J. M. Vargas, L. M. Socolovsky, G. F. Goya, M. Knobel, and D.
Zanchet, IEEE Trans. Magn. 39, 2681 ͑2003͒.
18 D. I. Svergun, J. Appl. Crystallogr. 25, 495 ͑1992͒.
19
P. C. Ohara, D. V. Leff, J. R. Heath, and W. M. Gelbart, Phys.
Rev. Lett. 75, 3466 ͑1995͒.
20
J. C. Denardin, A. L. Brandl, M. Knobel, P. Panissod, A. B.
Pakhomov, H. Liu, and X. X. Zhang, Phys. Rev. B 65, 64422
͑2002͒.
21 J. L. Dormann, D. Fiorani, and E. Tronc, Adv. Chem. Phys., 98,
283 ͑1997͒.
22
R. D. Zysler, C. A. Ramos, E. De Biasi, H. Romero, A. Ortega,
and D. Fiorani, J. Magn. Magn. Mater. 221, 37 ͑2000͒.
23
J. García-Otero, M. Porto, J. Rivas, and A. Bunde, Phys. Rev.
Lett. 84, 167 ͑2000͒.
24 M. Bahiana, J. P. Pereira Nunes, D. Altbir, P. Vargas, and M.
Knobel, J. Magn. Magn. Mater. 281, 372 ͑2004͒.
25 B. V. B. Sarkissian, J. Phys.: Condens. Matter 208, 2191 ͑1981͒.
26
L. M. Socolovsky, F. H. Sánchez, and P. H. Shingu, Hyperfine
Interact. 133, 47 ͑2001͒.
27 T. Bitoh, K. Ohba, M. Takamatsu, T. Shirane, and S. Chikazawa,
J. Phys. Soc. Jpn. 64, 1305 ͑1995͒.
28 E. F. Kneller and F. E. Luborsky, J. Appl. Phys. 34, 656 ͑1963͒.
29 D. Kechrakos and K. N. Trohidou, Phys. Rev. B 58, 12169
͑1998͒.
30 I. S. Jacobs and C. P. Bean, in Magnetism, edited by G. T. Rado
and H. Suhl ͑New York, Academic Press, 1963͒, Vol. III,
pp.271-350.
31 P. Allia, M. Coisson, M. Knobel, P. Tiberto, and F. Vinai, Phys.
Rev. B 60, 17 12207 ͑1999͒.
32 Q. A. Pankhurst, D. H. Ucko, L. Fernández Barquín, and R.
García Calderón, J. Magn. Magn. Mater. 266, 131 ͑2003͒.

184428-6

Mais conteúdo relacionado

Mais procurados

Presentation at icotom17 dresden 20140826
Presentation at icotom17 dresden 20140826Presentation at icotom17 dresden 20140826
Presentation at icotom17 dresden 20140826Xiaodong Guo
 
M.Perez R.Jacobs poster 2015
M.Perez R.Jacobs poster 2015M.Perez R.Jacobs poster 2015
M.Perez R.Jacobs poster 2015Roxanne Jacobs
 
RADTEC96_final_Corr
RADTEC96_final_CorrRADTEC96_final_Corr
RADTEC96_final_CorrPatrick Yang
 
RELATIVISTIC MEAN FIELD STUDY OF SM ISOTOPES WITH FTBCS APPROACH
RELATIVISTIC MEAN FIELD STUDY OF SM ISOTOPES WITH FTBCS APPROACHRELATIVISTIC MEAN FIELD STUDY OF SM ISOTOPES WITH FTBCS APPROACH
RELATIVISTIC MEAN FIELD STUDY OF SM ISOTOPES WITH FTBCS APPROACHijrap
 
Gel matrix dependence on the dose response properties and diffusion phenomena...
Gel matrix dependence on the dose response properties and diffusion phenomena...Gel matrix dependence on the dose response properties and diffusion phenomena...
Gel matrix dependence on the dose response properties and diffusion phenomena...inventionjournals
 
International Journal of Engineering and Science Invention (IJESI)
International Journal of Engineering and Science Invention (IJESI)International Journal of Engineering and Science Invention (IJESI)
International Journal of Engineering and Science Invention (IJESI)inventionjournals
 
45 Evidence for a narrow N* (1685) resonance in quasifree Compton scattering ...
45 Evidence for a narrow N* (1685) resonance in quasifree Compton scattering ...45 Evidence for a narrow N* (1685) resonance in quasifree Compton scattering ...
45 Evidence for a narrow N* (1685) resonance in quasifree Compton scattering ...Cristian Randieri PhD
 

Mais procurados (8)

Presentation at icotom17 dresden 20140826
Presentation at icotom17 dresden 20140826Presentation at icotom17 dresden 20140826
Presentation at icotom17 dresden 20140826
 
M.Perez R.Jacobs poster 2015
M.Perez R.Jacobs poster 2015M.Perez R.Jacobs poster 2015
M.Perez R.Jacobs poster 2015
 
RADTEC96_final_Corr
RADTEC96_final_CorrRADTEC96_final_Corr
RADTEC96_final_Corr
 
2012_JAP_v112_p043911
2012_JAP_v112_p0439112012_JAP_v112_p043911
2012_JAP_v112_p043911
 
RELATIVISTIC MEAN FIELD STUDY OF SM ISOTOPES WITH FTBCS APPROACH
RELATIVISTIC MEAN FIELD STUDY OF SM ISOTOPES WITH FTBCS APPROACHRELATIVISTIC MEAN FIELD STUDY OF SM ISOTOPES WITH FTBCS APPROACH
RELATIVISTIC MEAN FIELD STUDY OF SM ISOTOPES WITH FTBCS APPROACH
 
Gel matrix dependence on the dose response properties and diffusion phenomena...
Gel matrix dependence on the dose response properties and diffusion phenomena...Gel matrix dependence on the dose response properties and diffusion phenomena...
Gel matrix dependence on the dose response properties and diffusion phenomena...
 
International Journal of Engineering and Science Invention (IJESI)
International Journal of Engineering and Science Invention (IJESI)International Journal of Engineering and Science Invention (IJESI)
International Journal of Engineering and Science Invention (IJESI)
 
45 Evidence for a narrow N* (1685) resonance in quasifree Compton scattering ...
45 Evidence for a narrow N* (1685) resonance in quasifree Compton scattering ...45 Evidence for a narrow N* (1685) resonance in quasifree Compton scattering ...
45 Evidence for a narrow N* (1685) resonance in quasifree Compton scattering ...
 

Destaque

2014-1 computer algorithm w07 notes
2014-1 computer algorithm w07 notes2014-1 computer algorithm w07 notes
2014-1 computer algorithm w07 notesDongseo University
 
走 史深_~圆明_
走  史深_~圆明_走  史深_~圆明_
走 史深_~圆明_psjlew
 
2010 national-geographic
2010 national-geographic2010 national-geographic
2010 national-geographicpsjlew
 
Approved maintenance organisation ofpl
Approved maintenance organisation ofplApproved maintenance organisation ofpl
Approved maintenance organisation ofplqcorientflights
 
一生受用不盡的經驗
一生受用不盡的經驗一生受用不盡的經驗
一生受用不盡的經驗psjlew
 
鼎藝千秋 3
鼎藝千秋 3鼎藝千秋 3
鼎藝千秋 3psjlew
 
VOCABVLA CAPITVLI II
VOCABVLA CAPITVLI IIVOCABVLA CAPITVLI II
VOCABVLA CAPITVLI IIpluissanpedro
 
高銘和喜馬拉雅山攝影展
高銘和喜馬拉雅山攝影展高銘和喜馬拉雅山攝影展
高銘和喜馬拉雅山攝影展psjlew
 
Week 2: Algorithmic Game Theory Notes
Week 2: Algorithmic Game Theory NotesWeek 2: Algorithmic Game Theory Notes
Week 2: Algorithmic Game Theory NotesDongseo University
 
Week 3: Algorithmic Game Theory Notes
Week 3: Algorithmic Game Theory NotesWeek 3: Algorithmic Game Theory Notes
Week 3: Algorithmic Game Theory NotesDongseo University
 
In honor of 9/11
In honor of 9/11In honor of 9/11
In honor of 9/11JMMika
 
Tlaxcalteca and affiliated tribes of texas 2
Tlaxcalteca and affiliated tribes of texas 2Tlaxcalteca and affiliated tribes of texas 2
Tlaxcalteca and affiliated tribes of texas 2TlaxcaltecaTed
 
2014-1 computer algorithm w2 notes
2014-1 computer algorithm w2 notes2014-1 computer algorithm w2 notes
2014-1 computer algorithm w2 notesDongseo University
 
The wiseoldman
The wiseoldmanThe wiseoldman
The wiseoldmanpsjlew
 
2014-1 computer algorithm w06 notes
2014-1 computer algorithm w06 notes2014-1 computer algorithm w06 notes
2014-1 computer algorithm w06 notesDongseo University
 
The day in the life
The day in the lifeThe day in the life
The day in the lifeGreg Wiley
 
石頭 剪刀-布 - health exercise
石頭 剪刀-布 - health exercise石頭 剪刀-布 - health exercise
石頭 剪刀-布 - health exercisepsjlew
 

Destaque (20)

2014-1 computer algorithm w07 notes
2014-1 computer algorithm w07 notes2014-1 computer algorithm w07 notes
2014-1 computer algorithm w07 notes
 
走 史深_~圆明_
走  史深_~圆明_走  史深_~圆明_
走 史深_~圆明_
 
2010 national-geographic
2010 national-geographic2010 national-geographic
2010 national-geographic
 
Approved maintenance organisation ofpl
Approved maintenance organisation ofplApproved maintenance organisation ofpl
Approved maintenance organisation ofpl
 
一生受用不盡的經驗
一生受用不盡的經驗一生受用不盡的經驗
一生受用不盡的經驗
 
鼎藝千秋 3
鼎藝千秋 3鼎藝千秋 3
鼎藝千秋 3
 
VOCABVLA CAPITVLI II
VOCABVLA CAPITVLI IIVOCABVLA CAPITVLI II
VOCABVLA CAPITVLI II
 
高銘和喜馬拉雅山攝影展
高銘和喜馬拉雅山攝影展高銘和喜馬拉雅山攝影展
高銘和喜馬拉雅山攝影展
 
Week 2: Algorithmic Game Theory Notes
Week 2: Algorithmic Game Theory NotesWeek 2: Algorithmic Game Theory Notes
Week 2: Algorithmic Game Theory Notes
 
Week 3: Algorithmic Game Theory Notes
Week 3: Algorithmic Game Theory NotesWeek 3: Algorithmic Game Theory Notes
Week 3: Algorithmic Game Theory Notes
 
In honor of 9/11
In honor of 9/11In honor of 9/11
In honor of 9/11
 
Tlaxcalteca and affiliated tribes of texas 2
Tlaxcalteca and affiliated tribes of texas 2Tlaxcalteca and affiliated tribes of texas 2
Tlaxcalteca and affiliated tribes of texas 2
 
2014-1 computer algorithm w2 notes
2014-1 computer algorithm w2 notes2014-1 computer algorithm w2 notes
2014-1 computer algorithm w2 notes
 
The wiseoldman
The wiseoldmanThe wiseoldman
The wiseoldman
 
2014-1 computer algorithm w06 notes
2014-1 computer algorithm w06 notes2014-1 computer algorithm w06 notes
2014-1 computer algorithm w06 notes
 
The day in the life
The day in the lifeThe day in the life
The day in the life
 
石頭 剪刀-布 - health exercise
石頭 剪刀-布 - health exercise石頭 剪刀-布 - health exercise
石頭 剪刀-布 - health exercise
 
Agile team
Agile teamAgile team
Agile team
 
Genre
GenreGenre
Genre
 
Recursos retóricos TLRIID III
Recursos retóricos TLRIID IIIRecursos retóricos TLRIID III
Recursos retóricos TLRIID III
 

Semelhante a Phys revb.72.184428

Magnetic domains and surface effects in hollow maghemite nanoparticles
Magnetic domains and surface effects in hollow maghemite nanoparticlesMagnetic domains and surface effects in hollow maghemite nanoparticles
Magnetic domains and surface effects in hollow maghemite nanoparticlesCesar Diaz
 
Stillwell_ Strongly coupled electronic, magnetic, and lattice degrees of free...
Stillwell_ Strongly coupled electronic, magnetic, and lattice degrees of free...Stillwell_ Strongly coupled electronic, magnetic, and lattice degrees of free...
Stillwell_ Strongly coupled electronic, magnetic, and lattice degrees of free...Ryan Stillwell, Ph.D.
 
Collective modes in the CFL phase - New Journal of Physics 13 (2011) 055002
Collective modes in the CFL phase - New Journal of Physics 13 (2011) 055002Collective modes in the CFL phase - New Journal of Physics 13 (2011) 055002
Collective modes in the CFL phase - New Journal of Physics 13 (2011) 055002Roberto Anglani
 
Study of Microstructural, Electrical and Dielectric Properties of La0.9Pb0.1M...
Study of Microstructural, Electrical and Dielectric Properties of La0.9Pb0.1M...Study of Microstructural, Electrical and Dielectric Properties of La0.9Pb0.1M...
Study of Microstructural, Electrical and Dielectric Properties of La0.9Pb0.1M...Scientific Review SR
 
fulltext_montecarlo
fulltext_montecarlofulltext_montecarlo
fulltext_montecarloErnest Yeung
 
Synthesis of superparamagnetic mg fe2
Synthesis of superparamagnetic mg fe2Synthesis of superparamagnetic mg fe2
Synthesis of superparamagnetic mg fe2Anselmo Rodriguez
 
48 Measurement of the Σ beam asymmetry for the ω photo-production off the pro...
48 Measurement of the Σ beam asymmetry for the ω photo-production off the pro...48 Measurement of the Σ beam asymmetry for the ω photo-production off the pro...
48 Measurement of the Σ beam asymmetry for the ω photo-production off the pro...Cristian Randieri PhD
 
High-Resolution Infrared and Electron-Diffraction Studies of Trimethylenecycl...
High-Resolution Infrared and Electron-Diffraction Studies of Trimethylenecycl...High-Resolution Infrared and Electron-Diffraction Studies of Trimethylenecycl...
High-Resolution Infrared and Electron-Diffraction Studies of Trimethylenecycl...Corey Wright
 
Structural characterization of chloride salt of conducting pani by xrd, saxd,...
Structural characterization of chloride salt of conducting pani by xrd, saxd,...Structural characterization of chloride salt of conducting pani by xrd, saxd,...
Structural characterization of chloride salt of conducting pani by xrd, saxd,...Grupo de Pesquisa em Nanoneurobiofisica
 
Equation of state for technetium from x‐ray diffraction and first principle c...
Equation of state for technetium from x‐ray diffraction and first principle c...Equation of state for technetium from x‐ray diffraction and first principle c...
Equation of state for technetium from x‐ray diffraction and first principle c...Konstantin German
 
Analytical model for the effect of pressure on the electronic structure of ge...
Analytical model for the effect of pressure on the electronic structure of ge...Analytical model for the effect of pressure on the electronic structure of ge...
Analytical model for the effect of pressure on the electronic structure of ge...Alexander Decker
 
Computational electromagnetics in plasmonic nanostructures
Computational electromagnetics in plasmonic nanostructuresComputational electromagnetics in plasmonic nanostructures
Computational electromagnetics in plasmonic nanostructuresAliakbarMonfared1
 
approved final draft Tim Rose Poster Plasmonic Nano-particles for Energy MR
approved final draft Tim Rose Poster Plasmonic Nano-particles for Energy MRapproved final draft Tim Rose Poster Plasmonic Nano-particles for Energy MR
approved final draft Tim Rose Poster Plasmonic Nano-particles for Energy MRTim Rose
 

Semelhante a Phys revb.72.184428 (20)

Magnetic domains and surface effects in hollow maghemite nanoparticles
Magnetic domains and surface effects in hollow maghemite nanoparticlesMagnetic domains and surface effects in hollow maghemite nanoparticles
Magnetic domains and surface effects in hollow maghemite nanoparticles
 
PhysRevB.93
PhysRevB.93PhysRevB.93
PhysRevB.93
 
Article
ArticleArticle
Article
 
Stillwell_ Strongly coupled electronic, magnetic, and lattice degrees of free...
Stillwell_ Strongly coupled electronic, magnetic, and lattice degrees of free...Stillwell_ Strongly coupled electronic, magnetic, and lattice degrees of free...
Stillwell_ Strongly coupled electronic, magnetic, and lattice degrees of free...
 
Collective modes in the CFL phase - New Journal of Physics 13 (2011) 055002
Collective modes in the CFL phase - New Journal of Physics 13 (2011) 055002Collective modes in the CFL phase - New Journal of Physics 13 (2011) 055002
Collective modes in the CFL phase - New Journal of Physics 13 (2011) 055002
 
Study of Microstructural, Electrical and Dielectric Properties of La0.9Pb0.1M...
Study of Microstructural, Electrical and Dielectric Properties of La0.9Pb0.1M...Study of Microstructural, Electrical and Dielectric Properties of La0.9Pb0.1M...
Study of Microstructural, Electrical and Dielectric Properties of La0.9Pb0.1M...
 
Kronfeld asc2009-li
Kronfeld asc2009-liKronfeld asc2009-li
Kronfeld asc2009-li
 
fulltext_montecarlo
fulltext_montecarlofulltext_montecarlo
fulltext_montecarlo
 
Synthesis of superparamagnetic mg fe2
Synthesis of superparamagnetic mg fe2Synthesis of superparamagnetic mg fe2
Synthesis of superparamagnetic mg fe2
 
Oe3424742482
Oe3424742482Oe3424742482
Oe3424742482
 
48 Measurement of the Σ beam asymmetry for the ω photo-production off the pro...
48 Measurement of the Σ beam asymmetry for the ω photo-production off the pro...48 Measurement of the Σ beam asymmetry for the ω photo-production off the pro...
48 Measurement of the Σ beam asymmetry for the ω photo-production off the pro...
 
High-Resolution Infrared and Electron-Diffraction Studies of Trimethylenecycl...
High-Resolution Infrared and Electron-Diffraction Studies of Trimethylenecycl...High-Resolution Infrared and Electron-Diffraction Studies of Trimethylenecycl...
High-Resolution Infrared and Electron-Diffraction Studies of Trimethylenecycl...
 
Structural characterization of chloride salt of conducting pani by xrd, saxd,...
Structural characterization of chloride salt of conducting pani by xrd, saxd,...Structural characterization of chloride salt of conducting pani by xrd, saxd,...
Structural characterization of chloride salt of conducting pani by xrd, saxd,...
 
Global-10
Global-10Global-10
Global-10
 
structural-analysis-poly
structural-analysis-polystructural-analysis-poly
structural-analysis-poly
 
Poster AAAR 2012
Poster AAAR 2012Poster AAAR 2012
Poster AAAR 2012
 
Equation of state for technetium from x‐ray diffraction and first principle c...
Equation of state for technetium from x‐ray diffraction and first principle c...Equation of state for technetium from x‐ray diffraction and first principle c...
Equation of state for technetium from x‐ray diffraction and first principle c...
 
Analytical model for the effect of pressure on the electronic structure of ge...
Analytical model for the effect of pressure on the electronic structure of ge...Analytical model for the effect of pressure on the electronic structure of ge...
Analytical model for the effect of pressure on the electronic structure of ge...
 
Computational electromagnetics in plasmonic nanostructures
Computational electromagnetics in plasmonic nanostructuresComputational electromagnetics in plasmonic nanostructures
Computational electromagnetics in plasmonic nanostructures
 
approved final draft Tim Rose Poster Plasmonic Nano-particles for Energy MR
approved final draft Tim Rose Poster Plasmonic Nano-particles for Energy MRapproved final draft Tim Rose Poster Plasmonic Nano-particles for Energy MR
approved final draft Tim Rose Poster Plasmonic Nano-particles for Energy MR
 

Mais de Juliana Fortunato

Oxide dispersion strengthened steels
Oxide dispersion strengthened steelsOxide dispersion strengthened steels
Oxide dispersion strengthened steelsJuliana Fortunato
 
Pedology: The Science of Soil Development
Pedology: The Science of Soil DevelopmentPedology: The Science of Soil Development
Pedology: The Science of Soil DevelopmentJuliana Fortunato
 
31752818 classical-electrodynamics-3rd-ed-j-d-jackson-solutions-214-pg
31752818 classical-electrodynamics-3rd-ed-j-d-jackson-solutions-214-pg31752818 classical-electrodynamics-3rd-ed-j-d-jackson-solutions-214-pg
31752818 classical-electrodynamics-3rd-ed-j-d-jackson-solutions-214-pgJuliana Fortunato
 
Jackson j. d. classical eletrodynamics 01 (2ª ed em português)
Jackson j. d.   classical eletrodynamics 01 (2ª ed em português)Jackson j. d.   classical eletrodynamics 01 (2ª ed em português)
Jackson j. d. classical eletrodynamics 01 (2ª ed em português)Juliana Fortunato
 

Mais de Juliana Fortunato (7)

Oxide dispersion strengthened steels
Oxide dispersion strengthened steelsOxide dispersion strengthened steels
Oxide dispersion strengthened steels
 
Pedology: The Science of Soil Development
Pedology: The Science of Soil DevelopmentPedology: The Science of Soil Development
Pedology: The Science of Soil Development
 
Superparamagnetismo
SuperparamagnetismoSuperparamagnetismo
Superparamagnetismo
 
31752818 classical-electrodynamics-3rd-ed-j-d-jackson-solutions-214-pg
31752818 classical-electrodynamics-3rd-ed-j-d-jackson-solutions-214-pg31752818 classical-electrodynamics-3rd-ed-j-d-jackson-solutions-214-pg
31752818 classical-electrodynamics-3rd-ed-j-d-jackson-solutions-214-pg
 
Jackson j. d. classical eletrodynamics 01 (2ª ed em português)
Jackson j. d.   classical eletrodynamics 01 (2ª ed em português)Jackson j. d.   classical eletrodynamics 01 (2ª ed em português)
Jackson j. d. classical eletrodynamics 01 (2ª ed em português)
 
Cap1 capaerelatorio
Cap1 capaerelatorioCap1 capaerelatorio
Cap1 capaerelatorio
 
Lançamento obliquio
Lançamento obliquioLançamento obliquio
Lançamento obliquio
 

Último

Corporate and higher education May webinar.pptx
Corporate and higher education May webinar.pptxCorporate and higher education May webinar.pptx
Corporate and higher education May webinar.pptxRustici Software
 
A Beginners Guide to Building a RAG App Using Open Source Milvus
A Beginners Guide to Building a RAG App Using Open Source MilvusA Beginners Guide to Building a RAG App Using Open Source Milvus
A Beginners Guide to Building a RAG App Using Open Source MilvusZilliz
 
Apidays New York 2024 - Scaling API-first by Ian Reasor and Radu Cotescu, Adobe
Apidays New York 2024 - Scaling API-first by Ian Reasor and Radu Cotescu, AdobeApidays New York 2024 - Scaling API-first by Ian Reasor and Radu Cotescu, Adobe
Apidays New York 2024 - Scaling API-first by Ian Reasor and Radu Cotescu, Adobeapidays
 
TrustArc Webinar - Stay Ahead of US State Data Privacy Law Developments
TrustArc Webinar - Stay Ahead of US State Data Privacy Law DevelopmentsTrustArc Webinar - Stay Ahead of US State Data Privacy Law Developments
TrustArc Webinar - Stay Ahead of US State Data Privacy Law DevelopmentsTrustArc
 
TrustArc Webinar - Unlock the Power of AI-Driven Data Discovery
TrustArc Webinar - Unlock the Power of AI-Driven Data DiscoveryTrustArc Webinar - Unlock the Power of AI-Driven Data Discovery
TrustArc Webinar - Unlock the Power of AI-Driven Data DiscoveryTrustArc
 
Architecting Cloud Native Applications
Architecting Cloud Native ApplicationsArchitecting Cloud Native Applications
Architecting Cloud Native ApplicationsWSO2
 
Strategize a Smooth Tenant-to-tenant Migration and Copilot Takeoff
Strategize a Smooth Tenant-to-tenant Migration and Copilot TakeoffStrategize a Smooth Tenant-to-tenant Migration and Copilot Takeoff
Strategize a Smooth Tenant-to-tenant Migration and Copilot Takeoffsammart93
 
Repurposing LNG terminals for Hydrogen Ammonia: Feasibility and Cost Saving
Repurposing LNG terminals for Hydrogen Ammonia: Feasibility and Cost SavingRepurposing LNG terminals for Hydrogen Ammonia: Feasibility and Cost Saving
Repurposing LNG terminals for Hydrogen Ammonia: Feasibility and Cost SavingEdi Saputra
 
DBX First Quarter 2024 Investor Presentation
DBX First Quarter 2024 Investor PresentationDBX First Quarter 2024 Investor Presentation
DBX First Quarter 2024 Investor PresentationDropbox
 
Apidays New York 2024 - The Good, the Bad and the Governed by David O'Neill, ...
Apidays New York 2024 - The Good, the Bad and the Governed by David O'Neill, ...Apidays New York 2024 - The Good, the Bad and the Governed by David O'Neill, ...
Apidays New York 2024 - The Good, the Bad and the Governed by David O'Neill, ...apidays
 
Manulife - Insurer Transformation Award 2024
Manulife - Insurer Transformation Award 2024Manulife - Insurer Transformation Award 2024
Manulife - Insurer Transformation Award 2024The Digital Insurer
 
ICT role in 21st century education and its challenges
ICT role in 21st century education and its challengesICT role in 21st century education and its challenges
ICT role in 21st century education and its challengesrafiqahmad00786416
 
FWD Group - Insurer Innovation Award 2024
FWD Group - Insurer Innovation Award 2024FWD Group - Insurer Innovation Award 2024
FWD Group - Insurer Innovation Award 2024The Digital Insurer
 
ProductAnonymous-April2024-WinProductDiscovery-MelissaKlemke
ProductAnonymous-April2024-WinProductDiscovery-MelissaKlemkeProductAnonymous-April2024-WinProductDiscovery-MelissaKlemke
ProductAnonymous-April2024-WinProductDiscovery-MelissaKlemkeProduct Anonymous
 
Navi Mumbai Call Girls 🥰 8617370543 Service Offer VIP Hot Model
Navi Mumbai Call Girls 🥰 8617370543 Service Offer VIP Hot ModelNavi Mumbai Call Girls 🥰 8617370543 Service Offer VIP Hot Model
Navi Mumbai Call Girls 🥰 8617370543 Service Offer VIP Hot ModelDeepika Singh
 
Real Time Object Detection Using Open CV
Real Time Object Detection Using Open CVReal Time Object Detection Using Open CV
Real Time Object Detection Using Open CVKhem
 
Apidays New York 2024 - Accelerating FinTech Innovation by Vasa Krishnan, Fin...
Apidays New York 2024 - Accelerating FinTech Innovation by Vasa Krishnan, Fin...Apidays New York 2024 - Accelerating FinTech Innovation by Vasa Krishnan, Fin...
Apidays New York 2024 - Accelerating FinTech Innovation by Vasa Krishnan, Fin...apidays
 
Apidays Singapore 2024 - Modernizing Securities Finance by Madhu Subbu
Apidays Singapore 2024 - Modernizing Securities Finance by Madhu SubbuApidays Singapore 2024 - Modernizing Securities Finance by Madhu Subbu
Apidays Singapore 2024 - Modernizing Securities Finance by Madhu Subbuapidays
 
MINDCTI Revenue Release Quarter One 2024
MINDCTI Revenue Release Quarter One 2024MINDCTI Revenue Release Quarter One 2024
MINDCTI Revenue Release Quarter One 2024MIND CTI
 
Ransomware_Q4_2023. The report. [EN].pdf
Ransomware_Q4_2023. The report. [EN].pdfRansomware_Q4_2023. The report. [EN].pdf
Ransomware_Q4_2023. The report. [EN].pdfOverkill Security
 

Último (20)

Corporate and higher education May webinar.pptx
Corporate and higher education May webinar.pptxCorporate and higher education May webinar.pptx
Corporate and higher education May webinar.pptx
 
A Beginners Guide to Building a RAG App Using Open Source Milvus
A Beginners Guide to Building a RAG App Using Open Source MilvusA Beginners Guide to Building a RAG App Using Open Source Milvus
A Beginners Guide to Building a RAG App Using Open Source Milvus
 
Apidays New York 2024 - Scaling API-first by Ian Reasor and Radu Cotescu, Adobe
Apidays New York 2024 - Scaling API-first by Ian Reasor and Radu Cotescu, AdobeApidays New York 2024 - Scaling API-first by Ian Reasor and Radu Cotescu, Adobe
Apidays New York 2024 - Scaling API-first by Ian Reasor and Radu Cotescu, Adobe
 
TrustArc Webinar - Stay Ahead of US State Data Privacy Law Developments
TrustArc Webinar - Stay Ahead of US State Data Privacy Law DevelopmentsTrustArc Webinar - Stay Ahead of US State Data Privacy Law Developments
TrustArc Webinar - Stay Ahead of US State Data Privacy Law Developments
 
TrustArc Webinar - Unlock the Power of AI-Driven Data Discovery
TrustArc Webinar - Unlock the Power of AI-Driven Data DiscoveryTrustArc Webinar - Unlock the Power of AI-Driven Data Discovery
TrustArc Webinar - Unlock the Power of AI-Driven Data Discovery
 
Architecting Cloud Native Applications
Architecting Cloud Native ApplicationsArchitecting Cloud Native Applications
Architecting Cloud Native Applications
 
Strategize a Smooth Tenant-to-tenant Migration and Copilot Takeoff
Strategize a Smooth Tenant-to-tenant Migration and Copilot TakeoffStrategize a Smooth Tenant-to-tenant Migration and Copilot Takeoff
Strategize a Smooth Tenant-to-tenant Migration and Copilot Takeoff
 
Repurposing LNG terminals for Hydrogen Ammonia: Feasibility and Cost Saving
Repurposing LNG terminals for Hydrogen Ammonia: Feasibility and Cost SavingRepurposing LNG terminals for Hydrogen Ammonia: Feasibility and Cost Saving
Repurposing LNG terminals for Hydrogen Ammonia: Feasibility and Cost Saving
 
DBX First Quarter 2024 Investor Presentation
DBX First Quarter 2024 Investor PresentationDBX First Quarter 2024 Investor Presentation
DBX First Quarter 2024 Investor Presentation
 
Apidays New York 2024 - The Good, the Bad and the Governed by David O'Neill, ...
Apidays New York 2024 - The Good, the Bad and the Governed by David O'Neill, ...Apidays New York 2024 - The Good, the Bad and the Governed by David O'Neill, ...
Apidays New York 2024 - The Good, the Bad and the Governed by David O'Neill, ...
 
Manulife - Insurer Transformation Award 2024
Manulife - Insurer Transformation Award 2024Manulife - Insurer Transformation Award 2024
Manulife - Insurer Transformation Award 2024
 
ICT role in 21st century education and its challenges
ICT role in 21st century education and its challengesICT role in 21st century education and its challenges
ICT role in 21st century education and its challenges
 
FWD Group - Insurer Innovation Award 2024
FWD Group - Insurer Innovation Award 2024FWD Group - Insurer Innovation Award 2024
FWD Group - Insurer Innovation Award 2024
 
ProductAnonymous-April2024-WinProductDiscovery-MelissaKlemke
ProductAnonymous-April2024-WinProductDiscovery-MelissaKlemkeProductAnonymous-April2024-WinProductDiscovery-MelissaKlemke
ProductAnonymous-April2024-WinProductDiscovery-MelissaKlemke
 
Navi Mumbai Call Girls 🥰 8617370543 Service Offer VIP Hot Model
Navi Mumbai Call Girls 🥰 8617370543 Service Offer VIP Hot ModelNavi Mumbai Call Girls 🥰 8617370543 Service Offer VIP Hot Model
Navi Mumbai Call Girls 🥰 8617370543 Service Offer VIP Hot Model
 
Real Time Object Detection Using Open CV
Real Time Object Detection Using Open CVReal Time Object Detection Using Open CV
Real Time Object Detection Using Open CV
 
Apidays New York 2024 - Accelerating FinTech Innovation by Vasa Krishnan, Fin...
Apidays New York 2024 - Accelerating FinTech Innovation by Vasa Krishnan, Fin...Apidays New York 2024 - Accelerating FinTech Innovation by Vasa Krishnan, Fin...
Apidays New York 2024 - Accelerating FinTech Innovation by Vasa Krishnan, Fin...
 
Apidays Singapore 2024 - Modernizing Securities Finance by Madhu Subbu
Apidays Singapore 2024 - Modernizing Securities Finance by Madhu SubbuApidays Singapore 2024 - Modernizing Securities Finance by Madhu Subbu
Apidays Singapore 2024 - Modernizing Securities Finance by Madhu Subbu
 
MINDCTI Revenue Release Quarter One 2024
MINDCTI Revenue Release Quarter One 2024MINDCTI Revenue Release Quarter One 2024
MINDCTI Revenue Release Quarter One 2024
 
Ransomware_Q4_2023. The report. [EN].pdf
Ransomware_Q4_2023. The report. [EN].pdfRansomware_Q4_2023. The report. [EN].pdf
Ransomware_Q4_2023. The report. [EN].pdf
 

Phys revb.72.184428

  • 1. PHYSICAL REVIEW B 72, 184428 ͑2005͒ Effect of dipolar interaction observed in iron-based nanoparticles J. M. Vargas,1,2,* W. C. Nunes,2 L. M. Socolovsky,2 M. Knobel,2 and D. Zanchet1 1Laboratório Nacional de Luz Síncrotron, Giuseppe M. Scolfaro 10000, Campinas (SP) 13084-971, Brazil de Física “Gleb Wataghin”, Universidade Estadual de Campinas, Campinas (SP) 13083-970 Brazil ͑Received 1 April 2005; revised manuscript received 18 August 2005; published 23 November 2005͒ 2Instituto Spherical magnetic nanoparticles with narrow size distribution and organic capping were diluted in paraffin with different concentrations to verify the role of dipolar interactions on the macroscopic magnetic behavior. Increasing concentration of magnetic nanoparticles leads to higher blocking temperatures. The experimental data were analyzed by means of a recently proposed model that takes into account magnetic interactions of dipolar origin, and an excellent agreement was found. Considering the magnetic interaction among particles it was possible to obtain the real magnetic moment and estimate structural parameters that are consistent with the ones obtained by small angle x-ray scattering and transmission electron microscopy. DOI: 10.1103/PhysRevB.72.184428 PACS number͑s͒: 75.50.Tt, 75.20.Ϫg, 75.75.ϩa I. INTRODUCTION A superparamagnetic system is composed by magnetic monodomain nanoparticles whose atomic magnetic moments rigidly align through exchange interaction. All the individual magnetic moments add to form a magnetic supermoment, usually of the order of thousands of Bohr magnetons ͑␮B͒. The canonical description of superparamagnetism, following the Langevin formalism, considers a negligible anisotropy for each particle and neglects the effect of interparticle interactions, which can manifest through exchange, indirect exchange, Ruderman-Kittel-Kasuya-Yosida ͑RKKY͒, or even dipole-dipole interactions.1–3 Although many nanostructured systems ͑i.e., systems with particle sizes of the order of nanometers͒ have been reported as superparamagnetic, a lack of agreement is commonly observed between experimental data and the standard superparamagnetic theory. These differences are usually ascribed to the intrinsic particle size distribution, anisotropies of different origins, and interactions among magnetic particles. One significant difference appears when particle size distribution functions obtained from apparently good fits performed using a weighted sum of Langevin functions are compared to the ones obtained from direct structural data, such as transmission electron microscopy ͑TEM͒ images.4,5 Besides the lack of agreement, usually the fitted mean magnetic moment strongly increases with increasing temperature, a fact that confirms the spurious nature of the obtained parameters.4–6 Such unusual behavior has been also observed in antiferromagnetic particles, and an alternative theoretical model based on the existence of a thermally activated surface net magnetic moment has been recently proposed to explain such a trend in those nanoparticles, but it remains controversial.7,8 Extensive experimental and theoretical works agree that the interaction among magnetic particles play a fundamental role in the magnetic behavior of granular systems.8–14 However, several inconsistencies have been discussed since the late 1980s, trying to conciliate theory and different experimental data. For instance, in the limit of weak interactions, an increase of the blocking temperature with particle density 1098-0121/2005/72͑18͒/184428͑6͒/$23.00 has been observed in some experiments,9,10 but other results show the opposite trend.11 For high density particle systems, the picture is more complex since the blocking process of each nanoparticle is highly dependent on its neighborhood. The observation of properties resembling spin glasses has suggested the existence of a spin glasslike state or magnetic order in such systems. Nonetheless, most results have also been explained by progressive blocking of independent particles, leading to an intensive debate in the last years.12–16 In the effort to better understand this complex issue, a recent study took into account the dipolar interactions by introducing a phenomenological temperature, T*, in the argument of the Langevin function, which has been known as the T* model.4 This assumption considers that dipolar interactions tend to increase the orientational disorder of the magnetic moments, so that thermal agitation would be somewhat “enhanced” owing to dipolar interactions. Undoubtedly, a major challenge to better understand the magnetic interactions in nanosystems and test the existing models is to produce good quality samples. In fact, the limited knowledge of nanoparticle shape, composition gradient, size distribution, or even touching nanoparticles can prevent having an accurate picture of the whole system. We have contributed to overcoming this problem by producing nanosized iron-based nanoparticles of approximately spherical shape and narrow size distribution by colloidal methods. The presence of organic, insulating capping on the surface of the magnetic particles prevents the formation of agglomerates or chains, leading to pure dipolar interactions. Furthermore, the strength of the dipolar interaction among particles can be tuned by diluting the same sample in different amounts of paraffin, allowing one to systematically study just the effect of dipolar interactions, avoiding variations in chemical composition, size distribution, and magnetic anisotropy among samples. II. EXPERIMENTAL PROCEDURE AND SAMPLES Magnetic iron-based nanoparticles were prepared by colloidal synthesis ͑see further details in Ref. 17͒ and wellcharacterized by TEM and small angle x-ray scattering 184428-1 ©2005 The American Physical Society
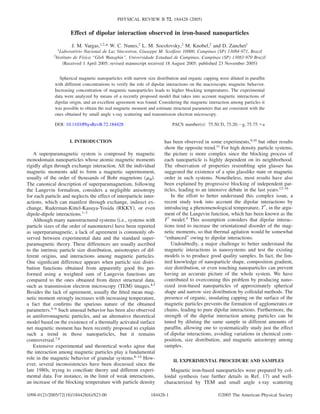
  • 2. PHYSICAL REVIEW B 72, 184428 ͑2005͒ VARGAS et al. FIG. 1. A TEM image of the nanoparticle sample used in this work. The insets show the SAXS curve of the same sample ͑the fit is represented by the white line͒ and the distribution of sizes obtained from both techniques. ͑SAXS͒. The results of both analyses are shown in Fig. 1. The TEM image shows spherical nanoparticles with mean diameter, dav = 7.1 nm and very narrow size distribution ͑␴ = 0.08͒. This result is corroborated by the SAXS data of the same sample, which shows an oscillatory behavior typical of narrow size distribution spherical particles ͑inset of Fig. 1͒. SAXS data treatment was done using the GNOM program,18 for which a sphere distribution was assumed. The SAXS analysis gave dav = 7.3 nm, similar to TEM, but a larger size distribution ͑␴ = 0.17͒. The distribution of particle sizes obtained by TEM and SAXS are shown in the inset of Fig. 1. It is important to point out that the difference found between the size distributions obtained by TEM and SAXS is not surprising for this kind of sample. It is known that during the solvent evaporation on the TEM grid the nanoparticles selfassemble forming large ordered regions of particles of similar sizes, excluding the smaller ones to the edges.19 This may underestimate the TEM size distribution width. In this work we have used the size distribution obtained by SAXS since it gives an average signal and we consider that it better describes the actual system. In the following analysis, the SAXS distribution of particle sizes has been converted to a volume distribution and fitted with a Gaussian function, given a volume distribution of ␴V = 0.38. The as-synthesized nanoparticles are mainly composed by amorphous Fe and capped by oleyl-sarcosine molecules, which avoid agglomeration. The colloidal solution can be precipitated using methanol or ethanol and easily redispersed in toluene or Decalin. The slow oxidation process leads to a disordered Fe oxide, whose majority magnetic phase locally resembles magnetite ͑Fe3O4͒, as identified by Mössbauer spectroscopy.17 To evaluate the dipolar magnetic interaction FIG. 2. The ZFC-FC curves as a function of nanoparticle concentration ͑H = 20 Oe͒. Note that the blocking temperature clearly shifts to higher values when nanoparticle concentration increases. The irreversibility region in the FC curves shows qualitatively the increase of the dipolar interaction for higher nanoparticle concentration. in this system, some quantity of the same batch of the colloidal solution was precipitated ͑powder sample͒ or diluted in paraffin, in different concentrations. This strategy was adopted to minimize little variations that may occur when using different batches of samples or due to the oxidation process. The dilutions used in this work were 0.05, 0.5, 5, and 45 % mass of colloid/mass of paraffin, hereinafter named C005, C05, C5, and C45, respectively. However, it is important to point out that the absolute values are just indicative of the degree of concentration due to the intrinsic large errors in the determination of the actual magnetic nanoparticle core mass. Zero-field-cooled ͑ZFC͒ and field-cooled ͑FC͒ magnetization and magnetization vs applied field ͑M vs H͒ measurements ͑magnetization loops͒ were performed in a commercial superconducting quantum interference device ͑SQUID͒ magnetometer ͑quantum design MPMS XL7͒. The diamagnetic contribution of the paraffin was subtracted from the magnetization data and the results were presented in the reduced form for all samples, i.e., M / M S vs H, to avoid misleading results due to the uncertainties in the nanoparticle mass determination. III. RESULTS AND DISCUSSION A. Magnetic properties ZFC and FC curves as functions of particle concentration are shown in Fig. 2 ͑H = 20 Oe͒. As can be clearly seen, for increasing particle concentration the splitting points between ZFC and FC curves as well as the maxima of the ZFC curves shift to higher temperatures, indicating an increase in the blocking temperature, TB.20 A similar trend was previously observed by Dormann et al., Zysler et al.,21,22 and in Monte Carlo simulations,23,24 for example. Such results qualitatively 184428-2
  • 3. PHYSICAL REVIEW B 72, 184428 ͑2005͒ EFFECT OF DIPOLAR INTERACTION OBSERVED IN… agree with the Dormann-Bessais-Fiorani model.9 Also, the FC magnetization curvature in the irreversibility region ͑below blocking temperature͒ qualitatively marks the strength of interparticle interaction, diminishing its relative height with respect to the maximum of the ZFC curve as the concentration increases. It is worth mentioning that the overall shape of the ZFC curves for all samples is similar, indicating that no percolation occurs among particles, so reassuring that the magnetic properties can be, in principle, described in the framework of the superparamagnetic model. In some systems composed by nanoparticles, when the volume concentration of the magnetic element reaches 17–25 %, a clear distinctive shape of the ZFC curve appears due to direct contact among magnetic nanoparticles.25,26 It is known that the ZFC curve is sensitive to the distribution of activation energy ͑25 kTB͒ that can be easily calculated considering a system of noninteracting particles with x volume concentration of particles.20 For a single particle of volume, V, the magnetization, M, under low magnetic field, H, is expressed as M = ͑M core͒2 VH / kT in the superparamagS netic region ͑T Ͼ TB͒, and M = ͑M core͒2 H / 3 K in the blocked S region ͑T Ͻ TB͒, respectively ͑T is the system temperature, M core is the saturation magnetization of the nanoparticle S magnetic core, k is the Boltzmann constant, and K is the anisotropy constant͒. Therefore, for a noninteracting fine particle system the total magnetization can be written as27 M ZFC͑H,T͒ M coreH = S MS 3K + ͵ ͵ ϱ f͑V͒dV Vb͑T͒ M coreH S 3kT Vb͑T͒ Vf͑V͒dV, ͑1͒ 0 where Vb͑T͒ = 25kT / K, and f͑V͒ is the particle volume distribution, and M S is the sample saturation magnetization, ͑x is the magnetic core volume fraction͒. The first term in Eq. ͑1͒ describes the contribution of the particles in the blocked state. Its relative contribution drops with increasing temperature, as the number of the blocked particles decreases. The f͑V͒ can be related to the distribution of blocking temperature by the linear expression 25kTB = KV. Therefore, one can obtain K by fitting the ZFC curves using ␴V = 0.38 obtained by SAXS, and the M S value obtained from the M vs H measured at low temperatures ͑keeping M core and K as free fitting S parameters͒. Figure 3 shows the reduced curve for the most diluted sample ͑C005͒ and the corresponding fit. From this analysis, K = 3.6ϫ 105 erg/ cm3 and M core = 490 emu/ cm3. As S can be seen in Fig. 3, the superparamagnetic model is a good approach to describe the C005 sample behavior, suggesting that the possibility of particles agglomeration is not significant in that sample. In addition, this result confirms the morphological information derived from SAXS. The coercive field, HC, obtained from the M / M S vs H curves measured at different temperatures is shown in Fig. 4 ͑at temperatures below the blocking one͒. The coercive field temperature behavior of systems of identical noninteracting particles with random anisotropy axes follows the wellknown relation,28 FIG. 3. The zero-field cooled curve of a C005 sample measured with H = 20 Oe. The line is the best fit of Eq. ͑1͒ to the experimental data ͑symbol͒ using the SAXS distribution and M core and K as free S parameters. Hc = 0.96 K ͓1 − ͑T/TB͒1/2͔. M core S ͑2͒ It can be inferred from Fig. 4 that the HC behavior of the samples C5 and C45 can be described by Eq. ͑2͒ at least in the low temperature range, giving K / M core = 670 Oe and 636 S Oe, respectively. This simple approximation, however, does not hold reasonably for the powder sample. The decrease of the HC value for sample C45 compared to C5 is in agreement with the demagnetizing role played by the dipolar interaction as simulated by Kechrakos and Trohidou.29 The Hc vs T trends also confirm that the only parameter change in our samples is the particle concentration. Using the K value obtained from the ZFC analysis of C005 sample, we find FIG. 4. HC vs T0.5 obtained for the C5, C45, and powder samples. Similar behavior of samples C5 and C45 can be seen. In addition, these samples present a linear dependence with T0.5 in the low temperature range. The lines serve as a guide to the eyes. 184428-3
  • 4. PHYSICAL REVIEW B 72, 184428 ͑2005͒ VARGAS et al. is not simply a fitting parameter. It can be related to the rms dipolar energy ␧D, ␧D = kT* = ␣ ␮2/D3 , ͑4͒ where ␣ is a constant ͑derived from the sum of all dipolar energy contributions͒, and D is the average interparticle distance.4 This is the main assumption of the T* model that considers that a dipolar field exerts a disordering and random torque to the magnetic moments of the particles, “decreasing” the ordering effect played by the applied magnetic field ͑similar to the effect of temperature͒. Using the condition ND3 = 1 and M S = N␮, T* can be calculated as FIG. 5. The M vs H curves of C5, C45 and powder samples pointing out the effect of the dipolar interaction. The inset shows the C5 data as a function of temperature and the corresponding fits using the conventional superparamagnetic model showing a nice agreement but spurious ␮ values ͑these values correspond to the ␮a in the T* model͒. M core = 537 emu/ cm3 and M core = 564 emu/ cm3 for samples S S C5 and C45. Considering the approximations involved in both fits, the results are in very good agreement with the ZFC analysis. M / M S vs H curves have been measured at several temperatures for all samples. The loops of sample C005 and C05 were strongly influenced by paraffin diamagnetism, which screens the high-field region of the measurements, and therefore those results will not be considered in the following analysis. Figure 5 shows the M / M S vs H of C5, C45, and powder samples measured at 300 K showing the effect of dilution. The inset shows the evolution of M / M S vs H of C5 as a function of temperature. It is important to mention that the universal curve M / M S vs H / T, expected in a canonical superparamagnetic system when plotting M vs H curves taken at different temperatures, cannot be obtained.30 This lack of agreement is more pronounced for the powder sample, as expected due to stronger interparticle interactions. T* = ␮a = ͵ ͩ ϱ 0 ␮L ͪ ␮H f͑␮͒d␮ , k͑T + T*͒ 1 ͑3͒ where N is the number of particles per unit volume, f͑␮͒ is the distribution of magnetic moments that is determined from the experimental volume distribution ͑␮ = M coreV͒, and S L is the Langevin function. It is important to remark that T* ͩ ͪ *␮. Na = 1 + T 1+ T T* N, T ͑6͒ and, as a consequence, ͵ ͩ ͪ ϱ M͑H,T͒ = Na ␮ aL 0 ␮ aH f͑␮a͒d␮a . kT ͑7͒ The only two fitting parameters are Na and ␮a for each temperature and Na is assumed to be independent of temperature, since f͑ua͒ was obtained from SAXS. In this work we used the reduced form of Eq. ͑7͒, reducing the fitting parameters to a single parameter, ␮a, for each temperature: ͵ ͩ ͪ ͵ ϱ M͑H,T͒ = MS To study in more detail the effect of interparticle interactions as function of particle concentration, we have employed the T* model.4 In such a model, the effect of the dipolar interaction is introduced by means of a fictitious temperature, T*, which is added to the actual temperature T in the denominator of the Langevin function argument. This phenomenological theory can be used to relate the experimental magnetization M of a set of interacting nanoparticles to their actual magnetic moment ␮, ͑5͒ Equation ͑3͒ can be rewritten as a weighted sum of standard Langevin functions, but considering instead an apparent magnetic moment ␮a and an apparent particle density, Na, given by,4 B. Influence of the dipolar interaction M͑H,T͒ = N ␣ ␮2 ␣ ␣ M2 S 2 . 3 = N ␮ = kD k k N ␮ aL 0 ϱ ␮ aH f͑␮a͒d␮a kT . ͑8͒ ␮a f͑␮a͒d␮a 0 The M / M S vs H curves fits for each temperature were very good in all cases ͑see inset in Fig. 5 for the analysis of C5 sample͒ and the inset of Fig. 6 shows the ␮a as a function of temperature for the three considered samples. It can be inferred from Fig. 6 an increase of ␮a with the temperature up to a maximum value, depending on sample concentration. Since all samples have the same magnetic anisotropy, this reinforces the hypothesis of the existence of a strict relationship between the dipolar interaction and the anomalous thermal behavior of ␮a, commonly observed in single domain particle systems.4 The only required parameter to calculate the real magnetic moment ␮ from ␮a is T* ͓see Eq. ͑6͔͒. The T* can be derived from the low-field susceptibility of an interacting superparamagnetic system within the framework of this model, 184428-4
  • 5. PHYSICAL REVIEW B 72, 184428 ͑2005͒ EFFECT OF DIPOLAR INTERACTION OBSERVED IN… FIG. 6. ␮a and ␮ values as a function of temperature for C5 ͑␮ taken constant͒. The inset shows the ␮a values for the three samples. ␹= N␮2 , 3k͑T + T*͒ ͑9͒ which, for a system with size distribution, can be expressed as4 ͩ ͪ ␳ T = 3kN + 3␣ = AT + C, ␹ M2 S ͑10͒ where ␳ = ͗␮2͘ / ͗␮͘2 = ͗␮2͘ / ͗␮a͘2, the brackets indicating the a average over the values of the distribution of magnetic moments ͑see details in Ref. 4͒. T* can now be readily obtained from the ratio C / A ͓͑see Eqs. ͑5͒ and ͑10͔͒. The curve ␳ / ␹ vs T can be independently obtained from different routes, such as the high-temperature region of the ZFC-FC curves, i.e., above blocking temperature, or from the lowfield region of the anhysteretic curves ͑average of two branches of a hysteresis loop31͒. In the present case, the ␹͑T͒ values were obtained of the linear region of the anhysteretic magnetization curves. The fit was performed in the linear region of the normalized form of Eq. ͑10͒, ␳ M S / ␹ vs T, using M S ͑in emu͒ at 20 K, and the results are presented in Table I and Fig. 7. It is interesting to note in Fig. 7 that the angular coefficient, M SA, which is equal to 3k / ␮, is similar to the three samples as it should be expected since the only variable parameter among samples is the concentration. It is important to point out, however, that T* may be underestimated by taking the normalization, M S, at 20 K, but the TABLE I. The values of M SA and M SC derived from the fit of ␳ M S / ␹ vs T using Eq. ͑10͒ and the resulting values of T*. The ␳ value obtained from the SAXS volume distribution was 1.13. FIG. 7. The ␳ M S / ␹ vs T graphic obtained from the linear region of the magnetization curves ͑magnetization under low field H͒ for the three samples. The solid lines are the best fits done to derive the T* values ͑see the text͒. correct trend among samples is still obtained. Figure 6 shows the real magnetic moment ␮ obtained from ␮a and T* ͑considering M S constant with temperature͒. To corroborate the analysis, the temperature dependence of the ␮a calculated by using the T* and ␮ are shown by lines in the inset of Fig. 6, showing a good agreement with the results obtained via the fit of M / H vs H curves at different temperatures. We have also tested different approaches to fit the M / M S x H curves, for example, considering T* and ␮ as fitting parameters, where curves taken at different temperatures are fitted simultaneously. The results and goodness of the fits were similar to the previous case. We have also tested to leave the moment distribution width as a free parameter, and it converged to the value derived from the SAXS analysis for all samples, further validating the analysis. It is worth emphasizing that good fits using a properly weighted set of Langevin functions are not surprising, but often the obtained size distribution parameters are quite different from those obtained from direct structural measurements.4–6,32 However, considering the T* model applied in the present work, the fitting parameters agree rather well with structural data. One can estimate the mean magnetic moment, ͗␮͘ = M coreV, by considering spherical parS ticles, dav = 7.3 nm, and M S = 537 emu/ cm3 ͑calculated from the coercivity measurements for sample C5͒. This procedure leads to a value of the magnetic moment, ͗␮͘ = 11802 ␮B, which is rather close to the values obtained from the T* model. Sample M SA M SC T* ͑K͒ IV. CONCLUSION C5 C45 Powder 3.3 3.5 3.2 173 266 622 51.7 76.1 196.1 In this work, spherical magnetic nanoparticles with narrow size distribution and organic capping were diluted in paraffin with different concentrations to tune interparticle dipole-dipole interactions. We clearly demonstrated that a 184428-5
  • 6. PHYSICAL REVIEW B 72, 184428 ͑2005͒ VARGAS et al. shift of the blocking temperature with increasing concentrations is observed when solely dipolar interactions are strengthened. Morover, to the best of our knowledge, this is the first experimental test of the T* model using a wellbehaved system composed by truly isolated spherical nanoparticles with narrow size distribution. Using this model, we were able to derive the correct trends among samples and the real magnetic moment, which was in good agreement with ZFC-FC and Hc analysis. Also, different fit routes were tested, and all of them converged to very similar values, very close to those obtained from structural data. Such data and their analysis point to an adequacy of such a phenomenologi- *Present address: Centro Atómico Bariloche, Avenue Bustillo 9. 500͑R8402AGP͒ San Carlos de Bariloche ͑RN͒, Argentina. 1 L. Néel, Ann. Geophys. ͑C.N.R.S.͒ 5, 99 ͑1949͒. 2 X. Battle and A. Labarta, J. Phys. D 35, R15 ͑2002͒. 3 R. Skomski, J. Phys.: Condens. Matter 15, R841 ͑2003͒. 4 P. Allia, M. Coisson, P. Tiberto, F. Vinai, M. Knobel, M. A. Novak, and W. C. Nunes, Phys. Rev. B 64, 144420 ͑2001͒. 5 A. L. Brandl, J. C. Denardin, L. M. Socolovsky, M. Knobel, and P. Allia, J. Magn. Magn. Mater. 272-276, 1526 ͑2004͒. 6 H. Mamiya, I. Nakatani, T. Furubayashi, and M. Ohnuma, Trans. Magn. Soc. Jpn. 2, 36 ͑2002͒. 7 S. Mørup and C. Frandsen, Phys. Rev. Lett. 92, 217201 ͑2004͒;N. J. O. Silva, L. D. Carlos, and V. S. Amaral, ibid. 94, 039707 ͑2005͒;S. Morup and C. Frandsen, ibid. 94, 039708 ͑2005͒;A. H. MacDonald and C. M. Canali, ibid. 94, 089701 ͑2005͒;S. Morup and C. Frandsen, ibid. 94, 089702 ͑2005͒. 8 M. Knobel, W. C. Nunes, A. L. Brandl, J. M. Vargas, L. M. Socolovsky, and D. Zanchet, Physica B 354, 80 ͑2004͒. 9 J. L. Dormann, L. Bessais, and D. Fiorani, J. Phys. C 21, 2015 ͑1988͒;J. L. Dormann, D. Fiorani, and E. Tronc, J. Magn. Magn. Mater. 202, 251 ͑1999͒. 10 W. Luo, S. R. Nagel, T. F. Rosenbaum, and R. E. Rosensweig, Phys. Rev. Lett. 67, 2721 ͑1991͒. 11 S. Mørup and E. Tronc, Phys. Rev. Lett. 72, 3278 ͑1994͒. 12 Y. Sun, M. B. Salamon, K. Garnier, and R. S. Averback, Phys. Rev. Lett. 91, 167206 ͑2003͒;M. Sasaki, P. E. Jönsson, H. Takayama, and P. Nordblad, ibid. 93, 139701 ͑2004͒. 13 M. F. Hansen et al., J. Phys.: Condens. Matter 14, 4901 ͑2002͒. 14 W. Kleemann, O. Petracic, C. Binek, G. N. Kakazei, Y. G. Pogorelov, J. B. Sousa, O. S. Cardos, and P. P. Freitas, Phys. Rev. B 63, 134423 ͑2001͒. 15 E. P. Wohlfarth, Physica B & C 86, 852 ͑1977͒. 16 S. Chakraverty, M. Bandyopadhyay, S. Chatterjee, S. Dattagupta, cal model to explain the trends of the intricate macroscopic magnetic behavior of a superparamagnetic system with the presence of dipolar interactions among magnetic particles. However, further analysis should be carried out to further corroborate quantitatively the results derived from this model. ACKNOWLEDGMENT Brazilian funding agencies FAPESP, CAPES, CNPq, and Brazilian Synchrotron Light Laboratory ͑SAXS beamline and LME͒ are acknowledged for their support. A. Frydman, S. Sengupta, and P. A. Sreeram, Phys. Rev. B 71, 054401 ͑2005͒. 17 J. M. Vargas, L. M. Socolovsky, G. F. Goya, M. Knobel, and D. Zanchet, IEEE Trans. Magn. 39, 2681 ͑2003͒. 18 D. I. Svergun, J. Appl. Crystallogr. 25, 495 ͑1992͒. 19 P. C. Ohara, D. V. Leff, J. R. Heath, and W. M. Gelbart, Phys. Rev. Lett. 75, 3466 ͑1995͒. 20 J. C. Denardin, A. L. Brandl, M. Knobel, P. Panissod, A. B. Pakhomov, H. Liu, and X. X. Zhang, Phys. Rev. B 65, 64422 ͑2002͒. 21 J. L. Dormann, D. Fiorani, and E. Tronc, Adv. Chem. Phys., 98, 283 ͑1997͒. 22 R. D. Zysler, C. A. Ramos, E. De Biasi, H. Romero, A. Ortega, and D. Fiorani, J. Magn. Magn. Mater. 221, 37 ͑2000͒. 23 J. García-Otero, M. Porto, J. Rivas, and A. Bunde, Phys. Rev. Lett. 84, 167 ͑2000͒. 24 M. Bahiana, J. P. Pereira Nunes, D. Altbir, P. Vargas, and M. Knobel, J. Magn. Magn. Mater. 281, 372 ͑2004͒. 25 B. V. B. Sarkissian, J. Phys.: Condens. Matter 208, 2191 ͑1981͒. 26 L. M. Socolovsky, F. H. Sánchez, and P. H. Shingu, Hyperfine Interact. 133, 47 ͑2001͒. 27 T. Bitoh, K. Ohba, M. Takamatsu, T. Shirane, and S. Chikazawa, J. Phys. Soc. Jpn. 64, 1305 ͑1995͒. 28 E. F. Kneller and F. E. Luborsky, J. Appl. Phys. 34, 656 ͑1963͒. 29 D. Kechrakos and K. N. Trohidou, Phys. Rev. B 58, 12169 ͑1998͒. 30 I. S. Jacobs and C. P. Bean, in Magnetism, edited by G. T. Rado and H. Suhl ͑New York, Academic Press, 1963͒, Vol. III, pp.271-350. 31 P. Allia, M. Coisson, M. Knobel, P. Tiberto, and F. Vinai, Phys. Rev. B 60, 17 12207 ͑1999͒. 32 Q. A. Pankhurst, D. H. Ucko, L. Fernández Barquín, and R. García Calderón, J. Magn. Magn. Mater. 266, 131 ͑2003͒. 184428-6