SlideShare uma empresa Scribd logo
1 de 11
Baixar para ler offline
IOSR Journal Of Humanities And Social Science (IOSR-JHSS)
Volume 20, Issue 1, Ver. IV (Jan. 2015), PP 51-61
e-ISSN: 2279-0837, p-ISSN: 2279-0845.
www.iosrjournals.org
DOI: 10.9790/0837-2015161 www.iosrjournals.org 51 | Page
Trend and Growth of Flow of Credit to Agriculture after 1991 in
India
Javid Ahmad Dar1
1
(Department of Economics, Aligarh Muslim University, India)
Abstract: Agriculture in India is at a crossroads and major challenge of the policy makers is to reverse the
trend of deceleration in agricultural growth which is directly associated with the declining of public investment
in agricultural research and development, fragmentation of holdings, lack of infrastructure and structured
markets, outdated technology and inappropriate input pricing policies of the government. The crisis of
agricultural stagnation needs immediate attention and treatment on the part of planners and policy makers.
Recognizing the continuous deceleration of agricultural growth, the present study attempts to analysis the trend
and growth of flow of credit to agriculture after 1991in India. The study based on secondary sources of data
compile from several sources, revealed that structure of credit outlets has witnessed a significant change and
commercial banks have emerged as the major source of institutional credit to agriculture in recent years, but
the declining share of investmental credit in total credit may constrain the sustainable growth of agriculture in
India. The situation calls for concrete efforts to augment the flow of credit to agriculture, alongside to exploring
the new innovations in the farming practices, product design and methods of delivery through better use of
technology and related processes. Facilitating credit through processor, NGO’s and input dealers that are
vertically integrated with farmers for providing them critical inputs or processing their produce, could increase
the credit flow to agriculture significantly.
Keywords: Institutional Credit, Agricultural Productivity, Sustainable Deployment and Inclusive
Growth
I. Introduction
Agriculture is still the lifeline and soul of majority of the people in India. Mahatma Gandhi, 1901
rightly said that “India lives in its villages”. A large proportion of the population in India is rural agricultural
and allied sector based and solely depends upon the agriculture for a livelihood creation. Therefore, an enhanced
and stable growth of the agriculture & allied sector is important, as it plays a vital role not only in generating
purchasing power among the rural population by creating on-farm and off-farm employment opportunities but
also through its contribution to livelihood creation and ensuring the price stability in the country as whole.
Although the share of agriculture in real GDP in India has been declined below one-fifth, but it continues to be
an important sector of economy as it employs around 52 per cent of the workforce. The growing adult
population in India demand large and incessant rise in agricultural production. Per capita availability of food,
particularly cereals and pulses, in recent years has fallen significantly. As a result, slackening growth of
agriculture during last decade has been a major policy concern.
The importance of farm credit as a critical input for agricultural growth in India is reinforced by the
unique and decisive role of Indian agriculture in the macroeconomic framework and poverty alleviation.
Recognizing the importance of agriculture sector in India‟s over all development, the Government and the
Reserve Bank of India (RBI) have played a vital role in creating a broad-based institutional framework for
catering to the increasing credit requirements of the sector. Most of Agricultural policies in India have been
reviewed from time to time to maintain pace with the changing requirements of the agriculture sector, which
forms an important segment of the priority sector lending of scheduled commercial banks (SCBs). The
Approach Paper to the Eleventh Five Year Plan in India has set a target of 4 per cent for the agriculture sector
within the overall GDP growth target of 9 per cent. In this context, the need for affordable, sufficient and timely
supply of institutional credit to agriculture has assumed critical importance. It is in this backdrop that the present
paper tries to find out the trend and growth of flow of credit to agriculture after 1991 in India. The entire paper
is divided into four segments. The second part explains the review of literature related to institutional credit in
India. The third part tries to explain the Assessment of Progress in Agricultural Credit in India. The fourth and
the last part are given to the concluding observations.
II. Review Of Literature:
Rosegrant and Evenson (1995) studied the total factor productivity and sources of long-term growth in
Indian agriculture using data envelopment analysis (DEA) a non-parametric technique. In this study Tornqvist-
Trend and Growth of Flow of Credit to Agriculture after 1991 in India
DOI: 10.9790/0837-2015161 www.iosrjournals.org 52 | Page
Theil TFP indices were computed for 271 districts which were covering around 13 states in India for the period
1956 to 1987. The study examines the sources of productivity growth, including public and private investment,
and estimates the rates of return to public investments in agriculture. The results showed that significant TFP
growth in the Indian crops sector was produced by investments -- primarily in research – but also in extension,
markets, and irrigation. It seems from study that the Government of India is not over investing in agricultural
research and extension which is important pillar for agriculture growth in India.
Sarbajit Chaudhuri (2001) studied the interaction of formal and informal credit markets in backward
agriculture using mathematical tools by establishing Nash equilibrium. The paper considers two alternative
ways of formulating a credit subsidy policy (1) through an increase in the aggregate volume of formal credit
supplied to the borrowers, keeping the formal sector interest rate at a reasonable level; and (2) through a
decrease in the rate of interest charged on this type credit. The paper shows that if a credit subsidy policy is
undertaken via the first path, it is actually able to lower the informal sector interest rate and improve both the
agriculture productivity and welfare of farmers.
Abhiman Das, Manjusha Senapati, Joice John (2009) studied the impact of agricultural credit on
agricultural production using econometric tools by estimating Arellano-Bond Regression. They use Dynamic
Panel Data Analysis with instrumental variables for the period 2001 to 2007. The analysis suggests that the
direct agriculture credit amount has a positive and statistically significant impact on agriculture output and its
effect is immediate. In particular, change in per capita agriculture direct credit (amount outstanding) by one per
cent will lead to increase in per capita agriculture output by 0.11 per cent. This shows a strong effect of direct
credit on agriculture output.
III. Assesment Of Progress In Agricultural Credit In India:
In India a multi-agency approach comprising co-operative banks, scheduled commercial banks and
RRBs has been followed for purveying credit to agricultural sector. The policy of agricultural credit is guided
mainly by the considerations of ensuring adequate and timely availability of credit at reasonable rates through
the expansion of institutional framework, its outreach and scale as also by way of directed lending. Over the
time, a spectacular progress has been achieved in terms of the scale and outreach of institutional framework for
agricultural credit.
1. Agricultural Credit Discernible Trend: in India one of the major achievements in the post-independent is
widening the spread of institutional machinery for credit and decline in the role of non-institutional sources,
notwithstanding some reversal in the trend observed particularly in the 1990s. The share of institutional credit,
which was little over 66.3% in 1991, increased manifold to over 68.8 per cent in 2010, reflecting concomitantly
a remarkable decline in the share of non institutional credit from around 30.6 per cent to about 29.7 per cent
during the same period (Table-1)
Table-1: Relative Share of Borrowing of Cultivator Households from Different Sources (Per cent)
Sources 1991 2002 2010
Non-institutional sources of which 30.6 38.9 29.7
Money Lenders 17.5 26.8 21.9
Institutional of which 66.3 61.3 68.8
Cooperative Societies/Banks 23.6 30.2 24.9
Commercial Banks 35.2 26.3 25.1
Unspecified 3.1 - 1.5
Total 100.0 100.0 100.0
Source: All India Debt and Investment Survey and NSSO.
In India the efforts to increase the flow of credit to agriculture seems to have yielded better results in
the recent years as the total institutional credit to agriculture recorded a growth of around 14 per cent during
1991-92 to 2008-09. In terms of total credit to agriculture, the commercial banks recorded a considerable growth
(from around 43 per cent to about 69 per cent), while cooperative banks registered a fall (over 52 per cent to
over 18 per cent) during the above period. There is a considerable increase in RRBs from five percent to 13 per
cent as shown in (Fig-1).
Trend and Growth of Flow of Credit to Agriculture after 1991 in India
DOI: 10.9790/0837-2015161 www.iosrjournals.org 53 | Page
Fig-1: Institutional framework
The Compound Annual Growth (CAGR) of loans issued through direct finance to agriculture and allied
activities witnessed a growth of 19.57% with a coefficient of variation C.V. of 100.29% from 1991 to 2010 from
all institutions. The highest growth was registered in case of RRBs (26.63%) and Scheduled commercial banks
(22.59%) over the period. On the other hand in case of loans outstanding to direct finance to agriculture and
allied activities, the CAGR of all institutional sources was calculated as 15.81% with a C.V as 85.58% from
1991 to 2010. The highest growth of outstanding credit was registered in case of RRBs (19.08%) and Scheduled
commercial banks (17.14%) over the period (table-2)
Table-2: Direct institutional credit for agriculture and allied activities Total (short term and long term) (Rs.
crore)
Year Loan Issued Loan Outstanding
Cooperat
ives
State
govts
SCBs RRBs Total
(2 to 5)
cooperatives SCBs RRBs Total
(7 to 9)
1 2 3 4 5 6 7 8 9 10
1990-91 4819 359 4676 335 10188 10531 17032 1753 29316
1991-92 5797 339 4806 596 11538 12176 16981 1984 31142
1992-93 6484 3389 4960 698 12530 13769 18288 2206 34263
1993-94 8484 377 5400 752 15013 15316 19113 2560 36988
1994-95 9876 407 7408 1083 18773 16810 20920 3009 40738
1995-96 12483 554 9274 1381 23692 19126 23427 3467 46020
1996-97 13254 668 10675 1748 26345 20556 26327 4038 50921
1997-98 14159 858 11537 2103 28656 21390 28445 4683 54518
1998-99 15099 420 14663 2515 32697 22199 29819 5389 57408
1999-00 25678 520 16350 2985 45534 41950 33442 5991 81383
2000-01 27295 487 16440 3966 48187 46135 38270 7249 91654
2001-02 30569 443 18638 4546 54195 52110 45106 8286 105502
2002-03 34040 - 25256 5879 65175 59064 53804 10261 123129
2003-04 40049 - 36203 7175 83427 71403 68103 11721 151228
2004-05 45009 - 48367 11927 105303 78822 95519 16709 191050
2005-06 48123 - 80599 15300 144021 82327 135603 21510 239439
2006-07 54019 - 115266 20228 189513 89443 169018 27452 285913
2007-08 57643 - 113472 23838 194953 65666 202796 33216 301678
2008-09 58787 - 160690 26499 245976 64045 256119 37367 357531
2009-10 74938 - 188263 34640 - 76480 315436 46282 -
CAGR 15.50 -1.59 22.59 26.63 19.57 12.69 17.14 19.08 15.81
S.D 21248.6 848.6 56162.2 10237.1 71561.7 27614.7 88534.4 13355.4 104031.5
C.V 724.45 115.45 125.79 121.73 100.29 62.81 109.74 104.69 85.58
SCBs: Scheduled Commercial Banks RRBs: Regional Rural Banks
Source: 1. Reserve Bank of India. S.D.(Standard Deviation) and C.V( Coefficient of Variation)
2. National Bank for agriculture and Rural Development
The Compound Annual Growth (CAGR) of loans issued through indirect finance to agriculture and
allied activities witnessed a growth of 30.91% with a coefficient of variation C.V. of 92.77% from 1991 to 2010
from all institutions. The highest growth was registered in case of a Scheduled commercial banks (40.81%) and
cooperatives (31.00%) over the period. On the other hand in case of loans outstanding to indirect finance to
agriculture and allied activities, the CAGR of all institutional sources was calculated as 24.32% with a C.V as
91.08% from 1991 to 2010. The highest growth of outstanding credit was registered in case of cooperatives
(28.67%) and Scheduled commercial banks (19.98%) over the period (table-3)
Trend and Growth of Flow of Credit to Agriculture after 1991 in India
DOI: 10.9790/0837-2015161 www.iosrjournals.org 54 | Page
Table-3: Indirect institutional credit for agriculture and allied activities total (short term and long term)
(Rs. crore)
SCBs: Scheduled Commercial Banks RRBs: Regional Rural Banks
Source: 1. Reserve Bank of India ( in Case of SCBs)
2. National Bank for Agriculture and Rural Development (in case of RRBs And cooperatives)
3. Rural Electrification Corporation Ltd. ( In Case of REC).
The Sectoral deployment of gross bank credit reveals that the share of agriculture since the second half of 1990s
has ranged between 11-12 per cent. As at end March 2010, the share agriculture sectoral deployment of gross
bank credit stood at around 13 per cent (Table-4).
Trend and Growth of Flow of Credit to Agriculture after 1991 in India
DOI: 10.9790/0837-2015161 www.iosrjournals.org 55 | Page
Table-4: Sectoral Deployment of Gross Bank Credit (Rupees crore)
Source: Report on Trend and Progress of Banking in India, Various issues.
2. Equity in Institutional Credit to Agriculture: In India a skewed distribution of institutional credit across
regions has been found to persist. In view of glaring disparities in the distribution of agricultural credit across
regions, it is argued that the benefits of institutional credit have largely accrued to the relatively prosperous
regions and richer sections within each region (Table-5). The extent of variations in the distribution of
institutional credit can be gauged from the fact that the institutional credit per hectare in 2007-08 in Assam (Rs
1979) was about one-eighth of the national average (Rs 15936) and about 3 per cent of Kerala (Rs 56890).
There seems to be a direct relationship between institutional credit flow and the level of agricultural
development. For instance the level of institutional credit is higher in states like Haryana (Rs 34012/ha), Kerala
(Rs 56890/ha), Punjab (Rs 46593/ha), Tamil Nadu (Rs 52427/ha), and low in states like Assam (Rs 1979/ha),
Bihar (Rs 8880/ha), Madhya Pradesh (Rs 9627/ha), Orissa (Rs 6370/ha), Rajasthan (Rs 6673/ha), etc
Table -5: Distribution of institutional agricultural credit across major states of India (Rs / ha)
States 1990-91 2000-01 2007-08
Andhra Pradesh 1120 4604 23441
Assam 54 311 1979
Bihar 233 1075 8880
Gujarat 501 2809 12626
Haryana 482 2964 34012
Himachal Pradesh 207 2555 19490
Jammu & Kashmir 191 764 7893
Karnataka 546 3432 15448
Kerala 2766 7666 56890
Madhya Pradesh 320 698 9627
Maharashtra 387 1352 12138
Orissa 319 479 6730
Punjab 856 5352 46593
Rajasthan 158 667 6673
Tamil Nadu 2857 9403 52427
Uttar Pradesh 376 1529 29065
West Bengal 329 1708 14025
Trend and Growth of Flow of Credit to Agriculture after 1991 in India
DOI: 10.9790/0837-2015161 www.iosrjournals.org 56 | Page
All India 549 2169 15936
Coefficient of variation 121.88 94.15 80.71
Source: Report of Advisory Committee on Flow of Credit to Agriculture and Related Activities from Banking
System, RBI, Mumbai, 2004.
However, the study reveals that the regional disparities in the distribution of institutional credit seem to
have declined over time in India. The coefficient of variation in the distribution of institutional credit across
states was 122 per cent in 1990-91 which declined to 94 in 2000-01 and further to 81per cent in 2007-08. But,
81 per cent is quite a significant level which reveals that the regional disparities in institutional credit flow do
exist and are still a part of rural credit system.
The distribution of institutional credit across farm-size categories is also skewed (Table-6). Though, the
majority of farmers (82%) in India possess less than two hectares of land, they together account for only 50 per
cent of the institutional credit; while18 per cent of the farmers having more than two hectares of land, account
for 49 per cent of the institutional credit. The skewed distribution of institutional credit in agriculture seems to
emanate from the skewed distribution of land. It may be mentioned that 18 per cent of these farmers operate
about 53 per cent of the total cultivable land in the country.
Table-6: Distribution of Direct Institutional Agricultural Credit by SCBs to farmers according to size of land
holdings short term and long term (Number of accounts in thousands; Amount in Rs. crores )
Source: RBI, Report on Currency and Finance (various issues)
The share of farmers having up to 2.5 acres of land, in total institutional credit has declined from 29.69
per cent in TE 1982-83 to 24.43 per cent in TE 2008-09. However, the share of farmers operating 2.5 to 5 acres
of land has increased from 21.60 per cent in TE 1982-83 to 23.73 per cent in TE 2008-09. The share of large
farmers, operating greater than 5 acres of land, in institutional credit has increased from 48.73 per cent in TE
1982-83 to 51.86per cent in TE 2008-09.
3. Progress in Kisan Credit Card Scheme: The Kisan Credit Card (KCC) Scheme was introduced in 1998-99
to facilitate farmers‟ access to short-term credit from the formal financial institutions. The credit under this
scheme is sanctioned in proportion to the size of owned land, but there is some flexibility for the farmers
cultivating leased-in land, in addition to their owned holding. The KCC scheme has made a rapid progress and
till 31 March, 2009, about 80.8 million KCCs have been issued by the co-operative banks, commercial banks
and RRBs (Table-7). The share of co-operative banks and commercial banks in distribution of KCCs was 44 per
cent and 43 per cent, respectively; the remaining 14 per cent was issued by RRBs. The growth in distribution of
KCCs has been phenomenal. The distribution of KCCs grew at the rate of 44 per cent per annum; the highest
growth rate (75%) was witnessed by RRBs. The distribution of KCCs by cooperative banks grew at the rate of
46 per cent per annum during this period. The KCCs issued by the commercial banks witnessed an annual
growth rate of 42 per cent during this period.
Table-7: Progress in the Distribution of Kisan Credit Cards (Agency-wise)
Year Cooperative Banks Regional Rural Banks Scheduled Commercial Banks Total
1998-99 0.16 0.01 0.62 0.78
1999-00 3.75 0.18 1.99 5.91
2000-01 9.36 0.83 5.38 14.56
2001-02 14.8 1.66 8.45 23.90
2002-03 19.38 2.62 11.15 32.14
2003-04 24.26 3.89 14.24 41.39
2004-05 27.82 5.62 18.64 51.07
Trend and Growth of Flow of Credit to Agriculture after 1991 in India
DOI: 10.9790/0837-2015161 www.iosrjournals.org 57 | Page
2005-06 30.42 6.87 22.8 59.08
2006-07 32.72 8.28 27.61 67.59
2007-08 34.81 10.05 32.21 76.05
2008-09 35.87 11.26 33.67 80.80
Share In Total 44.39 13.894 41.67 100
CAGR (%) 45.87 75.27 42.12 44.25
Source: NABARD and Economic Survey
The higher growth rate witnessed in the distribution of KCCs is reflected in higher density of KCCs.
On an average, two-thirds of the farming households possess KCCs in India. However, the distribution of KCCs
has depicted a significant variation across states. The distribution of KCCs and its intensity in terms of per unit
farming household and per unit farm size is presented in (Table-8).
Table-8: State-wise Distribution of Kisan Credit Cards: 2008
Source: NABARD and Agriculture CensusDivision Ministry Of agriculture, New Delhi
The highest intensity in distribution of KCCs was observed in Punjab (2.02). The distribution of KCCs
was more than two-times the number of operating households in Punjab. Some other states which have
distributed more number of KCCs than the number of farming households are: Haryana (1.44), Andhra Pradesh
(1.06) and Orissa (1.04). The performance of states like Assam, Bihar, Himachal Pradesh and Jammu &
Kashmir in distribution of KCCs has been dismal. For instance, only 5 per cent of the farming households in
Jammu & Kashmir and 13 per cent in Assam have obtained KCCs. In Bihar and Himachal Pradesh, only about
one-fourth of the farming households have received KCCs. The density of KCCs in terms of operational area
varied from 0.07 / ha in Jammu & Kashmir to 1.76 / ha in Kerala.
4. Agricultural Production: Since agriculture forms the resource base for a number of agro-based industries
and agro-services, it would be more meaningful to view agriculture not as farming alone but as a holistic value
chain, which includes farming, wholesaling, warehousing (including logistics), processing, and retailing.
Further, it may be noted that in the last two Five Year Plans, it is clearly mentioned that for the economy to
grow at 9 per cent, it is important that agriculture should grow at least by 4 per cent per annum. Achieving an 8-
9 percent rate of growth in overall GDP may not deliver much in terms of poverty reduction unless agricultural
growth accelerates. At the same time „growth with inclusiveness‟ can be achieved only when agriculture growth
accelerates and is also widely shared amongst people and regions of the country.
5. Growth Performance of Agriculture: The growth performance of the agriculture sector has been fluctuating
across the plan periods (Fig-2). It witnessed a growth rate of 4.8 per cent during the Eighth plan period (1992–
97). However, the agrarian situation saw a downturn towards the beginning of the Ninth plan period (1997–
2002) and the Tenth plan period (2002–07), when the agricultural growth rate came down to 2.5 percent and 2.4
percent respectively. This crippling growth rate of 2.4 percent in agriculture as against a robust annual average
overall growth rate of 7.6 per cent for the economy during the tenth plan period was clearly a cause for concern.
The trend rate of growth during the period 1992-93 to 2010-11 is 2.8 percent while the average annual rate of
growth in agriculture & allied sectors-GDP during the same period is 3.2 percent.
States No. Of KCCs Issued
(millions)
Intensity of KCC
No/Households No/Hectors
Andhra Pradesh 12.17 1.06 0.85
Assam 0.34 0.13 0.11
Bihar 3.06 0.26 0.45
Gujarat 2.46 0.58 0.25
Haryana 2.19 1.44 0.62
Himachal Pradesh 0.25 0.28 0.26
Jammu And Kashmir 0.07 0.05 0.07
Karnataka 4.21 0.59 0.34
Kerala 2.76 0.42 1.76
Madhya Pradesh 5.90 0.56 0.27
Maharashtra 7.19 0.59 0.36
Orissa 4.22 1.04 0.83
Junjab 2.02 2.02 0.50
Rajasthan 4.37 0.75 0.21
Tamil Nadu 4.87 0.62 0.70
Utter Pradesh 14.62 0.65 0.78
West Bengal 2.69 0.40 0.49
All India 80.80 0.67 0.51
Trend and Growth of Flow of Credit to Agriculture after 1991 in India
DOI: 10.9790/0837-2015161 www.iosrjournals.org 58 | Page
Fig.-2: Growth Rates: GDP (overall) and GDP (Agriculture & Allied Sectors)
Note: * Figures for the Eleventh Plan show growth rates for the first four years of the Plan. Source: CSO.
The Eleventh Plan had sought to reverse the deceleration of agricultural growth which occurred in the
Ninth Plan and continued into the Tenth Plan. It has some success in that foodgrain production touched a new
peak of 250.42 million tonnes in2011-12. Agricultural GDP growth has accelerated to an average 3.9 percent
growth during 2005-06 to 2010-11, partly because of initiatives taken since 2004. The increasing divergence
between the growth trends of the total economy and that of agriculture & allied sectors suggests an under
performance by agriculture (Fig-3). It is also significant that unlike the overall economic growth pattern,
agricultural performance in India has been quite volatile (the Coefficient of Variation (CV) during 2000-01 to
2010-11 was 1.6 compared to 1.1 during 1992-93 to 1999-2000).
Fig-3: Comparative Performance of Growth of GDP and Agriculture GDP
Note: Figures are at 2004-05 prices.
Source: CSO.
6. Regional Variations in Growth: The Indian agriculture growth pattern has been highly varied at the state
level. Since agriculture is a state subject, the overall performance of the agriculture sector in India largely
depends on what occurs at the state level. There is a wide variation in the performance of different states. During
2000-01 to 2008-09, the growth performance of agriculture in Rajasthan (8.2%), Gujarat (7.7%) and Bihar
(7.1%) was much higher than that of Uttar Pradesh (2.3%) and West Bengal (2.4%). The recent dynamics of
erstwhile poor performing states like Orissa, Chhattisgarh and Himachal Pradesh showing strong growth in
agriculture can be seen from Fig.-4& fig-5
Fig.-4: Average Annual Growth Rate (%) of Gross State Domestic Product from Agriculture & Allied
Sector, 1994-95 to 1999-2000
Source: CSO.
Note: GSDP estimates are at 1993-94 prices
Trend and Growth of Flow of Credit to Agriculture after 1991 in India
DOI: 10.9790/0837-2015161 www.iosrjournals.org 59 | Page
Fig.-5: Average Annual Growth Rate (%) of Gross State Domestic Product from Agriculture & Allied
Sector, 2000-01 to 2008-09
Source: CSO.
Note: GSDP estimates are at 1999-2000 prices.
7. Crop-Specific Growth: During 2010-11, foodgrains production was 244.78 million tonnes, comprising of
121.14 million tonnes during Kharif season and 123.64 million tonnes during the Rabi season. As per 2nd
advance estimates for 2011-12, total foodgrains productions estimated at a record level of 250.42 million tonnes
which is 5.64 million tonnes higher than that of the last year production. Production of rice is estimated at
102.75 million tonnes, Wheat 88.31 million tonnes, coarse cereals 42.08 million tonnes and pulses 17.28 million
tonnes. Oilseeds production during 2011-12 is estimated at 30.53 million tonnes, sugarcane production is
estimated at 347.87 million tonnes and cotton production is estimated at 34.09million bales (of 170 kg. each).
Jute production has been estimated at 10.95 million bales (of 180 kg each).
Growth in the production of agricultural crops depends upon acreage and yield. Given the limitations in the
expansion of acreage, the main source of long-term output growth is improvement in yields. A comparative
picture in average annual growth rates of area, production, and yield of different crops for two periods 1990-91
to 1999-2000 and 2000-01 to 2010-11 is given in Table-9.
Table -9: All India Average Annual Growth Rates of Area, Production and Yield of Principal Crops (%)
Crops/Crop Groups 1990-91 to 1999-2000 2000-01 to2010-11
A P Y A P Y
Rice 0.70 2.09 1.36 -0.39 1.32 1.47
Wheat 1.62 4.52 2.87 0.57 1.39 0.73
Maize 0.85 2.24 1.37 2.68 7.12 4.13
Coarse Cereals -2.42 -0.08 2.03 -0.13 5.0 4.64
Total cereals -0.12 2.29 2.38 -0.09 1.82 1.69
Gram 0.88 3.86 2.97 4.31 6.39 1.19
Tur -0.45 1.89 2.03 2.58 1.89 -0.65
Total Pulses -0.91 1.06 1.82 2.30 4.02 1.21
Total Food Grains -0.27 2.19 2.43 0.34 1.95 1.37
Groundnut -2.25 -2.40 -0.30 -1.08 13.13 12.76
R&M 2.28 4.82 2.96 2.76 6.26 2.72
Soya bean 11.01 16.37 4.67 4.15 8.31 4.17
Oilseeds 0.75 2.53 1.76 1.27 7.00 5.18
Sugarcane 2.25 3.16 0.91 1.95 2.12 0.03
cotton 1.42 0.93 -0.54 2.66 12.12 9.15
Note: A: Area, P: Production, Y: Yield
Source: Directorate of Economics & Statistics, Ministry of Agriculture.
In the case of wheat, the growth in area and yield have been marginal during 2000-01 to 2010-11
suggesting that the yield levels have plateau for this crop. This suggests the need for renewed research to boost
production and productivity. All the major coarse cereals display a negative growth in area during both the
periods except for maize, which recorded an annual growth rate of 2.68 per cent in the 2000-01 to 2010-11
periods. In pulses, gram recorded a growth of 6.39 percent in production during the same period driven by
expansion in the area under cultivation. Soybean has recorded a high rate of growth in production in both the
periods, driven primarily by expansion in area under cultivation.
IV. Conclusion And Policy Recamendations
To conclude it can be said that the provision of extending formal credit to agriculture should be the
central to the concern of policy makers, planners and development economists, because the significance of
agriculture sector in India is not restricted to its contribution to GDP, employment and livelihood creation only,
but on account of its complementarily with other sectors of the economy. It has far reaching ability to impact
Trend and Growth of Flow of Credit to Agriculture after 1991 in India
DOI: 10.9790/0837-2015161 www.iosrjournals.org 60 | Page
poverty alleviation and rural development of the economy. There are several areas of importance for the
agriculture sector growth. These include, among others, enhancing public sector investment in research apart
from effective transfer of technology along with institutional reforms in the research set up to make it more
accountable and geared towards delivery, conservation of land, water and biological resources, the development
of rainfed agriculture, the development of minor irrigation, timely and adequate availability of inputs, support
for marketing infrastructure, an increase in flow of credit particularly to the small and marginal farmers of the
economy.
1. Major Findings of the Study
1. The share of institutional credit, which was little over 66.3% in 1991, increased manifold to over 68.8 per
cent in 2010, reflecting concomitantly a remarkable decline in the share of non institutional credit from
around 30.6 per cent to about 29.7 per cent.
2. A skewed distribution of institutional credit across regions has been found to persist. In view of glaring
disparities in the distribution of agricultural credit across regions, it is argued that the benefits of
institutional credit have largely accrued to the relatively prosperous regions and richer sections within each
region.
3. Agriculture witnessed a growth rate of 4.8 per cent during the Eighth plan period (1992–97). However, the
agrarian situation saw a downturn towards the beginning of the Ninth plan period (1997–2002) and the
Tenth plan period (2002–07), when the agricultural growth rate came down to 2.5 percent and 2.4 percent
respectively. This crippling growth rate of 2.4 percent in agriculture as against a robust annual average
overall growth rate of 7.6 per cent for the economy during the tenth plan period was clearly a cause for
concern.
4. The increasing divergence between the growth trends of the total economy and that of agriculture & allied
sectors suggests an under performance by agriculture. It is also significant that unlike the overall economic
growth pattern, agricultural performance in India has been quite volatile (the Coefficient of Variation (CV)
during 2000-01 to 2010-11 was 1.6 compared to 1.1 during 1992-93 to 1999-2000).
2. Policy Recommendations: in India several committees in the recent past have come out with many
suggestions and policy recommendations to improve the flow of institutional credit in rural areas. These include
Expert Committee on Rural Credit (V.S. Vyas), Committee on Agricultural Credit though Commercial Banks
(R.V. Gupta), Committee on Cooperatives (Vikhe Patil), and Advisory Committee on Flow of Credit to
Agriculture (V.S. Vyas) etc. The government has implemented several of the suggestions made by these
committees. However, based on the analysis of current status and identification of concerns in the study, some
suggestions are as follows:
1. As the basic problem with rural borrowers is of repayment, efforts should be made to provide a complete
package consisting of both financial and non-financial help to the borrowers to make the best use of credit,
improve their repayment capacity.
2. Bank officials should try to maintain personal relationship with the borrowers and also motivate them to
enhance their earnings and repayment of loans.
3. In case of term-loans, necessary arrangement should be made to provide working capital finance which is
necessary to make the investment productive.
4. Procedure for loan disbursement could be made simple so that it may not be difficult for the less-educated
and illiterate households to access institutional financing agencies for credit
5. It has been observed that the incidence of overdue in the rural credit system has been increasing over the
years and has been steadily eroding the financial soundness of the system. There is an urgent need to check
overdues and nonperforming assets (NPAs) to improve recovery performance of RFIs.
References
[1]. Rosegrant Mark W. and Robert E. Evenson. (1995), “Total Factor Productivity And Sources Of Long- Term Growth In Indian
Agriculture” EPTD Discussion Paper No. 7, Environment and Production Technology Division, International Food Policy Research
Institute, 1200 Seventeenth Street, N.W.Washington, D.C. 20036-3006 U.S.A.
[2]. Sarbajit Chaudhuri (2001), “Interaction of Formal and Informal Credit Markets in Backward Agriculture: A Theoretical Analysis”
Indian Economic Review, Vol. XXXVI, No.2, pp.411-428
[3]. Renuka Mahadevan (2003), “ Productivity Growth in India Agriculture, The Role of Globalization and Economic Reform”Asia-
Pacific Development Journal Vol. 10, No. 2,
[4]. Reserve Bank of India (2004), “Report of the Advisory Committee on Flow of Credit to Agriculture and Related Activities From
the Banking System”. URL:(www.rbi.org.in)
[5]. Gagan Bihari Sahu (2007), “Supply Analysis of Institutional Credit to agriculture for Major States in India” Indian journal of
agriculture economics Vol. 62 No. 4, Oct-Dec.2007
[6]. Abhiman Das, Manjusha Senapati, Joice John (2009), “Impact of Agricultural Credit on Agriculture Production: An Empirical
Analysis in India” Reserve Bank of India Occasional Papers Vol. 30, No.2, Monsoon 2009.
Trend and Growth of Flow of Credit to Agriculture after 1991 in India
DOI: 10.9790/0837-2015161 www.iosrjournals.org 61 | Page
[7]. Devaraja T.S. May (2011), “An Analysis of Institutional Financing and Agricultural Credit Policy in India” Post Graduate
Department of Commerce University of Mysore Hassan, India.
[8]. State of Indian Agriculture Government of India (2012-13), “Ministry of Agriculture Department of Agriculture and Cooperation
Directorate of Economics and Statistics New Delhi.

Mais conteúdo relacionado

Mais procurados

FINANCE_Ahana Sarkar_Role of Rural Credit in Indian Perspective.
FINANCE_Ahana Sarkar_Role of Rural Credit in Indian Perspective.FINANCE_Ahana Sarkar_Role of Rural Credit in Indian Perspective.
FINANCE_Ahana Sarkar_Role of Rural Credit in Indian Perspective.
Ahana Sarkar
 

Mais procurados (20)

Macroeconomics Role Of Institutional Credit For Economic Growth
Macroeconomics   Role Of Institutional Credit For Economic GrowthMacroeconomics   Role Of Institutional Credit For Economic Growth
Macroeconomics Role Of Institutional Credit For Economic Growth
 
Agriculture finance
Agriculture financeAgriculture finance
Agriculture finance
 
Agricultural credit
Agricultural creditAgricultural credit
Agricultural credit
 
FINANCE_Ahana Sarkar_Role of Rural Credit in Indian Perspective.
FINANCE_Ahana Sarkar_Role of Rural Credit in Indian Perspective.FINANCE_Ahana Sarkar_Role of Rural Credit in Indian Perspective.
FINANCE_Ahana Sarkar_Role of Rural Credit in Indian Perspective.
 
Chapter 1 Introduction, Scope and Nature of Agricultural finance
Chapter 1 Introduction, Scope and Nature of Agricultural financeChapter 1 Introduction, Scope and Nature of Agricultural finance
Chapter 1 Introduction, Scope and Nature of Agricultural finance
 
Agricultural finance
Agricultural financeAgricultural finance
Agricultural finance
 
Agriculture financing
Agriculture financingAgriculture financing
Agriculture financing
 
Agricultural finance ;
Agricultural finance ; Agricultural finance ;
Agricultural finance ;
 
Role of Rural Finance Institution in Agriculture Development
Role of Rural Finance Institution in Agriculture DevelopmentRole of Rural Finance Institution in Agriculture Development
Role of Rural Finance Institution in Agriculture Development
 
Unit 1 regional rural banks
Unit 1  regional rural banksUnit 1  regional rural banks
Unit 1 regional rural banks
 
Rural Finance Study | Finance Presence in Rural India By RC&M India
Rural Finance Study | Finance Presence in Rural India By RC&M IndiaRural Finance Study | Finance Presence in Rural India By RC&M India
Rural Finance Study | Finance Presence in Rural India By RC&M India
 
agriculture_credit
agriculture_creditagriculture_credit
agriculture_credit
 
Agriculture credit
Agriculture creditAgriculture credit
Agriculture credit
 
Rural Banking J.D Lamba
Rural Banking J.D LambaRural Banking J.D Lamba
Rural Banking J.D Lamba
 
Prioritysector by akshay sonone
Prioritysector by akshay sononePrioritysector by akshay sonone
Prioritysector by akshay sonone
 
Rural Financial Markets and Agricultural Credit
Rural Financial Markets and Agricultural CreditRural Financial Markets and Agricultural Credit
Rural Financial Markets and Agricultural Credit
 
Importance of agricultural credit on productivity
Importance of agricultural credit on productivityImportance of agricultural credit on productivity
Importance of agricultural credit on productivity
 
Ppt
PptPpt
Ppt
 
Agricultural finance
Agricultural financeAgricultural finance
Agricultural finance
 
Rural Banking in India
Rural Banking in IndiaRural Banking in India
Rural Banking in India
 

Destaque

The farmers development in credit structure vis à-vis indian
The farmers development in credit structure vis à-vis indianThe farmers development in credit structure vis à-vis indian
The farmers development in credit structure vis à-vis indian
firosfebinf
 
Chapter 10 key 1
Chapter 10 key 1Chapter 10 key 1
Chapter 10 key 1
montathomas
 

Destaque (16)

The farmers development in credit structure vis à-vis indian
The farmers development in credit structure vis à-vis indianThe farmers development in credit structure vis à-vis indian
The farmers development in credit structure vis à-vis indian
 
Chapter 10 key 1
Chapter 10 key 1Chapter 10 key 1
Chapter 10 key 1
 
Agriculture Sector in India, Indian Agriculture Industry
Agriculture Sector in India, Indian Agriculture IndustryAgriculture Sector in India, Indian Agriculture Industry
Agriculture Sector in India, Indian Agriculture Industry
 
Introduction in Agriculture
Introduction in AgricultureIntroduction in Agriculture
Introduction in Agriculture
 
Input subsidies vs farm machinary
Input subsidies vs farm machinaryInput subsidies vs farm machinary
Input subsidies vs farm machinary
 
Agriculture and its history
Agriculture and its historyAgriculture and its history
Agriculture and its history
 
The Origin of Agriculture
The Origin of AgricultureThe Origin of Agriculture
The Origin of Agriculture
 
Agri Input marketing
Agri Input marketingAgri Input marketing
Agri Input marketing
 
Rural Banking
Rural BankingRural Banking
Rural Banking
 
Agricultural Economics
Agricultural EconomicsAgricultural Economics
Agricultural Economics
 
Introduction to agricultural economics
Introduction to agricultural economicsIntroduction to agricultural economics
Introduction to agricultural economics
 
Intro to agriculture
Intro to agricultureIntro to agriculture
Intro to agriculture
 
Is post 1991 Economic Development In India skewed?
Is post 1991 Economic Development In India skewed?Is post 1991 Economic Development In India skewed?
Is post 1991 Economic Development In India skewed?
 
agriculture ( ppt made by akshit.manhas)
agriculture ( ppt made by akshit.manhas)agriculture ( ppt made by akshit.manhas)
agriculture ( ppt made by akshit.manhas)
 
agriculture ppt
 agriculture ppt agriculture ppt
agriculture ppt
 
Rural finance
Rural financeRural finance
Rural finance
 

Semelhante a Trend and Growth of Flow of Credit to Agriculture after 1991 in India

FINANCIAL INCLUSION A RETROSPECTIVE APPRAISAL
 FINANCIAL INCLUSION A RETROSPECTIVE APPRAISAL FINANCIAL INCLUSION A RETROSPECTIVE APPRAISAL
FINANCIAL INCLUSION A RETROSPECTIVE APPRAISAL
Dr Lendy Spires
 
Exploring the Luxury Clusters of India
Exploring the Luxury Clusters of IndiaExploring the Luxury Clusters of India
Exploring the Luxury Clusters of India
Indicus Analytics Private Limited
 
Epgp (one year) 2009-10_mos_ assignment_#1_5jan10
Epgp (one year) 2009-10_mos_ assignment_#1_5jan10Epgp (one year) 2009-10_mos_ assignment_#1_5jan10
Epgp (one year) 2009-10_mos_ assignment_#1_5jan10
Rajendra Inani
 
PJHSS, Volume 3, No. 1, 3
PJHSS, Volume 3, No. 1, 3PJHSS, Volume 3, No. 1, 3
PJHSS, Volume 3, No. 1, 3
asad saif
 

Semelhante a Trend and Growth of Flow of Credit to Agriculture after 1991 in India (20)

Labour in Indian Agriculture: A Growing Challenge
Labour in Indian Agriculture: A Growing ChallengeLabour in Indian Agriculture: A Growing Challenge
Labour in Indian Agriculture: A Growing Challenge
 
Impact of Institutional Credit on Agriculture Production in Pakistan
Impact of Institutional Credit on Agriculture Production in PakistanImpact of Institutional Credit on Agriculture Production in Pakistan
Impact of Institutional Credit on Agriculture Production in Pakistan
 
Kishan
KishanKishan
Kishan
 
Developing Rural Finance In India
Developing Rural Finance In IndiaDeveloping Rural Finance In India
Developing Rural Finance In India
 
International Journal of Business and Management Invention (IJBMI)
International Journal of Business and Management Invention (IJBMI)International Journal of Business and Management Invention (IJBMI)
International Journal of Business and Management Invention (IJBMI)
 
12 chapter 3
12 chapter 312 chapter 3
12 chapter 3
 
FINANCIAL INCLUSION A RETROSPECTIVE APPRAISAL
 FINANCIAL INCLUSION A RETROSPECTIVE APPRAISAL FINANCIAL INCLUSION A RETROSPECTIVE APPRAISAL
FINANCIAL INCLUSION A RETROSPECTIVE APPRAISAL
 
Loan and indian economy
Loan and indian economyLoan and indian economy
Loan and indian economy
 
Role of Banks on Agricultural Development in Bangladesh
Role of Banks on Agricultural Development in BangladeshRole of Banks on Agricultural Development in Bangladesh
Role of Banks on Agricultural Development in Bangladesh
 
Microfinance and strategy of financial inclusion in india
Microfinance and strategy of financial inclusion in indiaMicrofinance and strategy of financial inclusion in india
Microfinance and strategy of financial inclusion in india
 
Demographic profile of INDIA - Opportunity or Threat
Demographic profile of INDIA - Opportunity or ThreatDemographic profile of INDIA - Opportunity or Threat
Demographic profile of INDIA - Opportunity or Threat
 
A CONCEPTUAL FRAMEWORK FOR RURAL EMPLOYMENT GENERATION IN INDIA
A CONCEPTUAL FRAMEWORK FOR RURAL EMPLOYMENT GENERATION IN INDIAA CONCEPTUAL FRAMEWORK FOR RURAL EMPLOYMENT GENERATION IN INDIA
A CONCEPTUAL FRAMEWORK FOR RURAL EMPLOYMENT GENERATION IN INDIA
 
Exploring the Luxury Clusters of India
Exploring the Luxury Clusters of IndiaExploring the Luxury Clusters of India
Exploring the Luxury Clusters of India
 
Growth vs development ( by Karan & Group)
Growth vs development ( by Karan & Group)Growth vs development ( by Karan & Group)
Growth vs development ( by Karan & Group)
 
Growth vs development in Indian perspective
Growth vs development in Indian perspectiveGrowth vs development in Indian perspective
Growth vs development in Indian perspective
 
Challenges for rbi
Challenges for  rbiChallenges for  rbi
Challenges for rbi
 
Epgp (one year) 2009-10_mos_ assignment_#1_5jan10
Epgp (one year) 2009-10_mos_ assignment_#1_5jan10Epgp (one year) 2009-10_mos_ assignment_#1_5jan10
Epgp (one year) 2009-10_mos_ assignment_#1_5jan10
 
PJHSS, Volume 3, No. 1, 3
PJHSS, Volume 3, No. 1, 3PJHSS, Volume 3, No. 1, 3
PJHSS, Volume 3, No. 1, 3
 
FMCG Industry Analysis
FMCG Industry AnalysisFMCG Industry Analysis
FMCG Industry Analysis
 
Odisha agricultural system
Odisha agricultural systemOdisha agricultural system
Odisha agricultural system
 

Mais de iosrjce

Mais de iosrjce (20)

An Examination of Effectuation Dimension as Financing Practice of Small and M...
An Examination of Effectuation Dimension as Financing Practice of Small and M...An Examination of Effectuation Dimension as Financing Practice of Small and M...
An Examination of Effectuation Dimension as Financing Practice of Small and M...
 
Does Goods and Services Tax (GST) Leads to Indian Economic Development?
Does Goods and Services Tax (GST) Leads to Indian Economic Development?Does Goods and Services Tax (GST) Leads to Indian Economic Development?
Does Goods and Services Tax (GST) Leads to Indian Economic Development?
 
Childhood Factors that influence success in later life
Childhood Factors that influence success in later lifeChildhood Factors that influence success in later life
Childhood Factors that influence success in later life
 
Emotional Intelligence and Work Performance Relationship: A Study on Sales Pe...
Emotional Intelligence and Work Performance Relationship: A Study on Sales Pe...Emotional Intelligence and Work Performance Relationship: A Study on Sales Pe...
Emotional Intelligence and Work Performance Relationship: A Study on Sales Pe...
 
Customer’s Acceptance of Internet Banking in Dubai
Customer’s Acceptance of Internet Banking in DubaiCustomer’s Acceptance of Internet Banking in Dubai
Customer’s Acceptance of Internet Banking in Dubai
 
A Study of Employee Satisfaction relating to Job Security & Working Hours amo...
A Study of Employee Satisfaction relating to Job Security & Working Hours amo...A Study of Employee Satisfaction relating to Job Security & Working Hours amo...
A Study of Employee Satisfaction relating to Job Security & Working Hours amo...
 
Consumer Perspectives on Brand Preference: A Choice Based Model Approach
Consumer Perspectives on Brand Preference: A Choice Based Model ApproachConsumer Perspectives on Brand Preference: A Choice Based Model Approach
Consumer Perspectives on Brand Preference: A Choice Based Model Approach
 
Student`S Approach towards Social Network Sites
Student`S Approach towards Social Network SitesStudent`S Approach towards Social Network Sites
Student`S Approach towards Social Network Sites
 
Broadcast Management in Nigeria: The systems approach as an imperative
Broadcast Management in Nigeria: The systems approach as an imperativeBroadcast Management in Nigeria: The systems approach as an imperative
Broadcast Management in Nigeria: The systems approach as an imperative
 
A Study on Retailer’s Perception on Soya Products with Special Reference to T...
A Study on Retailer’s Perception on Soya Products with Special Reference to T...A Study on Retailer’s Perception on Soya Products with Special Reference to T...
A Study on Retailer’s Perception on Soya Products with Special Reference to T...
 
A Study Factors Influence on Organisation Citizenship Behaviour in Corporate ...
A Study Factors Influence on Organisation Citizenship Behaviour in Corporate ...A Study Factors Influence on Organisation Citizenship Behaviour in Corporate ...
A Study Factors Influence on Organisation Citizenship Behaviour in Corporate ...
 
Consumers’ Behaviour on Sony Xperia: A Case Study on Bangladesh
Consumers’ Behaviour on Sony Xperia: A Case Study on BangladeshConsumers’ Behaviour on Sony Xperia: A Case Study on Bangladesh
Consumers’ Behaviour on Sony Xperia: A Case Study on Bangladesh
 
Design of a Balanced Scorecard on Nonprofit Organizations (Study on Yayasan P...
Design of a Balanced Scorecard on Nonprofit Organizations (Study on Yayasan P...Design of a Balanced Scorecard on Nonprofit Organizations (Study on Yayasan P...
Design of a Balanced Scorecard on Nonprofit Organizations (Study on Yayasan P...
 
Public Sector Reforms and Outsourcing Services in Nigeria: An Empirical Evalu...
Public Sector Reforms and Outsourcing Services in Nigeria: An Empirical Evalu...Public Sector Reforms and Outsourcing Services in Nigeria: An Empirical Evalu...
Public Sector Reforms and Outsourcing Services in Nigeria: An Empirical Evalu...
 
Media Innovations and its Impact on Brand awareness & Consideration
Media Innovations and its Impact on Brand awareness & ConsiderationMedia Innovations and its Impact on Brand awareness & Consideration
Media Innovations and its Impact on Brand awareness & Consideration
 
Customer experience in supermarkets and hypermarkets – A comparative study
Customer experience in supermarkets and hypermarkets – A comparative studyCustomer experience in supermarkets and hypermarkets – A comparative study
Customer experience in supermarkets and hypermarkets – A comparative study
 
Social Media and Small Businesses: A Combinational Strategic Approach under t...
Social Media and Small Businesses: A Combinational Strategic Approach under t...Social Media and Small Businesses: A Combinational Strategic Approach under t...
Social Media and Small Businesses: A Combinational Strategic Approach under t...
 
Secretarial Performance and the Gender Question (A Study of Selected Tertiary...
Secretarial Performance and the Gender Question (A Study of Selected Tertiary...Secretarial Performance and the Gender Question (A Study of Selected Tertiary...
Secretarial Performance and the Gender Question (A Study of Selected Tertiary...
 
Implementation of Quality Management principles at Zimbabwe Open University (...
Implementation of Quality Management principles at Zimbabwe Open University (...Implementation of Quality Management principles at Zimbabwe Open University (...
Implementation of Quality Management principles at Zimbabwe Open University (...
 
Organizational Conflicts Management In Selected Organizaions In Lagos State, ...
Organizational Conflicts Management In Selected Organizaions In Lagos State, ...Organizational Conflicts Management In Selected Organizaions In Lagos State, ...
Organizational Conflicts Management In Selected Organizaions In Lagos State, ...
 

Último

Asymmetry in the atmosphere of the ultra-hot Jupiter WASP-76 b
Asymmetry in the atmosphere of the ultra-hot Jupiter WASP-76 bAsymmetry in the atmosphere of the ultra-hot Jupiter WASP-76 b
Asymmetry in the atmosphere of the ultra-hot Jupiter WASP-76 b
Sérgio Sacani
 
Pests of cotton_Sucking_Pests_Dr.UPR.pdf
Pests of cotton_Sucking_Pests_Dr.UPR.pdfPests of cotton_Sucking_Pests_Dr.UPR.pdf
Pests of cotton_Sucking_Pests_Dr.UPR.pdf
PirithiRaju
 
Biogenic Sulfur Gases as Biosignatures on Temperate Sub-Neptune Waterworlds
Biogenic Sulfur Gases as Biosignatures on Temperate Sub-Neptune WaterworldsBiogenic Sulfur Gases as Biosignatures on Temperate Sub-Neptune Waterworlds
Biogenic Sulfur Gases as Biosignatures on Temperate Sub-Neptune Waterworlds
Sérgio Sacani
 
Conjugation, transduction and transformation
Conjugation, transduction and transformationConjugation, transduction and transformation
Conjugation, transduction and transformation
Areesha Ahmad
 

Último (20)

Connaught Place, Delhi Call girls :8448380779 Model Escorts | 100% verified
Connaught Place, Delhi Call girls :8448380779 Model Escorts | 100% verifiedConnaught Place, Delhi Call girls :8448380779 Model Escorts | 100% verified
Connaught Place, Delhi Call girls :8448380779 Model Escorts | 100% verified
 
Dubai Call Girls Beauty Face Teen O525547819 Call Girls Dubai Young
Dubai Call Girls Beauty Face Teen O525547819 Call Girls Dubai YoungDubai Call Girls Beauty Face Teen O525547819 Call Girls Dubai Young
Dubai Call Girls Beauty Face Teen O525547819 Call Girls Dubai Young
 
GBSN - Microbiology (Unit 1)
GBSN - Microbiology (Unit 1)GBSN - Microbiology (Unit 1)
GBSN - Microbiology (Unit 1)
 
Asymmetry in the atmosphere of the ultra-hot Jupiter WASP-76 b
Asymmetry in the atmosphere of the ultra-hot Jupiter WASP-76 bAsymmetry in the atmosphere of the ultra-hot Jupiter WASP-76 b
Asymmetry in the atmosphere of the ultra-hot Jupiter WASP-76 b
 
Locating and isolating a gene, FISH, GISH, Chromosome walking and jumping, te...
Locating and isolating a gene, FISH, GISH, Chromosome walking and jumping, te...Locating and isolating a gene, FISH, GISH, Chromosome walking and jumping, te...
Locating and isolating a gene, FISH, GISH, Chromosome walking and jumping, te...
 
9654467111 Call Girls In Raj Nagar Delhi Short 1500 Night 6000
9654467111 Call Girls In Raj Nagar Delhi Short 1500 Night 60009654467111 Call Girls In Raj Nagar Delhi Short 1500 Night 6000
9654467111 Call Girls In Raj Nagar Delhi Short 1500 Night 6000
 
Vip profile Call Girls In Lonavala 9748763073 For Genuine Sex Service At Just...
Vip profile Call Girls In Lonavala 9748763073 For Genuine Sex Service At Just...Vip profile Call Girls In Lonavala 9748763073 For Genuine Sex Service At Just...
Vip profile Call Girls In Lonavala 9748763073 For Genuine Sex Service At Just...
 
Call Girls Ahmedabad +917728919243 call me Independent Escort Service
Call Girls Ahmedabad +917728919243 call me Independent Escort ServiceCall Girls Ahmedabad +917728919243 call me Independent Escort Service
Call Girls Ahmedabad +917728919243 call me Independent Escort Service
 
Grade 7 - Lesson 1 - Microscope and Its Functions
Grade 7 - Lesson 1 - Microscope and Its FunctionsGrade 7 - Lesson 1 - Microscope and Its Functions
Grade 7 - Lesson 1 - Microscope and Its Functions
 
pumpkin fruit fly, water melon fruit fly, cucumber fruit fly
pumpkin fruit fly, water melon fruit fly, cucumber fruit flypumpkin fruit fly, water melon fruit fly, cucumber fruit fly
pumpkin fruit fly, water melon fruit fly, cucumber fruit fly
 
Kochi ❤CALL GIRL 84099*07087 ❤CALL GIRLS IN Kochi ESCORT SERVICE❤CALL GIRL
Kochi ❤CALL GIRL 84099*07087 ❤CALL GIRLS IN Kochi ESCORT SERVICE❤CALL GIRLKochi ❤CALL GIRL 84099*07087 ❤CALL GIRLS IN Kochi ESCORT SERVICE❤CALL GIRL
Kochi ❤CALL GIRL 84099*07087 ❤CALL GIRLS IN Kochi ESCORT SERVICE❤CALL GIRL
 
Pests of cotton_Sucking_Pests_Dr.UPR.pdf
Pests of cotton_Sucking_Pests_Dr.UPR.pdfPests of cotton_Sucking_Pests_Dr.UPR.pdf
Pests of cotton_Sucking_Pests_Dr.UPR.pdf
 
Forensic Biology & Its biological significance.pdf
Forensic Biology & Its biological significance.pdfForensic Biology & Its biological significance.pdf
Forensic Biology & Its biological significance.pdf
 
Zoology 5th semester notes( Sumit_yadav).pdf
Zoology 5th semester notes( Sumit_yadav).pdfZoology 5th semester notes( Sumit_yadav).pdf
Zoology 5th semester notes( Sumit_yadav).pdf
 
300003-World Science Day For Peace And Development.pptx
300003-World Science Day For Peace And Development.pptx300003-World Science Day For Peace And Development.pptx
300003-World Science Day For Peace And Development.pptx
 
Biogenic Sulfur Gases as Biosignatures on Temperate Sub-Neptune Waterworlds
Biogenic Sulfur Gases as Biosignatures on Temperate Sub-Neptune WaterworldsBiogenic Sulfur Gases as Biosignatures on Temperate Sub-Neptune Waterworlds
Biogenic Sulfur Gases as Biosignatures on Temperate Sub-Neptune Waterworlds
 
Factory Acceptance Test( FAT).pptx .
Factory Acceptance Test( FAT).pptx       .Factory Acceptance Test( FAT).pptx       .
Factory Acceptance Test( FAT).pptx .
 
Justdial Call Girls In Indirapuram, Ghaziabad, 8800357707 Escorts Service
Justdial Call Girls In Indirapuram, Ghaziabad, 8800357707 Escorts ServiceJustdial Call Girls In Indirapuram, Ghaziabad, 8800357707 Escorts Service
Justdial Call Girls In Indirapuram, Ghaziabad, 8800357707 Escorts Service
 
Conjugation, transduction and transformation
Conjugation, transduction and transformationConjugation, transduction and transformation
Conjugation, transduction and transformation
 
❤Jammu Kashmir Call Girls 8617697112 Personal Whatsapp Number 💦✅.
❤Jammu Kashmir Call Girls 8617697112 Personal Whatsapp Number 💦✅.❤Jammu Kashmir Call Girls 8617697112 Personal Whatsapp Number 💦✅.
❤Jammu Kashmir Call Girls 8617697112 Personal Whatsapp Number 💦✅.
 

Trend and Growth of Flow of Credit to Agriculture after 1991 in India

  • 1. IOSR Journal Of Humanities And Social Science (IOSR-JHSS) Volume 20, Issue 1, Ver. IV (Jan. 2015), PP 51-61 e-ISSN: 2279-0837, p-ISSN: 2279-0845. www.iosrjournals.org DOI: 10.9790/0837-2015161 www.iosrjournals.org 51 | Page Trend and Growth of Flow of Credit to Agriculture after 1991 in India Javid Ahmad Dar1 1 (Department of Economics, Aligarh Muslim University, India) Abstract: Agriculture in India is at a crossroads and major challenge of the policy makers is to reverse the trend of deceleration in agricultural growth which is directly associated with the declining of public investment in agricultural research and development, fragmentation of holdings, lack of infrastructure and structured markets, outdated technology and inappropriate input pricing policies of the government. The crisis of agricultural stagnation needs immediate attention and treatment on the part of planners and policy makers. Recognizing the continuous deceleration of agricultural growth, the present study attempts to analysis the trend and growth of flow of credit to agriculture after 1991in India. The study based on secondary sources of data compile from several sources, revealed that structure of credit outlets has witnessed a significant change and commercial banks have emerged as the major source of institutional credit to agriculture in recent years, but the declining share of investmental credit in total credit may constrain the sustainable growth of agriculture in India. The situation calls for concrete efforts to augment the flow of credit to agriculture, alongside to exploring the new innovations in the farming practices, product design and methods of delivery through better use of technology and related processes. Facilitating credit through processor, NGO’s and input dealers that are vertically integrated with farmers for providing them critical inputs or processing their produce, could increase the credit flow to agriculture significantly. Keywords: Institutional Credit, Agricultural Productivity, Sustainable Deployment and Inclusive Growth I. Introduction Agriculture is still the lifeline and soul of majority of the people in India. Mahatma Gandhi, 1901 rightly said that “India lives in its villages”. A large proportion of the population in India is rural agricultural and allied sector based and solely depends upon the agriculture for a livelihood creation. Therefore, an enhanced and stable growth of the agriculture & allied sector is important, as it plays a vital role not only in generating purchasing power among the rural population by creating on-farm and off-farm employment opportunities but also through its contribution to livelihood creation and ensuring the price stability in the country as whole. Although the share of agriculture in real GDP in India has been declined below one-fifth, but it continues to be an important sector of economy as it employs around 52 per cent of the workforce. The growing adult population in India demand large and incessant rise in agricultural production. Per capita availability of food, particularly cereals and pulses, in recent years has fallen significantly. As a result, slackening growth of agriculture during last decade has been a major policy concern. The importance of farm credit as a critical input for agricultural growth in India is reinforced by the unique and decisive role of Indian agriculture in the macroeconomic framework and poverty alleviation. Recognizing the importance of agriculture sector in India‟s over all development, the Government and the Reserve Bank of India (RBI) have played a vital role in creating a broad-based institutional framework for catering to the increasing credit requirements of the sector. Most of Agricultural policies in India have been reviewed from time to time to maintain pace with the changing requirements of the agriculture sector, which forms an important segment of the priority sector lending of scheduled commercial banks (SCBs). The Approach Paper to the Eleventh Five Year Plan in India has set a target of 4 per cent for the agriculture sector within the overall GDP growth target of 9 per cent. In this context, the need for affordable, sufficient and timely supply of institutional credit to agriculture has assumed critical importance. It is in this backdrop that the present paper tries to find out the trend and growth of flow of credit to agriculture after 1991 in India. The entire paper is divided into four segments. The second part explains the review of literature related to institutional credit in India. The third part tries to explain the Assessment of Progress in Agricultural Credit in India. The fourth and the last part are given to the concluding observations. II. Review Of Literature: Rosegrant and Evenson (1995) studied the total factor productivity and sources of long-term growth in Indian agriculture using data envelopment analysis (DEA) a non-parametric technique. In this study Tornqvist-
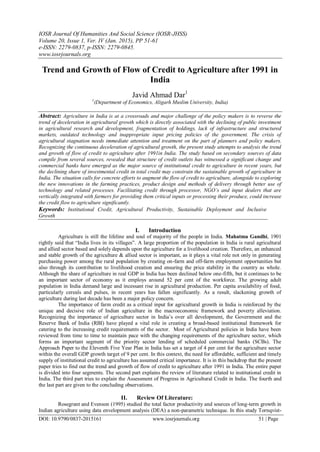
  • 2. Trend and Growth of Flow of Credit to Agriculture after 1991 in India DOI: 10.9790/0837-2015161 www.iosrjournals.org 52 | Page Theil TFP indices were computed for 271 districts which were covering around 13 states in India for the period 1956 to 1987. The study examines the sources of productivity growth, including public and private investment, and estimates the rates of return to public investments in agriculture. The results showed that significant TFP growth in the Indian crops sector was produced by investments -- primarily in research – but also in extension, markets, and irrigation. It seems from study that the Government of India is not over investing in agricultural research and extension which is important pillar for agriculture growth in India. Sarbajit Chaudhuri (2001) studied the interaction of formal and informal credit markets in backward agriculture using mathematical tools by establishing Nash equilibrium. The paper considers two alternative ways of formulating a credit subsidy policy (1) through an increase in the aggregate volume of formal credit supplied to the borrowers, keeping the formal sector interest rate at a reasonable level; and (2) through a decrease in the rate of interest charged on this type credit. The paper shows that if a credit subsidy policy is undertaken via the first path, it is actually able to lower the informal sector interest rate and improve both the agriculture productivity and welfare of farmers. Abhiman Das, Manjusha Senapati, Joice John (2009) studied the impact of agricultural credit on agricultural production using econometric tools by estimating Arellano-Bond Regression. They use Dynamic Panel Data Analysis with instrumental variables for the period 2001 to 2007. The analysis suggests that the direct agriculture credit amount has a positive and statistically significant impact on agriculture output and its effect is immediate. In particular, change in per capita agriculture direct credit (amount outstanding) by one per cent will lead to increase in per capita agriculture output by 0.11 per cent. This shows a strong effect of direct credit on agriculture output. III. Assesment Of Progress In Agricultural Credit In India: In India a multi-agency approach comprising co-operative banks, scheduled commercial banks and RRBs has been followed for purveying credit to agricultural sector. The policy of agricultural credit is guided mainly by the considerations of ensuring adequate and timely availability of credit at reasonable rates through the expansion of institutional framework, its outreach and scale as also by way of directed lending. Over the time, a spectacular progress has been achieved in terms of the scale and outreach of institutional framework for agricultural credit. 1. Agricultural Credit Discernible Trend: in India one of the major achievements in the post-independent is widening the spread of institutional machinery for credit and decline in the role of non-institutional sources, notwithstanding some reversal in the trend observed particularly in the 1990s. The share of institutional credit, which was little over 66.3% in 1991, increased manifold to over 68.8 per cent in 2010, reflecting concomitantly a remarkable decline in the share of non institutional credit from around 30.6 per cent to about 29.7 per cent during the same period (Table-1) Table-1: Relative Share of Borrowing of Cultivator Households from Different Sources (Per cent) Sources 1991 2002 2010 Non-institutional sources of which 30.6 38.9 29.7 Money Lenders 17.5 26.8 21.9 Institutional of which 66.3 61.3 68.8 Cooperative Societies/Banks 23.6 30.2 24.9 Commercial Banks 35.2 26.3 25.1 Unspecified 3.1 - 1.5 Total 100.0 100.0 100.0 Source: All India Debt and Investment Survey and NSSO. In India the efforts to increase the flow of credit to agriculture seems to have yielded better results in the recent years as the total institutional credit to agriculture recorded a growth of around 14 per cent during 1991-92 to 2008-09. In terms of total credit to agriculture, the commercial banks recorded a considerable growth (from around 43 per cent to about 69 per cent), while cooperative banks registered a fall (over 52 per cent to over 18 per cent) during the above period. There is a considerable increase in RRBs from five percent to 13 per cent as shown in (Fig-1).
  • 3. Trend and Growth of Flow of Credit to Agriculture after 1991 in India DOI: 10.9790/0837-2015161 www.iosrjournals.org 53 | Page Fig-1: Institutional framework The Compound Annual Growth (CAGR) of loans issued through direct finance to agriculture and allied activities witnessed a growth of 19.57% with a coefficient of variation C.V. of 100.29% from 1991 to 2010 from all institutions. The highest growth was registered in case of RRBs (26.63%) and Scheduled commercial banks (22.59%) over the period. On the other hand in case of loans outstanding to direct finance to agriculture and allied activities, the CAGR of all institutional sources was calculated as 15.81% with a C.V as 85.58% from 1991 to 2010. The highest growth of outstanding credit was registered in case of RRBs (19.08%) and Scheduled commercial banks (17.14%) over the period (table-2) Table-2: Direct institutional credit for agriculture and allied activities Total (short term and long term) (Rs. crore) Year Loan Issued Loan Outstanding Cooperat ives State govts SCBs RRBs Total (2 to 5) cooperatives SCBs RRBs Total (7 to 9) 1 2 3 4 5 6 7 8 9 10 1990-91 4819 359 4676 335 10188 10531 17032 1753 29316 1991-92 5797 339 4806 596 11538 12176 16981 1984 31142 1992-93 6484 3389 4960 698 12530 13769 18288 2206 34263 1993-94 8484 377 5400 752 15013 15316 19113 2560 36988 1994-95 9876 407 7408 1083 18773 16810 20920 3009 40738 1995-96 12483 554 9274 1381 23692 19126 23427 3467 46020 1996-97 13254 668 10675 1748 26345 20556 26327 4038 50921 1997-98 14159 858 11537 2103 28656 21390 28445 4683 54518 1998-99 15099 420 14663 2515 32697 22199 29819 5389 57408 1999-00 25678 520 16350 2985 45534 41950 33442 5991 81383 2000-01 27295 487 16440 3966 48187 46135 38270 7249 91654 2001-02 30569 443 18638 4546 54195 52110 45106 8286 105502 2002-03 34040 - 25256 5879 65175 59064 53804 10261 123129 2003-04 40049 - 36203 7175 83427 71403 68103 11721 151228 2004-05 45009 - 48367 11927 105303 78822 95519 16709 191050 2005-06 48123 - 80599 15300 144021 82327 135603 21510 239439 2006-07 54019 - 115266 20228 189513 89443 169018 27452 285913 2007-08 57643 - 113472 23838 194953 65666 202796 33216 301678 2008-09 58787 - 160690 26499 245976 64045 256119 37367 357531 2009-10 74938 - 188263 34640 - 76480 315436 46282 - CAGR 15.50 -1.59 22.59 26.63 19.57 12.69 17.14 19.08 15.81 S.D 21248.6 848.6 56162.2 10237.1 71561.7 27614.7 88534.4 13355.4 104031.5 C.V 724.45 115.45 125.79 121.73 100.29 62.81 109.74 104.69 85.58 SCBs: Scheduled Commercial Banks RRBs: Regional Rural Banks Source: 1. Reserve Bank of India. S.D.(Standard Deviation) and C.V( Coefficient of Variation) 2. National Bank for agriculture and Rural Development The Compound Annual Growth (CAGR) of loans issued through indirect finance to agriculture and allied activities witnessed a growth of 30.91% with a coefficient of variation C.V. of 92.77% from 1991 to 2010 from all institutions. The highest growth was registered in case of a Scheduled commercial banks (40.81%) and cooperatives (31.00%) over the period. On the other hand in case of loans outstanding to indirect finance to agriculture and allied activities, the CAGR of all institutional sources was calculated as 24.32% with a C.V as 91.08% from 1991 to 2010. The highest growth of outstanding credit was registered in case of cooperatives (28.67%) and Scheduled commercial banks (19.98%) over the period (table-3)
  • 4. Trend and Growth of Flow of Credit to Agriculture after 1991 in India DOI: 10.9790/0837-2015161 www.iosrjournals.org 54 | Page Table-3: Indirect institutional credit for agriculture and allied activities total (short term and long term) (Rs. crore) SCBs: Scheduled Commercial Banks RRBs: Regional Rural Banks Source: 1. Reserve Bank of India ( in Case of SCBs) 2. National Bank for Agriculture and Rural Development (in case of RRBs And cooperatives) 3. Rural Electrification Corporation Ltd. ( In Case of REC). The Sectoral deployment of gross bank credit reveals that the share of agriculture since the second half of 1990s has ranged between 11-12 per cent. As at end March 2010, the share agriculture sectoral deployment of gross bank credit stood at around 13 per cent (Table-4).
  • 5. Trend and Growth of Flow of Credit to Agriculture after 1991 in India DOI: 10.9790/0837-2015161 www.iosrjournals.org 55 | Page Table-4: Sectoral Deployment of Gross Bank Credit (Rupees crore) Source: Report on Trend and Progress of Banking in India, Various issues. 2. Equity in Institutional Credit to Agriculture: In India a skewed distribution of institutional credit across regions has been found to persist. In view of glaring disparities in the distribution of agricultural credit across regions, it is argued that the benefits of institutional credit have largely accrued to the relatively prosperous regions and richer sections within each region (Table-5). The extent of variations in the distribution of institutional credit can be gauged from the fact that the institutional credit per hectare in 2007-08 in Assam (Rs 1979) was about one-eighth of the national average (Rs 15936) and about 3 per cent of Kerala (Rs 56890). There seems to be a direct relationship between institutional credit flow and the level of agricultural development. For instance the level of institutional credit is higher in states like Haryana (Rs 34012/ha), Kerala (Rs 56890/ha), Punjab (Rs 46593/ha), Tamil Nadu (Rs 52427/ha), and low in states like Assam (Rs 1979/ha), Bihar (Rs 8880/ha), Madhya Pradesh (Rs 9627/ha), Orissa (Rs 6370/ha), Rajasthan (Rs 6673/ha), etc Table -5: Distribution of institutional agricultural credit across major states of India (Rs / ha) States 1990-91 2000-01 2007-08 Andhra Pradesh 1120 4604 23441 Assam 54 311 1979 Bihar 233 1075 8880 Gujarat 501 2809 12626 Haryana 482 2964 34012 Himachal Pradesh 207 2555 19490 Jammu & Kashmir 191 764 7893 Karnataka 546 3432 15448 Kerala 2766 7666 56890 Madhya Pradesh 320 698 9627 Maharashtra 387 1352 12138 Orissa 319 479 6730 Punjab 856 5352 46593 Rajasthan 158 667 6673 Tamil Nadu 2857 9403 52427 Uttar Pradesh 376 1529 29065 West Bengal 329 1708 14025
  • 6. Trend and Growth of Flow of Credit to Agriculture after 1991 in India DOI: 10.9790/0837-2015161 www.iosrjournals.org 56 | Page All India 549 2169 15936 Coefficient of variation 121.88 94.15 80.71 Source: Report of Advisory Committee on Flow of Credit to Agriculture and Related Activities from Banking System, RBI, Mumbai, 2004. However, the study reveals that the regional disparities in the distribution of institutional credit seem to have declined over time in India. The coefficient of variation in the distribution of institutional credit across states was 122 per cent in 1990-91 which declined to 94 in 2000-01 and further to 81per cent in 2007-08. But, 81 per cent is quite a significant level which reveals that the regional disparities in institutional credit flow do exist and are still a part of rural credit system. The distribution of institutional credit across farm-size categories is also skewed (Table-6). Though, the majority of farmers (82%) in India possess less than two hectares of land, they together account for only 50 per cent of the institutional credit; while18 per cent of the farmers having more than two hectares of land, account for 49 per cent of the institutional credit. The skewed distribution of institutional credit in agriculture seems to emanate from the skewed distribution of land. It may be mentioned that 18 per cent of these farmers operate about 53 per cent of the total cultivable land in the country. Table-6: Distribution of Direct Institutional Agricultural Credit by SCBs to farmers according to size of land holdings short term and long term (Number of accounts in thousands; Amount in Rs. crores ) Source: RBI, Report on Currency and Finance (various issues) The share of farmers having up to 2.5 acres of land, in total institutional credit has declined from 29.69 per cent in TE 1982-83 to 24.43 per cent in TE 2008-09. However, the share of farmers operating 2.5 to 5 acres of land has increased from 21.60 per cent in TE 1982-83 to 23.73 per cent in TE 2008-09. The share of large farmers, operating greater than 5 acres of land, in institutional credit has increased from 48.73 per cent in TE 1982-83 to 51.86per cent in TE 2008-09. 3. Progress in Kisan Credit Card Scheme: The Kisan Credit Card (KCC) Scheme was introduced in 1998-99 to facilitate farmers‟ access to short-term credit from the formal financial institutions. The credit under this scheme is sanctioned in proportion to the size of owned land, but there is some flexibility for the farmers cultivating leased-in land, in addition to their owned holding. The KCC scheme has made a rapid progress and till 31 March, 2009, about 80.8 million KCCs have been issued by the co-operative banks, commercial banks and RRBs (Table-7). The share of co-operative banks and commercial banks in distribution of KCCs was 44 per cent and 43 per cent, respectively; the remaining 14 per cent was issued by RRBs. The growth in distribution of KCCs has been phenomenal. The distribution of KCCs grew at the rate of 44 per cent per annum; the highest growth rate (75%) was witnessed by RRBs. The distribution of KCCs by cooperative banks grew at the rate of 46 per cent per annum during this period. The KCCs issued by the commercial banks witnessed an annual growth rate of 42 per cent during this period. Table-7: Progress in the Distribution of Kisan Credit Cards (Agency-wise) Year Cooperative Banks Regional Rural Banks Scheduled Commercial Banks Total 1998-99 0.16 0.01 0.62 0.78 1999-00 3.75 0.18 1.99 5.91 2000-01 9.36 0.83 5.38 14.56 2001-02 14.8 1.66 8.45 23.90 2002-03 19.38 2.62 11.15 32.14 2003-04 24.26 3.89 14.24 41.39 2004-05 27.82 5.62 18.64 51.07
  • 7. Trend and Growth of Flow of Credit to Agriculture after 1991 in India DOI: 10.9790/0837-2015161 www.iosrjournals.org 57 | Page 2005-06 30.42 6.87 22.8 59.08 2006-07 32.72 8.28 27.61 67.59 2007-08 34.81 10.05 32.21 76.05 2008-09 35.87 11.26 33.67 80.80 Share In Total 44.39 13.894 41.67 100 CAGR (%) 45.87 75.27 42.12 44.25 Source: NABARD and Economic Survey The higher growth rate witnessed in the distribution of KCCs is reflected in higher density of KCCs. On an average, two-thirds of the farming households possess KCCs in India. However, the distribution of KCCs has depicted a significant variation across states. The distribution of KCCs and its intensity in terms of per unit farming household and per unit farm size is presented in (Table-8). Table-8: State-wise Distribution of Kisan Credit Cards: 2008 Source: NABARD and Agriculture CensusDivision Ministry Of agriculture, New Delhi The highest intensity in distribution of KCCs was observed in Punjab (2.02). The distribution of KCCs was more than two-times the number of operating households in Punjab. Some other states which have distributed more number of KCCs than the number of farming households are: Haryana (1.44), Andhra Pradesh (1.06) and Orissa (1.04). The performance of states like Assam, Bihar, Himachal Pradesh and Jammu & Kashmir in distribution of KCCs has been dismal. For instance, only 5 per cent of the farming households in Jammu & Kashmir and 13 per cent in Assam have obtained KCCs. In Bihar and Himachal Pradesh, only about one-fourth of the farming households have received KCCs. The density of KCCs in terms of operational area varied from 0.07 / ha in Jammu & Kashmir to 1.76 / ha in Kerala. 4. Agricultural Production: Since agriculture forms the resource base for a number of agro-based industries and agro-services, it would be more meaningful to view agriculture not as farming alone but as a holistic value chain, which includes farming, wholesaling, warehousing (including logistics), processing, and retailing. Further, it may be noted that in the last two Five Year Plans, it is clearly mentioned that for the economy to grow at 9 per cent, it is important that agriculture should grow at least by 4 per cent per annum. Achieving an 8- 9 percent rate of growth in overall GDP may not deliver much in terms of poverty reduction unless agricultural growth accelerates. At the same time „growth with inclusiveness‟ can be achieved only when agriculture growth accelerates and is also widely shared amongst people and regions of the country. 5. Growth Performance of Agriculture: The growth performance of the agriculture sector has been fluctuating across the plan periods (Fig-2). It witnessed a growth rate of 4.8 per cent during the Eighth plan period (1992– 97). However, the agrarian situation saw a downturn towards the beginning of the Ninth plan period (1997– 2002) and the Tenth plan period (2002–07), when the agricultural growth rate came down to 2.5 percent and 2.4 percent respectively. This crippling growth rate of 2.4 percent in agriculture as against a robust annual average overall growth rate of 7.6 per cent for the economy during the tenth plan period was clearly a cause for concern. The trend rate of growth during the period 1992-93 to 2010-11 is 2.8 percent while the average annual rate of growth in agriculture & allied sectors-GDP during the same period is 3.2 percent. States No. Of KCCs Issued (millions) Intensity of KCC No/Households No/Hectors Andhra Pradesh 12.17 1.06 0.85 Assam 0.34 0.13 0.11 Bihar 3.06 0.26 0.45 Gujarat 2.46 0.58 0.25 Haryana 2.19 1.44 0.62 Himachal Pradesh 0.25 0.28 0.26 Jammu And Kashmir 0.07 0.05 0.07 Karnataka 4.21 0.59 0.34 Kerala 2.76 0.42 1.76 Madhya Pradesh 5.90 0.56 0.27 Maharashtra 7.19 0.59 0.36 Orissa 4.22 1.04 0.83 Junjab 2.02 2.02 0.50 Rajasthan 4.37 0.75 0.21 Tamil Nadu 4.87 0.62 0.70 Utter Pradesh 14.62 0.65 0.78 West Bengal 2.69 0.40 0.49 All India 80.80 0.67 0.51
  • 8. Trend and Growth of Flow of Credit to Agriculture after 1991 in India DOI: 10.9790/0837-2015161 www.iosrjournals.org 58 | Page Fig.-2: Growth Rates: GDP (overall) and GDP (Agriculture & Allied Sectors) Note: * Figures for the Eleventh Plan show growth rates for the first four years of the Plan. Source: CSO. The Eleventh Plan had sought to reverse the deceleration of agricultural growth which occurred in the Ninth Plan and continued into the Tenth Plan. It has some success in that foodgrain production touched a new peak of 250.42 million tonnes in2011-12. Agricultural GDP growth has accelerated to an average 3.9 percent growth during 2005-06 to 2010-11, partly because of initiatives taken since 2004. The increasing divergence between the growth trends of the total economy and that of agriculture & allied sectors suggests an under performance by agriculture (Fig-3). It is also significant that unlike the overall economic growth pattern, agricultural performance in India has been quite volatile (the Coefficient of Variation (CV) during 2000-01 to 2010-11 was 1.6 compared to 1.1 during 1992-93 to 1999-2000). Fig-3: Comparative Performance of Growth of GDP and Agriculture GDP Note: Figures are at 2004-05 prices. Source: CSO. 6. Regional Variations in Growth: The Indian agriculture growth pattern has been highly varied at the state level. Since agriculture is a state subject, the overall performance of the agriculture sector in India largely depends on what occurs at the state level. There is a wide variation in the performance of different states. During 2000-01 to 2008-09, the growth performance of agriculture in Rajasthan (8.2%), Gujarat (7.7%) and Bihar (7.1%) was much higher than that of Uttar Pradesh (2.3%) and West Bengal (2.4%). The recent dynamics of erstwhile poor performing states like Orissa, Chhattisgarh and Himachal Pradesh showing strong growth in agriculture can be seen from Fig.-4& fig-5 Fig.-4: Average Annual Growth Rate (%) of Gross State Domestic Product from Agriculture & Allied Sector, 1994-95 to 1999-2000 Source: CSO. Note: GSDP estimates are at 1993-94 prices
  • 9. Trend and Growth of Flow of Credit to Agriculture after 1991 in India DOI: 10.9790/0837-2015161 www.iosrjournals.org 59 | Page Fig.-5: Average Annual Growth Rate (%) of Gross State Domestic Product from Agriculture & Allied Sector, 2000-01 to 2008-09 Source: CSO. Note: GSDP estimates are at 1999-2000 prices. 7. Crop-Specific Growth: During 2010-11, foodgrains production was 244.78 million tonnes, comprising of 121.14 million tonnes during Kharif season and 123.64 million tonnes during the Rabi season. As per 2nd advance estimates for 2011-12, total foodgrains productions estimated at a record level of 250.42 million tonnes which is 5.64 million tonnes higher than that of the last year production. Production of rice is estimated at 102.75 million tonnes, Wheat 88.31 million tonnes, coarse cereals 42.08 million tonnes and pulses 17.28 million tonnes. Oilseeds production during 2011-12 is estimated at 30.53 million tonnes, sugarcane production is estimated at 347.87 million tonnes and cotton production is estimated at 34.09million bales (of 170 kg. each). Jute production has been estimated at 10.95 million bales (of 180 kg each). Growth in the production of agricultural crops depends upon acreage and yield. Given the limitations in the expansion of acreage, the main source of long-term output growth is improvement in yields. A comparative picture in average annual growth rates of area, production, and yield of different crops for two periods 1990-91 to 1999-2000 and 2000-01 to 2010-11 is given in Table-9. Table -9: All India Average Annual Growth Rates of Area, Production and Yield of Principal Crops (%) Crops/Crop Groups 1990-91 to 1999-2000 2000-01 to2010-11 A P Y A P Y Rice 0.70 2.09 1.36 -0.39 1.32 1.47 Wheat 1.62 4.52 2.87 0.57 1.39 0.73 Maize 0.85 2.24 1.37 2.68 7.12 4.13 Coarse Cereals -2.42 -0.08 2.03 -0.13 5.0 4.64 Total cereals -0.12 2.29 2.38 -0.09 1.82 1.69 Gram 0.88 3.86 2.97 4.31 6.39 1.19 Tur -0.45 1.89 2.03 2.58 1.89 -0.65 Total Pulses -0.91 1.06 1.82 2.30 4.02 1.21 Total Food Grains -0.27 2.19 2.43 0.34 1.95 1.37 Groundnut -2.25 -2.40 -0.30 -1.08 13.13 12.76 R&M 2.28 4.82 2.96 2.76 6.26 2.72 Soya bean 11.01 16.37 4.67 4.15 8.31 4.17 Oilseeds 0.75 2.53 1.76 1.27 7.00 5.18 Sugarcane 2.25 3.16 0.91 1.95 2.12 0.03 cotton 1.42 0.93 -0.54 2.66 12.12 9.15 Note: A: Area, P: Production, Y: Yield Source: Directorate of Economics & Statistics, Ministry of Agriculture. In the case of wheat, the growth in area and yield have been marginal during 2000-01 to 2010-11 suggesting that the yield levels have plateau for this crop. This suggests the need for renewed research to boost production and productivity. All the major coarse cereals display a negative growth in area during both the periods except for maize, which recorded an annual growth rate of 2.68 per cent in the 2000-01 to 2010-11 periods. In pulses, gram recorded a growth of 6.39 percent in production during the same period driven by expansion in the area under cultivation. Soybean has recorded a high rate of growth in production in both the periods, driven primarily by expansion in area under cultivation. IV. Conclusion And Policy Recamendations To conclude it can be said that the provision of extending formal credit to agriculture should be the central to the concern of policy makers, planners and development economists, because the significance of agriculture sector in India is not restricted to its contribution to GDP, employment and livelihood creation only, but on account of its complementarily with other sectors of the economy. It has far reaching ability to impact
  • 10. Trend and Growth of Flow of Credit to Agriculture after 1991 in India DOI: 10.9790/0837-2015161 www.iosrjournals.org 60 | Page poverty alleviation and rural development of the economy. There are several areas of importance for the agriculture sector growth. These include, among others, enhancing public sector investment in research apart from effective transfer of technology along with institutional reforms in the research set up to make it more accountable and geared towards delivery, conservation of land, water and biological resources, the development of rainfed agriculture, the development of minor irrigation, timely and adequate availability of inputs, support for marketing infrastructure, an increase in flow of credit particularly to the small and marginal farmers of the economy. 1. Major Findings of the Study 1. The share of institutional credit, which was little over 66.3% in 1991, increased manifold to over 68.8 per cent in 2010, reflecting concomitantly a remarkable decline in the share of non institutional credit from around 30.6 per cent to about 29.7 per cent. 2. A skewed distribution of institutional credit across regions has been found to persist. In view of glaring disparities in the distribution of agricultural credit across regions, it is argued that the benefits of institutional credit have largely accrued to the relatively prosperous regions and richer sections within each region. 3. Agriculture witnessed a growth rate of 4.8 per cent during the Eighth plan period (1992–97). However, the agrarian situation saw a downturn towards the beginning of the Ninth plan period (1997–2002) and the Tenth plan period (2002–07), when the agricultural growth rate came down to 2.5 percent and 2.4 percent respectively. This crippling growth rate of 2.4 percent in agriculture as against a robust annual average overall growth rate of 7.6 per cent for the economy during the tenth plan period was clearly a cause for concern. 4. The increasing divergence between the growth trends of the total economy and that of agriculture & allied sectors suggests an under performance by agriculture. It is also significant that unlike the overall economic growth pattern, agricultural performance in India has been quite volatile (the Coefficient of Variation (CV) during 2000-01 to 2010-11 was 1.6 compared to 1.1 during 1992-93 to 1999-2000). 2. Policy Recommendations: in India several committees in the recent past have come out with many suggestions and policy recommendations to improve the flow of institutional credit in rural areas. These include Expert Committee on Rural Credit (V.S. Vyas), Committee on Agricultural Credit though Commercial Banks (R.V. Gupta), Committee on Cooperatives (Vikhe Patil), and Advisory Committee on Flow of Credit to Agriculture (V.S. Vyas) etc. The government has implemented several of the suggestions made by these committees. However, based on the analysis of current status and identification of concerns in the study, some suggestions are as follows: 1. As the basic problem with rural borrowers is of repayment, efforts should be made to provide a complete package consisting of both financial and non-financial help to the borrowers to make the best use of credit, improve their repayment capacity. 2. Bank officials should try to maintain personal relationship with the borrowers and also motivate them to enhance their earnings and repayment of loans. 3. In case of term-loans, necessary arrangement should be made to provide working capital finance which is necessary to make the investment productive. 4. Procedure for loan disbursement could be made simple so that it may not be difficult for the less-educated and illiterate households to access institutional financing agencies for credit 5. It has been observed that the incidence of overdue in the rural credit system has been increasing over the years and has been steadily eroding the financial soundness of the system. There is an urgent need to check overdues and nonperforming assets (NPAs) to improve recovery performance of RFIs. References [1]. Rosegrant Mark W. and Robert E. Evenson. (1995), “Total Factor Productivity And Sources Of Long- Term Growth In Indian Agriculture” EPTD Discussion Paper No. 7, Environment and Production Technology Division, International Food Policy Research Institute, 1200 Seventeenth Street, N.W.Washington, D.C. 20036-3006 U.S.A. [2]. Sarbajit Chaudhuri (2001), “Interaction of Formal and Informal Credit Markets in Backward Agriculture: A Theoretical Analysis” Indian Economic Review, Vol. XXXVI, No.2, pp.411-428 [3]. Renuka Mahadevan (2003), “ Productivity Growth in India Agriculture, The Role of Globalization and Economic Reform”Asia- Pacific Development Journal Vol. 10, No. 2, [4]. Reserve Bank of India (2004), “Report of the Advisory Committee on Flow of Credit to Agriculture and Related Activities From the Banking System”. URL:(www.rbi.org.in) [5]. Gagan Bihari Sahu (2007), “Supply Analysis of Institutional Credit to agriculture for Major States in India” Indian journal of agriculture economics Vol. 62 No. 4, Oct-Dec.2007 [6]. Abhiman Das, Manjusha Senapati, Joice John (2009), “Impact of Agricultural Credit on Agriculture Production: An Empirical Analysis in India” Reserve Bank of India Occasional Papers Vol. 30, No.2, Monsoon 2009.
  • 11. Trend and Growth of Flow of Credit to Agriculture after 1991 in India DOI: 10.9790/0837-2015161 www.iosrjournals.org 61 | Page [7]. Devaraja T.S. May (2011), “An Analysis of Institutional Financing and Agricultural Credit Policy in India” Post Graduate Department of Commerce University of Mysore Hassan, India. [8]. State of Indian Agriculture Government of India (2012-13), “Ministry of Agriculture Department of Agriculture and Cooperation Directorate of Economics and Statistics New Delhi.