Design Optimization and Development in Air Pollution Control Device

Electrostatic Precipitators (ESP) is the device used to remove the dust particles from the processed gases coming out of boilers in cement industries, and iron core industries. There are many governing factors that affect the efficiency from that one major reason is to fully filled hopper. When hopper fills 70 % of its full limit the precipitation process stopped of that particular hopper. For remedy dust removal efficiency is increased by hopper vibrator at the time of emptying bagasse ash from the hopper. The maximum displacement is getting by using different hopper wall thicknesses, stiffener spacing as well as different configuration vibrators. Due to minimum time to complete project there are many difficulties to test at every stage to improve the design and this results in increased project cost. For this situation there is one simple way to improve the design of equipment’s through simulation in ANSYS and validation by actual physical measurements. This project presents FEA approach for modeling and analysis the hopper of electrostatic precipitator using Static, Modal and Harmonic analysis. Actual model testing is done for the validation of results. The results coming out from the FEA analysis and testing are discussed.

Recomendados
Recomendados
Mais conteúdo relacionado
Mais procurados
Mais procurados (20)
Destaque
Destaque (18)
Semelhante a Design Optimization and Development in Air Pollution Control Device
Semelhante a Design Optimization and Development in Air Pollution Control Device (20)
Último
Último (20)
Design Optimization and Development in Air Pollution Control Device
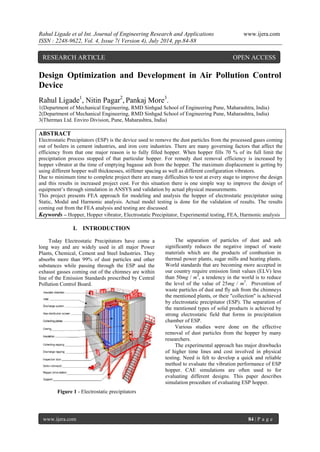
- 1. Rahul Ligade et al Int. Journal of Engineering Research and Applications www.ijera.com ISSN : 2248-9622, Vol. 4, Issue 7( Version 4), July 2014, pp.84-88 www.ijera.com 84 | P a g e Design Optimization and Development in Air Pollution Control Device Rahul Ligade1, Nitin Pagar2, Pankaj More3. 1(Department of Mechanical Engineering, RMD Sinhgad School of Engineering Pune, Maharashtra, India) 2(Department of Mechanical Engineering, RMD Sinhgad School of Engineering Pune, Maharashtra, India) 3(Thermax Ltd. Enviro Division, Pune, Maharashtra, India) ABSTRACT Electrostatic Precipitators (ESP) is the device used to remove the dust particles from the processed gases coming out of boilers in cement industries, and iron core industries. There are many governing factors that affect the efficiency from that one major reason is to fully filled hopper. When hopper fills 70 % of its full limit the precipitation process stopped of that particular hopper. For remedy dust removal efficiency is increased by hopper vibrator at the time of emptying bagasse ash from the hopper. The maximum displacement is getting by using different hopper wall thicknesses, stiffener spacing as well as different configuration vibrators. Due to minimum time to complete project there are many difficulties to test at every stage to improve the design and this results in increased project cost. For this situation there is one simple way to improve the design of equipment’s through simulation in ANSYS and validation by actual physical measurements. This project presents FEA approach for modeling and analysis the hopper of electrostatic precipitator using Static, Modal and Harmonic analysis. Actual model testing is done for the validation of results. The results coming out from the FEA analysis and testing are discussed. Keywords – Hopper, Hopper vibrator, Electrostatic Precipitator, Experimental testing, FEA, Harmonic analysis I. INTRODUCTION Today Electrostatic Precipitators have come a long way and are widely used in all major Power Plants, Chemical, Cement and Steel Industries. They absorbs more than 99% of dust particles and other substances while passing through the ESP and the exhaust gasses coming out of the chimney are within line of the Emission Standards prescribed by Central Pollution Control Board. Figure 1 - Electrostatic precipitators The separation of particles of dust and ash significantly reduces the negative impact of waste materials which are the products of combustion in thermal power plants, sugar mills and heating plants. World standards that are becoming more accepted in our country require emission limit values (ELV) less than 50mg / m3, a tendency in the world is to reduce the level of the value of 25mg / m3. Prevention of waste particles of dust and fly ash from the chimneys the mentioned plants, or their "collection" is achieved by electrostatic precipitator (ESP). The separation of the mentioned types of solid products is achieved by strong electrostatic field that forms in precipitation chamber of ESP. Various studies were done on the effective removal of dust particles from the hopper by many researchers. The experimental approach has major drawbacks of higher time lines and cost involved in physical testing. Need is felt to develop a quick and reliable method to evaluate the vibration performance of ESP hopper. CAE simulations are often used to for evaluating different designs. This paper describes simulation procedure of evaluating ESP hopper. RESEARCH ARTICLE OPEN ACCESS
- 2. Rahul Ligade et al Int. Journal of Engineering Research and Applications www.ijera.com ISSN : 2248-9622, Vol. 4, Issue 7( Version 4), July 2014, pp.84-88 www.ijera.com 85 | P a g e II. DETAILS OF HOPPER SYSTEM When the electrodes are rapped, the dust falls into hoppers and is stored temporarily before it is disposed in a landfill or reused in the process. Dust should be removed as soon as possible to avoid caking, which would make removal very difficult. Hoppers are usually designed with a 50° to 70° (60° is common) slope to allow dust to flow freely from the top of the hopper to the bottom discharge opening. Some manufacturers add devices to the hopper to promote easy and quick discharge. These devices include strike plates, poke holes, vibrators and rappers. Strike plates are simply pieces of flat steel that are bolted or welded to the center of the hopper wall. If dust becomes stuck in the hopper, rapping the strike plate several times with a mallet will free this material. Hopper designs also usually include access doors or ports. Access ports allow easier access for cleaning, inspection and maintenance of the hopper. Electrostatic precipitator hoppers are designed to completely discharge their dust load on demand. Usually the hoppers are rectangular in cross section with sides of at least 60° slope. They are insulated from neck above the discharge flange with the insulation covering the entire hopper area. Lower part of the hopper (usually 1/3 to 1/4 of height) is heated to avoid caking as well as vibrator is mounted to ensure free flow of dust. Figure 2 – Hopper Figure 3 - Hopper Vibrator III. DETAILS OF FE MODEL For the static analysis, model is created in ANSYS APDL and tested in same. For Modal and harmonic analysis model is created in solidworks and tested in ANSYS workbench To increase stability and load carrying capacity of hopper, stiffeners like L-type angle, C-type channels and pipes are used. Hopper wall thickness and stiffener spacing is changed to obtain various results of displacement. The hopper wall thickness is varied from 3mm to 10mm and stiffener spacing is varied from 800mm, 900 mm and 1000mm and vibrators of 33.33, 50, 66.66 Hz frequency are used. Figure 4 - Hopper FE model IV. ANALYSIS METHODOLOGY Following analysis are done for evaluation of ESP subsystem. Static Analysis: This analysis is carried out for basic structural design of hopper. The hoppers are designed on the basis of stress on the components. The material used for the hopper is Mild Steel. The yield strength of M.S. is 248 N/mm2, but designing the hopper at factor of safety 1.66. From the calculations designing stress is 150 N/mm2, the stress within the hopper are kept below 150 N/mm2. The stress on which design are carried out are von- mises stress in the body. Von Mises stress is a geometrical combination of all the stresses (normal stress in the three directions, and all three shear stresses) acting at a particular location, it is measured in N/mm2.
- 3. Rahul Ligade et al Int. Journal of Engineering Research and Applications www.ijera.com ISSN : 2248-9622, Vol. 4, Issue 7( Version 4), July 2014, pp.84-88 www.ijera.com 86 | P a g e Modal Analysis: It is done to study dynamic character of a system. These characteristics can be defined independently from the loads applied to the system and the response of the system. It is a technique used to determine a structure’s vibration characteristics: like Natural frequencies, Mode shapes etc. This analysis is done on a selected 900 mm spacing and 5 mm thickness wall hopper. By comparing the displacement values we selected this combination. This model was taken for the modal analysis to know the natural frequency to avoid the resonance between natural frequency and vibrator frequency. Table1 - Natural Frequency (Hz) Set Freq (Hz) Set Freq (hz) 1 15.09 6 182.82 2 26.02 7 205.52 3 73.61 8 232.71 4 126.08 9 256.83 5 158.17 10 280.75 Harmonic analysis: Basically this analysis is used to determine displacement of hopper wall. To analyse displacement of hopper we need to give the inputs as frequency, amplitude and force. Apart from these three parameters displacement is depends mainly on the thickness of hopper wall and stiffener spacing. Displacement is measured for varying hopper wall thickness with different configuration. Hopper parameters:- Wall Thickness- 3mm to 10 mm Stiffener spacing- 800mm, 900mm, 1000 mm Vibrator inputs- 33.33 Hz, 50 Hz, 66.66 Hz The detailed configurations of vibrator are shown below Table2 - Vibrator specifications Specifications Vibrator 1 Vibrator 2 Vibrator 3 Frequency (Hz) 33.33 50 66.66 Amplitude ( mm) 3 4 5 Force (N) 1000 1500 2000 V. ANALYSIS RESULTS This analysis is carried out on 4 walls, but the results of right and left hand side wall having approximately same displacement. That’s why we taking in consideration only one side wall, because of this we taking in consideration only 3 walls. Harmonic analysis of existing model of hopper is done to know the displacement values of the hopper walls. Existing hopper having 6 mm wall thickness, 800 mm stiffener spacing and 66.66 Hz vibrator mounted on one wall. The displacement of vibrator mounted wall A is 8.66mm. Side wall B having displacement of 5.36 mm and opposite side C wall having displacement of 6.1 mm. By observation in analysis it’s seen that the vibrator mounted wall (i.e. wall A) having the maximum displacement rather than other walls, for that in this paper we comparing the results of wall A only and selecting suitable one. At different configurations of stiffener spacing, thickness & vibrators we got the various different Thickness Vs Displacement results. Refer below table with his respective result graph (Thickness Vs Displacement) of hopper wall. Table 3 -Wall A Spacing 800 Comparison Sr. No. Thickness (mm) Displacement (mm) 33.33 Hz 50 Hz 66.66 Hz 1 3 8.02 9.24 12.3 2 4 7.2 8.72 11.5 3 5 6.59 8.28 10.2 4 6 5.05 7.14 8.56 5 7 3.89 6.05 7.51 6 8 3.34 5.14 6.1 7 9 2.97 3.76 4.89 8 10 1.8 2.64 3.56 Graph 1 - Thickness Vs Displacement 800 mm spacing
- 4. Rahul Ligade et al Int. Journal of Engineering Research and Applications www.ijera.com ISSN : 2248-9622, Vol. 4, Issue 7( Version 4), July 2014, pp.84-88 www.ijera.com 87 | P a g e Table 4 -Wall A Spacing 900 Comparison Sr. No. Thickness (mm) Displacement (mm) 33.33 Hz 50 Hz 66.66 Hz 1 3 9.98 13.1 16.5 2 4 9.08 11.3 15.8 3 5 8.02 9.27 12.7 4 6 6.73 8.56 12.3 5 7 5.05 7.14 10.12 6 8 4.42 5.14 7.82 7 9 3.34 4.2 5.36 8 10 2.06 2.95 4.02 Graph 2 - Thickness Vs Displacement900 mm spacing Table 5 -Wall A Spacing 1000 Comparison Sr. No. Thickness (mm) Displacement (mm) 33.33 Hz 50 Hz 66.66 Hz 1 3 11.4 15.3 18.2 2 4 9.91 12.5 16.4 3 5 9.08 11.3 14.2 4 6 7.2 10.23 12.5 5 7 6.48 8.28 9.89 6 8 5.54 6.05 8.28 7 9 4.42 5.38 7.24 8 10 3.7 4.89 6.1 Graph 3 - Thickness Vs Displacement 1000 mm spacing We have constraint that the maximum displacement value should not exceed 10 mm, for that we considering results of displacement less than 10 mm. The existing model having configuration of 6 mm wall thickness, 800 mm stiffener spacing and 66.66 Hz vibrator, But by comparison it seen that the model having 5 mm wall thickness, 900 mm stiffener spacing and 50 Hz vibrator give the improved results than the existing model. So we selecting the new configuration model for the manufacturing and we conducted the experimental displacement measurements. VI. VALIDATION OF RESULTS Figure 6 - Onsite Equipment of ESP Validation is done by comparing the results of FEA method with measurements performed on physical model and Testing is done on actual onsite equipment of Electrostatic Precipitator as shown in Fig.6 The instrument Vibration Analyzer is used for the measurement of displacements. We have to take various sets of results to get the more accurate result during actual onsite measurement. The analysis output i.e. displacements are compared with the physical testing measurements. Figure 5 - Vibration Analyzer
- 5. Rahul Ligade et al Int. Journal of Engineering Research and Applications www.ijera.com ISSN : 2248-9622, Vol. 4, Issue 7( Version 4), July 2014, pp.84-88 www.ijera.com 88 | P a g e Results are taken on hopper having wall thickness of 5 mm, spacing between stiffeners is 900 mm and the vibrator with frequency 50 Hz is used. Results of FEA method are compared with physical testing data for validation. Table 6 Shows FEA results of existing system and after changes. 1) Reducing hopper wall thickness from 6 to 5 mm. 2) Use of stiffener spacing 900 instead of 800 mm. 3) Use of 50 Hz vibrator instead of 66.66 Hz vibrator. Table 6 - Results of FEA Method Parameter Location Existing Modified Displacement (mm) A 8.56 9.27 B 5.36 6.05 C 6.1 8.65 Table 7 shows results of physical measurements for existing and modified system of Electrostatic Precipitator. Table 7 - Results of Physical Measurements Parameter Location Existing Modified Displacement (mm) A 8.29 9.04 B 5.14 5.86 C 5.80 8.49 From above result table we observe that, analytical results are approximately same with physical results. VII. CONCLUSION The displacement caused because vibration excitation of hopper wall mainly depends upon force, amplitude, wall thickness and spacing between stiffeners. From this change we got improved results of displacement as well as initial cost saving by reducing the wall thickness and by using lower capacity vibrator which consume low power than previous vibrator. Vibrator also save the operating cost throughout its life. The result of validation gives good agreement between FEA method and testing data. With this respect FEA method presented in this paper can be useful for predicting the vibration behavior of the system during its design stage. It enables us to assess the effect of different geometrical parameters such as stiffeners spacing, plate thickness and capacity of vibrator of the system on its displacements. This method is much simpler, cost effective and time saving as compared to actual physical testing of the system. REFERENCES [1] M. L. Hunt, R. C. Weathers, A. T. Lee, and C. E. Brennen, “Effects of horizontal vibration on hopper flows of granular materials” , PHYSICS OF FLUIDS, Volume 11(1), January 1999, pp no.68-75. [2] “Influence of vibrations on particle flow behavior”, Otto-von-Guericke, Delft University of Technology DelftChem Tech Nano Structured Materials Julianalaan 136, 2628 BL Delft, the Netherlands Master final thesis CH3901 February 2008 – September 2008. [3] Carl R. wassgrenl, Melany L.unta, C hristopher E. rennen, “Effects of Vertical Vibration on Hopper Flows of Granular Material”, Particulate Materials, pp no.335-348 [4] Zeljko V. Despotovic and Aleksandar I. Ribic, “The control of electromagnetic vibratory actuator for efficient flow of dust particulate from the collecting hoppers of electrostatic precipitators”, Institute Mihajlo Pupin, University of Belgrade, Serbia. [5] G. Kache, D. Pötsch, A. Haack and J. Tomas, “Silo Discharge of An Ultrafine Cohesive Powder By Vibrating Hoppers”. [6] Th. Kollmann and J. Tomas, “Effect of Applied Vibration on Silo Hopper Design”. [7] Lyn Bates, Shrikant Dhodapkar, George Klinzing, Discharge Aids ,SHAPA Technical Bulletin No. 12 [8] Electrostatic Precipitator Components, https://www.neundorfer.com/FileUploads/CMSFiles/ESP%20Components%5B0%5D.pdf [9] Electrostatic Precipitator Operation, https://www.neundorfer.com/FileUploads/CMSFiles/ESP%20Operation%5B0%5D.pdf [10] Manuals from Thermax.