
Recomendados
Recomendados
Mais conteúdo relacionado
Semelhante a Micro Economics Take Home portion of the final ExamChapter 101.docx
Semelhante a Micro Economics Take Home portion of the final ExamChapter 101.docx (20)
Mais de healdkathaleen
Mais de healdkathaleen (20)
Último
Último (20)
Micro Economics Take Home portion of the final ExamChapter 101.docx
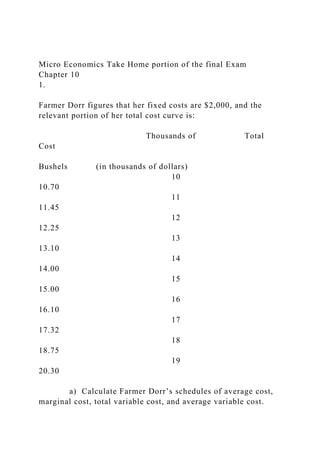
- 1. Micro Economics Take Home portion of the final Exam Chapter 10 1. Farmer Dorr figures that her fixed costs are $2,000, and the relevant portion of her total cost curve is: Thousands of Total Cost Bushels (in thousands of dollars) 10 10.70 11 11.45 12 12.25 13 13.10 14 14.00 15 15.00 16 16.10 17 17.32 18 18.75 19 20.30 a) Calculate Farmer Dorr’s schedules of average cost, marginal cost, total variable cost, and average variable cost.
- 2. b) If Farmer Dorr is a perfect competitor, what level of output should she produce, if the market price is: (i) $1.50 (iii) $0.92 (ii) $1.00 (iv) $0.82 2. Draw the relevant diagrams for a typical farm, and for the market as a whole, when the market for wheat is in long run equilibrium. Assume the farm faces perfect completion. (hint, make sure to include Demand, MC, MR and AC on the firms graph based on what we learned about perfect competitors and show the profit maximizing quantity (you will not be able to calculate but show it on the graph) for that farmer). Show the market equilibrium at $3.50/bushel and 1200 thousand bushels of wheat. 3. Xander Harris is considering whether to buy a corn and soybean farm in Iowa. The farm will cost $800,000, and Xander will be able to pay this from profits his recently deceased mother made on the stock market and willed to him. He estimates that if he does not run the farm, and keeps his current job as an economic forecaster, he will be able to earn $40,000 a year. The prevailing interest rate is 9 percent. Xander’s only motive is to maximize his income. a) Should he buy the farm, and become a farmer from an accounting viewpoint if his accountant tells him the annual profit from the farm is likely to be: i) $160,000? ii) $100,000? iii) $50,000? b) Since he is currently an economist, Xander decides to
- 3. recalculate the profit figures in a) according to the logic used by economists rather than accountants. What profit figures does he come up with? Do these new figures cause him to change his mind about becoming a farmer? 4. What examples of perfectly competitive markets can you think of in the economy? a-The most common example used for perfect competition is agriculture. While agriculture does not fit these assumptions perfectly, it comes closer to perfect competition than to any other market structure. Other example, areas suitable to growing corn are generally also very suitable to grow soybeans. Similar equipment is used to plant, cultivate and harvest corn and soybeans. If corn prices have been low, corn farmers could easily switch to growing soybeans the next year example, there are a limited number of meat processors that handle pork and poultry reducing the competition on the buying side of the market. In time, we may have to adjust our interpretation of at least some of the agricultural markets, but for the moment the best fit still appears to be perfect competition. 5. The text states that four conditions are necessary for the existence of a perfectly competitive market. Discuss in your own words each one. a) Numerous participants: Roughly how many sellers do you think are needed to make a market perfectly competitive?
- 4. b) Homogeneity of product: How would perfect competition be altered if buyers could distinguish between the products of different producers? c) Freedom of entry and exit: How might this condition be violated? What sorts of barriers to entry or exit might exist? d) Perfect information: What exactly needs to be known, and by whom, in order to make competition perfect? Chapter 11 6. Slash and Burn is a monopolist that can sell its output at these prices and with these total costs: Output Price Total Cost 4 $27 $28 5 26 34 6 25 42 7 24 52 8 23 64 9 22 88 10 21 105 11 20 125 12 19
- 5. 148 13 18 174 14 17 204 a) What level of output will Slash and Burn choose to produce? What will the selling price and profit be? b) Suppose that Slash and Burn produced at the level that a perfectly competitive industry would, with marginal cost equal to price. What would be the output, price and profit? 7. Explain why it is incorrect to speak of a monopolist’s supply curve. It doesn't make sense to talk about a monopolist's supply curve. Notice that a supply curve shows us how much output a firm will produce under any given market price. • But this concept doesn’t make sense in relation to a monopolist who sets a price, rather than taking it from the market as given. Chapter 12 8. In the beach city of Santa Barbara, California, there are seven bathing suit stores, each with the same schedule of costs and each facing an identical demand curve. Swim N Style is a typical store: Suits sold (per hour) Price Total Cost TR MR AC 1 $68
- 6. $70 2 66 80 3 64 85 4 62 90 5 60 100 6 58 115 7 56 136 8 54 164 9 52 200 10 50 245 a) Calculate total revenue , marginal revenue , marginal cost and average cost at each level of sales for the store. b) If Swim N Style is a profit maximizer, what number of suits will it sell per hour? What will its price and profit be? 9. Seventeen new bathing suit stores enter the Santa Barbara market, joining the seven that already existed. As a
- 7. consequence, the demand schedule facing Swim N Style (and all other stores) falls, while the cost schedules remain constant as in Problem 1: Suits sold (per hour) Price 1 $31.50 2 28.50 3 25.50 4 22.50 5 19.50 6 16.50 7 13.50 8 10.50 9 7.50 10 4.50 a) What number of suits will Swim N Style sell now? b) What price will it charge, and what will its profit be? c) What is the average cost per swimsuit sold? d) How many swimsuits are sold in Santa Barbara each hour, and what is the total cost incurred? e) From your calculations in Problem 1, identify the sales level at which Swim N Style’s average cost would be a minimum. What is this average cost? f) Summarize briefly what you have learned from this problem about the efficiency of monopolistic competition 10. Gas Guzzler Motors is one of three major auto producers. It is currently producing 6,000 cars a day, and selling them at a price of $10,000 each. Its marketing department tells it that its demand curve depends critically upon whether its competitors
- 8. match its price changes. If they do not change their prices when GG does, schedule l will apply; if they match GG’s price changes, schedule 2 will apply. The schedules are as follows: Cars Schedule 1 Schedule 2 (in 000s) Price per car Price per car 1 $12,500 $15,000 2 12,000 14,000 3 11,500 13,000 4 11,000 12,000 5 10,500 11,000 6 10,000 10,000 7 9,500 9,000 8 9,000 8,000 9 8,500 7,000 10 8,000 6,000 a) Calculate the marginal revenue (for increments of thousands of cars) associated with each demand schedule. b) Draw the two demand and MR curves on graph paper. c) Assume now that, if GG raises its price, its competitors will not raise theirs, but that, if it lowers it price, they will match the price cuts. On the graph paper, show the effective demand curve and marginal revenue curve that face
- 9. GG. 11. Three oligopolists, A, B and C, produce an identical product, Q. Q is produced under conditions of constant costs, that is, AC = MC = $100. The market demand schedule for Q is: Price Quantity Demanded $1,000 0 950 25 900 50 850 75 800 100 750 125 700 150 650 175 600 200 550 225 500 250 450 275 400 300 a) A, B, and C decide to act illegally as a cartel, to divide the market equally among the three of them, and to set the price and output that will maximize their total profits. What price and output do they set? What is the output level that each of the firms agrees to? What profit is earned by each firm and by the three firms together? b) A is impressed with the honesty of B and C, and believes they will keep to their agreements. They do, and A cheats by increasing output by 25 units. What is the new market price? How have the profit levels of A, B, and C changed? How have total profits in the industry changed? c) What actions are B and C likely to take in retaliation? Show how these actions will affect the market price,
- 10. and the profit levels of the three firms. d) What can you learn from this problem about the likely stability of a cartel? Chapter 20 12. The employees at Warren Manufacturing Company are unionized. As minimum requirements, the union members insist on keeping a work force of at least 300 workers, and accepting an hourly wage rate of no less than $8. Beyond those minimum requirements, however, they are considering some different economic goals. Calculated on an hourly basis, the employees’ marginal revenue product schedule is: Employees MRP 100 $20 200 18 300 16 400 14 450 13 500 12 550 11 600 10 650 9 700 8 800 6 900 4 a) If the union attempts to maximize the wage rate of its employees, subject to the above constraints, what wage rate and employment level can it expect to achieve? b) If the union attempts to maximize the employment of its members at Warren, what wage rate and employment level can it expect to achieve? 13.
- 11. Using supply and demand diagrams, plus explanations of why you have drawn the supply and demand curves the way you have, explain why, in most cases. a) Garbage collectors earn more than musicians do. b) Engineers earn more than elementary school teachers do. c) Computer software programmers earn more than migrant field workers do. d) College graduates earn more than high school dropouts do. 14. How much choice do you expect to have in your working lifetime between leisure and labor? What factors will influence your choice? Chapter 21 15. To analyze the effects of discrimination in labor markets, use supply and demand curves for labor, with the demand curves representing the value of the marginal product, show the effects of discrimination on wage rates and explain what would happen in the marker over time. Condition: Acme and United are two identical firms. Acme refuses to hire blacks, while United treats all job applicants equally. Need Graph