
Recomendados
Recomendados
Mais conteúdo relacionado
Destaque
Destaque (9)
Semelhante a Fbx Presentation 2010 Final
Semelhante a Fbx Presentation 2010 Final (20)
Fbx Presentation 2010 Final
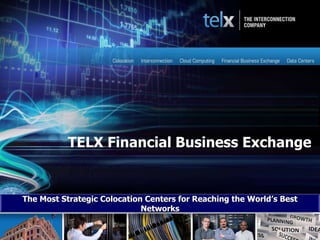
- 1. 1 1 TELX Financial Business Exchange The Most Strategic Colocation Centers for Reaching the World’s Best Networks
- 2. 2
- 3. Telx at a Glance 3 Customers: 800+ unique customers with over 1,200+ facility installations 65% of top 100 customers in multiple facilities with increasing diversification across multiple verticals Over 29,000 cross connects between customers and adding 1,200 cross connects per quarter Market leader in network neutral, global interconnection solutions and colocation in high demand markets for network-centric businesses Serves as the main connectivity hub in the most strategic datacenters in the United States for providing exchange points for content and information flow Connects communities of interest by enabling companies to exchange information through a diverse and densely populated ecosystem of IP networks, carriers, enterprises and content owners Enables deployment of new computing methods (cloud, virtualized services and software as a service)
- 4. The Most Strategic Interconnection & Colocation Centers Reaching the World’s Best Networks 4 Legend Population per square mile 250 or more 50 – 249.9 10 – 49.9 Less than 10 San Francisco, CA Santa Clara, CA Los Angeles , CA Phoenix, AZ Dallas, TX Chicago, IL New York, NY Clinton, NJ Weehawken, NJ Charlotte, NC Atlanta, GA Miami, FL California 3 Datacenters 62 Networks Dallas / Phoenix 3 Datacenters 97 Networks Southeast 3 Datacenters 122 Networks Chicago 2 Datacenters 69 Networks New York Metro 4 Datacenters 306 Networks Note: As of 12/31/09, population in 000s
- 5. 5 60 Hudson St. NY *Single Cross Connect: 1 connection away from carriers, extranet providers, and other customers. *Cost: Single cross connect, low MRC *Speed to Market: 24-48 hours from order. *Access other Financial providers /operators through our footprint of global network providers The proximity of participants in a secure Telx interconnection facility makes it easy to achieve direct, secure, low latency interconnection with networks and business partners. The Telx FBX encompasses multiple locations that house a rich ecosystem of the leading financial industry service providers linked by direct interconnections. 350 E.Cermak IL 300 Blvd East NJ 100 Delawanna Clifton NJ Telx’s Financial Business Exchange 111 8th Avenue NY
- 6. 6 One of the most pressing issues impacting financial industry firms is how to increase speed and reduce latency when accessing market data and trade execution venues. Growth in the size and quantity of orders is requiring that both the buy and sell sides develop solutions that will increase data speeds and capacity. This is necessary to realize faster and better trade execution capabilities in the highly competitive securities business. Financial Marketplace Perspective – The Need for Speed when Time is Money US equity market data continues to skyrocket •Nasdaq UQDF hit a new record one second peak of 40,471 mps, up 18% •Nasdaq TotalView ITCH 3.1 hit a new record peak of 139,880 mps over 5 seconds, up 1.3% •SIAC CTS hit a new one second record peak of 20,741, up 8% •SIAC CQS hit a new record peak of 135,151 mps over one second, up 3% •SIAC OPRA was up 6% month on month at 869,109 mps •NYSE ArcaBook Options was up 12T month on month at 565,522 mps •NYSE ArcaBook Equities was up 33% at 252,231 mps
- 7. 7 Latency will vary depending on characteristics (i.e.: message size, volume of messages in and out of the servers, traffic volumes and network speed, the physical distance between hosts and the efficiency of network drivers on the various hosts). IP network latency is generally caused by four delay categories: queuing delay, switching delay, propagation delay and serialization delays. Queuing delays reflect data bottlenecks and relate to the traffic profile. Bursty applications and resulting data spikes impact this delay. In addition, if the connection is not sized appropriately data packets will begin to get backlogged until a queue is cleared. Switching delays are related to time delays associated with moving the data packets through network components. Fewer network “hops” result in reduced latency. Propagation delays reflect timing delays for the data signals to traverse the telecommunications footprint. In general .7ms of propagation delay for every 100 km can be used to approximate this latency component. Serialization delays relate to the time it takes to move the data into a circuit. Typically the serialization delays get smaller as the bandwidth of the circuit increases. As an approximation, these delays can range from 3ms (for circuits at 1.5Mbps) down to .05 ms (for circuits at 100 Mbps). Latency Variables
- 8. 8 Capture real-time market data, distribute, store and retrieve series of data for analysis from different sources Integrated Architecture for Financial Services Back-up & Recovery Latency Reduction Data Center 1 Route & Bandwidth Agility SERVICES & APPLICATIONS SERVICE DELIVERY PLATFROM IP NETWORK Application Layer Router Integrated Call & Connection Management QOS/Packet & Route Control Data Center 2 Data Center 3 Networks are becoming distributed IT utilities Load Monitoring Dynamic Resource Allocation Policy Based Orchestration Scalability
- 9. 9 premier capital markets connectivity proximity and collocation centers in north america
Notas do Editor
- 2