SlideShare uma empresa Scribd logo
1 de 11
Experiment No. 6<br />Title: - Design Data flow diagrams<br />Aim: -To design Data Flow Diagrams for system. <br />Objective: - Study the Data Flow diagrams & design them.<br />Relevance: -<br />Data flow diagrams are providing the data value transformations.<br />Theory:-<br />Data flow diagrams can be used to provide a clear representation of any business function. The technique starts with an overall picture of the business and continues by analyzing each of the functional areas of interest. This analysis can be carried out to precisely the level of detail required. The technique exploits a method called top-down expansion to conduct the analysis in a targeted way.<br />The result is a series of diagrams that represent the business activities in a way that is clear and easy to communicate. A business model comprises one or more data flow diagrams (also known as business process diagrams). Initially a context diagram is drawn, which is a simple representation of the entire system under investigation. This is followed by a level 1 diagram; which provides an overview of the major functional areas of the business. Don't worry about the symbols at this stage, these are explained shortly. Using the context diagram together with additional information from the area of interest, the level 1 diagram can then be drawn.<br />Honourable <br />                         The level 1 diagram identifies the major business processes at a high level and any of these processes can then be analyzed further - giving rise to a corresponding level 2 business process diagram. This process of more detailed analysis can then continue – through level 3, 4 and so on. However, most investigations will stop at level 2 and it is very unusual to go beyond a level 3 diagram.Identifying the existing business processes, using a technique like data flow diagrams, is an essential precursor to business process re-engineering, migration to new technology, or refinement of an existing business process. However, the level of detail required will depend on the type of change being considered.<br />There are only five symbols that are used in the drawing of business process diagrams (data flow diagrams). These are now explained, together with the rules that apply to them.<br />    This diagram represents a banking process, which maintains customer accounts. In this example, customers can withdraw or deposit cash, request information about their account or update their account details. The five different symbols used in this example represent the full set of symbols required to draw any business process diagram. <br />External Entity                    An external entity is a source or destination of a data flow which is outside the area of study. Only those entities which originate or receive data are represented on a business process diagram. The symbol used is an oval containing a meaningful and unique identifier. <br />Process                            <br />A process shows a transformation or manipulation of data flows within the system. The symbol used is a rectangular box which contains 3 descriptive elements: Firstly an identification number appears in the upper left hand corner. This is allocated arbitrarily at the top level and serves as a unique reference.Secondly, a location appears to the right of the identifier and describes where in the system the process takes place. This may, for example, be a department or a piece of hardware. Finally, a descriptive title is placed in the centre of the box. This should be a simple imperative sentence with a specific verb, for example 'maintain customer records' or 'find driver'.<br />Data Flow                              A data flow shows the flow of information from its source to its destination. A data flow is represented by a line, with arrowheads showing the direction of flow. Information always flows to or from a process and may be written, verbal or electronic. Each data flow may be referenced by the processes or data stores at its head and tail, or by a description of its contents.Data Store                             A data store is a holding place for information within the system:It is represented by an open ended narrow rectangle. Data stores may be long-term files such as sales ledgers, or may be short-term accumulations: for example batches of documents that are waiting to be processed. Each data store should be given a reference followed by an arbitrary number. <br />Resource Flow                               A resource flow shows the flow of any physical material from its source to its destination. For this reason they are sometimes referred to as physical flows. The physical material in question should be given a meaningful name. Resource flows are usually restricted to early, high-level diagrams and are used when a description of the physical flow of materials is considered to be important to help the analysis.<br />External EntitiesIt is normal for all the information represented within a system to have been obtained from, and/or to be passed onto, an external source or recipient. These external entities may be duplicated on a diagram, to avoid crossing data flow lines. Where they are duplicated a stripe is drawn across the left hand corner, like this. The addition of a lowercase letter to each entity on the diagram is a good way to uniquely identify them. ProcessesWhen naming processes, avoid glossing over them, without really understanding their role. Indications that this has been done are the use of vague terms in the descriptive title area - like 'process' or 'update'.The most important thing to remember is that the description must be meaningful to whoever will be using the diagram. Data FlowsDouble headed arrows can be used (to show two-way flows) on all but bottom level diagrams. Furthermore, in common with most of the other symbols used, a data flow at a particular level of a diagram may be decomposed to multiple data flows at lower levels. Data StoresEach store should be given a reference letter, followed by an arbitrary number. These reference letters are allocated as follows:'D' - indicates a permanent computer file'M' - indicates a manual file 'T' - indicates a transient store, one that is deleted after processing.In order to avoid complex flows, the same data store may be drawn several times on a diagram. Multiple instances of the same data store are indicated by a double vertical bar on their left hand edge.<br />There are rules governing various aspects of the diagram components and how they can relate to one another.Data FlowsFor data flows the rules are as follows:Data flows and resource flows are allowed between external entities and processes. Data flows are also allowed between different external entities. However, data flows and resource flows are not allowed between external entities and data stores.ProcessesFor processes the data flow rules are as follows:Data flows and resource flows are allowed between processes and external entities and between processes and data stores. They are also allowed between different processes. In other words processes can communicate with all other areas of the business process diagram.<br />Data StoresFor data stores the data flow rules are as follows:Data flows and resource flows are allowed between data stores and processes. However, these flows are not allowed between data stores and external entities or between one data store and another. In practice this means that data stores cannot initiate a communication of information<br />The context diagram represents the entire system under investigation. This diagram should be drawn first, and used to clarify and agree the scope of the investigation.The components of a context diagram are clearly shown on this screen. The system under investigation is represented as a single process, connected to external entitiesby data flows and resource flows. The context diagram clearly shows the interfaces between the system under investigation and the external entities with which it communicates. Therefore, whilst it is often conceptually trivial, a context diagram serves to focus attention on the system boundary and can help in clarifying the precise scope of the analysis.The context diagram shown on this screen represents a book lending library. The library receives details of books, and orders books from one or more book suppliers. <br />Books may be reserved and borrowed by members of the public, who are required to give a borrower number. The library will notify borrowers when a reserved book becomes available or when a borrowed book becomes overdue.In addition to supplying books, a book supplier will furnish details of specific books in response to library enquiries.Note, that communications involving external entities are only included where they involve the 'system' process. Whilst a book supplier would communicate with various agencies, for example, publishers and other suppliers - these data flow are remote from the 'system' process and so this is not included on the context diagram.<br />Data Flow Diagrams – Context Diagram GuidelinesFirstly, draw and name a single process box that represents the entire system. Next, identify and add the external entities that communicate directly with the process box. Do this by considering origin and destination of the resource flows and data flows. Finally, add the resource flows and data flows to the diagram. In drawing the context diagram you should only be concerned with the most important information flows. These will be concerned with issues such as: how orders are received and checked, with providing good customer service and with the paying of invoices. Remember that no business process diagram is the definitive solution - there is no absolute right or wrong.<br />The level 1 diagram shows the main functional areas of the system under investigation. As with the context diagram, any system under investigation should be represented by only one level 1 diagram.There is no formula that can be applied in deciding what is, and what is not, a level 1 process. Level 1 processes should describe only the main functional areas of the system, and you should avoid the temptation of including lower level processes on this diagram. As a general rule no business process diagram should contain more than 12 process boxes.The level 1 diagram is surrounded by the outline of a process box that represents the boundaries of the system. Because the level 1 diagram depicts the whole of the system under investigation, it can be difficult to know where to start. There are three different methods, which provide a practical way to start the analysis. These are explained in the following section and any one of them, or a combination, may prove to be the most helpful in any given investigation.There are three different methods, which provide a practical way to start the analysis. These are introduced below and any one of them, or a combination, may prove to be the most helpful in any given investigation: <br />Data Flow Diagrams – Resource Flow AnalysisResource flow analysis may be a useful method for starting the analysis if the current system consists largely of the flow of goods, as this approach concentrates on following the flow of physical objects.Resource flow analysis may be a useful method for developing diagrams if the current system consists largely of the flow of goods. Physical resources are traced from when they arrive within the boundaries of the system, through the points at which some action occurs, to their exit from the system. The rationale behind this method is that information will normally flow around the same paths as the physical objects. Data Flow Diagrams – Organizational Structure AnalysisThe organizational structure approach starts from an analysis of the main roles that exist within the organization, rather than the goods or information that is flowing around the system.Identification of the key processes results from looking at the organizational structure and deciding which functional areas are relevant to the current investigation. By looking at these areas in more detail, and analyzing what staff actually do, discrete processes can be identified. Starting with these processes, the information flows between them and between these processes and external entities are then identified and added to the diagram.<br />Data Flow Diagrams – Document Flow AnalysisThe document flow analysis approach is appropriate if the part of the business under investigation consists principally of flows of information in the form of documents or computer input and output.Document flow analysis is particularly useful where information flows are of special interest. The first step is to list the major documents and their sources and recipients. This is followed by the identification of other major information flows such as telephone and computer transactions. <br />The section explains the process of top down expansion, or leveling. Furthermore, it illustrates that whilst there can only be one context and one level 1 diagram for a given system, these normally give rise to numerous lower level diagrams.Each process within a given business process diagram may be the subject of further analysis. This involves identifying the lower level processes that together constitute the process as it was originally identified. This procedure is known as top-down expansion or leveling.As a business process diagram is decomposed, each process box becomes a boundary for the next, lower level, diagram.<br />Data Flow Diagrams – Top Down Expansion Illustrated             <br />In order to illustrate the process of top-down expansion, consider the three processes shown within this business process diagram. No detail is shown, only the outline of the process boxes, which have been identified during the drawing of a level 1 diagram. Any area of a level 1 diagram is likely to require further analysis, as the level 1 diagram itself only provides a functional overview of the business system. Therefore, below the level 1 diagram there will be a series of lower level diagrams. These are referred to as level 2, level 3, etcetera. In practice, level 2 is usually sufficient and it is unusual to carry out an analysis beyond level 3.In this example the process numbered 3, at level 1, will be investigated further thereby giving rise to a level 2 diagram.In the level 2 diagram four processes of interest have been identified and the numbering of these processes must reflect the parent process. Therefore the level 2 processes are numbered 3.1, 3.2, 3.3 and 3.4Suppose that of these four level 2 processes, one was of sufficient interest and complexity to justify further analysis. This process, let's say 3.3, could then be further analyzed resulting in a corresponding level 3 diagram. Once again the numbering of these processes must reflect the parent process. Therefore these three level 3 processes are numbered 3.3.1, 3.3<br />      The process boxes on the level 1 diagram should be numbered arbitrarily, so that no priority is implied. Even where data from one process flows directly into another process, this does not necessarily mean that the first one has to finish before the second one can begin.Therefore the processes on a level 1 diagram could be re-numbered without affecting the meaning of the diagram. This is true within any business process diagram - as these diagrams do not imply time, sequence or repetition.However, as the analysis continues beyond level 1 it is important that a strict numbering convention is followed. The processes on level 2 diagrams must indicate their parent process within the level 1 diagram. This convention should continue through level 3 diagrams, and beyond, should that level of analysis ever be required. The diagram on this screen clearly illustrates how processes on lower level diagrams identify their ancestral path. <br />Data Flow Diagrams - When to StopIt is important to know when to stop the process of top-down expansion. Usually this will be at level 2 or level 3. There are 3 useful guidelines to help you to decide when to stop the analysis: Firstly, if a process has a single input data flow or a single output data flow then it should be apparent that there is little point in analyzing it any further.Secondly, when a process can be accurately described by a single active verb with a singular object, this also indicates that the analysis has been carried out to a sufficiently low level. For example, the process named validate enquiry contains a single discrete task.Finally, ask yourself if anything useful will be gained by further analysis of a process. Would any more detail influence your decisions? If the answer is no, then there is little point<br />In this section a variety of simple techniques are introduced to show how a business process diagram can be clarified. The examples used do not relate to any specific scenario but are hypothetical abstracts used for the purpose of illustration. Combining ProcessesFirstly, where a diagram is considered to contain too many processes, those that are related can often be combined. As a general rule no business process diagram should contain more than 12 process boxes. In some examples multiple process boxes can be identified as being related and can be combined into a single process box with a collective description.Exclude Minor Data FlowsWhere information is being retrieved from a data store, it is not necessary to show the selection criteria, or key, that is being used to retrieve it. In the banking example, the customer details are shown being retrieved from the data store but the key used to retrieve this information is not shown. Where a data store is being updated, only the data flow representing the update needs to be shown. The fact that the information must first be retrieved does not need to be shown.Only the most important reports, enquiries, etcetera should be shown on the diagram. Communications that are of less significance can, if necessary, be detailed in support documentation.Combining External EntitiesAnother way to reduce the complexity of a business process diagram is to combine any related external entities. For example, a business system will often be dealing with different units from within the same external organization, and these can be combined into a single external entity. Where these units are uniquely identified a number should follow the entity identification letter. However, when they are combined the numbers placed after the identifying alphabetic character are not shown.Combining Data StoresIn a similar way, data stores that are holding related information should be suffixed with a lower case letter. Related data stores can also be combined, and where this is the case the numbers placed after the identifying alphabetic<br />Conclusion:-<br />Here we studied the Data flow diagrams.<br />      <br />
Experiment no 6
Experiment no 6
Experiment no 6
Experiment no 6
Experiment no 6
Experiment no 6
Experiment no 6
Experiment no 6
Experiment no 6
Experiment no 6

Mais conteúdo relacionado

Mais procurados

Using data flow diagram
Using data flow diagramUsing data flow diagram
Using data flow diagramKiran Ajudiya
 
Software development life cycle
Software development life cycle Software development life cycle
Software development life cycle shefali mishra
 
Common Msisdn Resource Number Management
Common Msisdn Resource   Number ManagementCommon Msisdn Resource   Number Management
Common Msisdn Resource Number ManagementRoman Agaev
 
Assignment on diagram and flowchart 1
Assignment on diagram and flowchart 1Assignment on diagram and flowchart 1
Assignment on diagram and flowchart 1Swarnima Tiwari
 
Market Basket Analysis of Database Table References Using R
Market Basket Analysis of Database Table References Using RMarket Basket Analysis of Database Table References Using R
Market Basket Analysis of Database Table References Using RJeffrey Tyzzer
 
Data flow diagram(19th march)
Data flow diagram(19th march)Data flow diagram(19th march)
Data flow diagram(19th march)Ravi Shekhar
 
208 dataflowdgm
208 dataflowdgm208 dataflowdgm
208 dataflowdgmTCT
 
Data Flow Diagram_DFD
Data Flow Diagram_DFDData Flow Diagram_DFD
Data Flow Diagram_DFDCoT
 
Calligraph overview for emc 09.09.2011
Calligraph overview for emc 09.09.2011Calligraph overview for emc 09.09.2011
Calligraph overview for emc 09.09.2011Vladimir Losev
 

Mais procurados (20)

Using data flow diagram
Using data flow diagramUsing data flow diagram
Using data flow diagram
 
Data warehouse physical design
Data warehouse physical designData warehouse physical design
Data warehouse physical design
 
Software development life cycle
Software development life cycle Software development life cycle
Software development life cycle
 
Common Msisdn Resource Number Management
Common Msisdn Resource   Number ManagementCommon Msisdn Resource   Number Management
Common Msisdn Resource Number Management
 
DFD
DFDDFD
DFD
 
Assignment on diagram and flowchart 1
Assignment on diagram and flowchart 1Assignment on diagram and flowchart 1
Assignment on diagram and flowchart 1
 
Market Basket Analysis of Database Table References Using R
Market Basket Analysis of Database Table References Using RMarket Basket Analysis of Database Table References Using R
Market Basket Analysis of Database Table References Using R
 
Data flow diagram(19th march)
Data flow diagram(19th march)Data flow diagram(19th march)
Data flow diagram(19th march)
 
208 dataflowdgm
208 dataflowdgm208 dataflowdgm
208 dataflowdgm
 
Data Flow Diagram_DFD
Data Flow Diagram_DFDData Flow Diagram_DFD
Data Flow Diagram_DFD
 
Calligraph overview for emc 09.09.2011
Calligraph overview for emc 09.09.2011Calligraph overview for emc 09.09.2011
Calligraph overview for emc 09.09.2011
 
Dfd final
Dfd finalDfd final
Dfd final
 
Abap hr programing
Abap hr programingAbap hr programing
Abap hr programing
 
Data flow diagrams - DFD
Data flow diagrams - DFDData flow diagrams - DFD
Data flow diagrams - DFD
 
Dfd by Jimmy Rakesh
Dfd by Jimmy RakeshDfd by Jimmy Rakesh
Dfd by Jimmy Rakesh
 
Flowchart
FlowchartFlowchart
Flowchart
 
Descriptive Statistics - SPSS
Descriptive Statistics - SPSSDescriptive Statistics - SPSS
Descriptive Statistics - SPSS
 
Types of flowchart
Types of flowchartTypes of flowchart
Types of flowchart
 
Data flow diagram
Data flow diagramData flow diagram
Data flow diagram
 
Dfd mechanics
Dfd mechanicsDfd mechanics
Dfd mechanics
 

Destaque

Goingo2o - Feature Tour
Goingo2o - Feature TourGoingo2o - Feature Tour
Goingo2o - Feature TourGoingo2o
 
M-Test Manual (ua only, 2015)
M-Test Manual (ua only, 2015)M-Test Manual (ua only, 2015)
M-Test Manual (ua only, 2015)Dimitrio Lyapin
 
Hallack estado da arte do turismo de base comunitária
Hallack   estado da arte do turismo de base comunitáriaHallack   estado da arte do turismo de base comunitária
Hallack estado da arte do turismo de base comunitáriaDiogo Cardoso
 
áVila realimentando a discussão teoria de desenvolvimento local
áVila   realimentando a discussão teoria de desenvolvimento localáVila   realimentando a discussão teoria de desenvolvimento local
áVila realimentando a discussão teoria de desenvolvimento localDiogo Cardoso
 
SME-Test in Ukraine (2016)
SME-Test in Ukraine (2016)SME-Test in Ukraine (2016)
SME-Test in Ukraine (2016)Dimitrio Lyapin
 
áVila relação entre educação e desenvolvimento local
áVila   relação entre educação e desenvolvimento localáVila   relação entre educação e desenvolvimento local
áVila relação entre educação e desenvolvimento localDiogo Cardoso
 
Cartografia social como instrumento de afirmação territorial
Cartografia social como instrumento de afirmação territorialCartografia social como instrumento de afirmação territorial
Cartografia social como instrumento de afirmação territorialDiogo Cardoso
 
Bourlegat educação e preservação patrimonial e arqueológica no desenvolvime...
Bourlegat   educação e preservação patrimonial e arqueológica no desenvolvime...Bourlegat   educação e preservação patrimonial e arqueológica no desenvolvime...
Bourlegat educação e preservação patrimonial e arqueológica no desenvolvime...Diogo Cardoso
 
G Protein Coupled Receptors (GPCRs) and Cancer
G Protein Coupled Receptors (GPCRs) and CancerG Protein Coupled Receptors (GPCRs) and Cancer
G Protein Coupled Receptors (GPCRs) and CancerDayananda Salam
 
Next generation sequencing
Next generation sequencingNext generation sequencing
Next generation sequencingDayananda Salam
 

Destaque (18)

Doctor
DoctorDoctor
Doctor
 
Mitia's dinos
Mitia's dinosMitia's dinos
Mitia's dinos
 
Goingo2o - Feature Tour
Goingo2o - Feature TourGoingo2o - Feature Tour
Goingo2o - Feature Tour
 
M-Test Manual (ua only, 2015)
M-Test Manual (ua only, 2015)M-Test Manual (ua only, 2015)
M-Test Manual (ua only, 2015)
 
body systens
 body systens body systens
body systens
 
Hallack estado da arte do turismo de base comunitária
Hallack   estado da arte do turismo de base comunitáriaHallack   estado da arte do turismo de base comunitária
Hallack estado da arte do turismo de base comunitária
 
áVila realimentando a discussão teoria de desenvolvimento local
áVila   realimentando a discussão teoria de desenvolvimento localáVila   realimentando a discussão teoria de desenvolvimento local
áVila realimentando a discussão teoria de desenvolvimento local
 
SME-Test in Ukraine (2016)
SME-Test in Ukraine (2016)SME-Test in Ukraine (2016)
SME-Test in Ukraine (2016)
 
00078
0007800078
00078
 
áVila relação entre educação e desenvolvimento local
áVila   relação entre educação e desenvolvimento localáVila   relação entre educação e desenvolvimento local
áVila relação entre educação e desenvolvimento local
 
Cartografia social como instrumento de afirmação territorial
Cartografia social como instrumento de afirmação territorialCartografia social como instrumento de afirmação territorial
Cartografia social como instrumento de afirmação territorial
 
Photosynthesis
PhotosynthesisPhotosynthesis
Photosynthesis
 
Bourlegat educação e preservação patrimonial e arqueológica no desenvolvime...
Bourlegat   educação e preservação patrimonial e arqueológica no desenvolvime...Bourlegat   educação e preservação patrimonial e arqueológica no desenvolvime...
Bourlegat educação e preservação patrimonial e arqueológica no desenvolvime...
 
UXI Live 2011
UXI Live 2011UXI Live 2011
UXI Live 2011
 
G Protein Coupled Receptors (GPCRs) and Cancer
G Protein Coupled Receptors (GPCRs) and CancerG Protein Coupled Receptors (GPCRs) and Cancer
G Protein Coupled Receptors (GPCRs) and Cancer
 
คลื่นกล
คลื่นกลคลื่นกล
คลื่นกล
 
Tumor Suppressor Gene
Tumor Suppressor GeneTumor Suppressor Gene
Tumor Suppressor Gene
 
Next generation sequencing
Next generation sequencingNext generation sequencing
Next generation sequencing
 

Semelhante a Experiment no 6

Unit iv function and service oriented designs 9
Unit iv function and service oriented designs 9Unit iv function and service oriented designs 9
Unit iv function and service oriented designs 9kiruthikamurugesan2628
 
ARIS_Basic_Cheat_Sheet.pdf
ARIS_Basic_Cheat_Sheet.pdfARIS_Basic_Cheat_Sheet.pdf
ARIS_Basic_Cheat_Sheet.pdfalexandre929334
 
Structured system analysis
Structured system analysisStructured system analysis
Structured system analysislearnt
 
Elements_Cheat_Sheet.pdf
Elements_Cheat_Sheet.pdfElements_Cheat_Sheet.pdf
Elements_Cheat_Sheet.pdfbandi25
 
System Data Modelling Tools
System Data Modelling ToolsSystem Data Modelling Tools
System Data Modelling ToolsLiam Dunphy
 
System flow charts @ doms
System flow charts @  domsSystem flow charts @  doms
System flow charts @ domsBabasab Patil
 
It 302 computerized accounting (week 2) - sharifah
It 302   computerized accounting (week 2) - sharifahIt 302   computerized accounting (week 2) - sharifah
It 302 computerized accounting (week 2) - sharifahalish sha
 
Database Design
Database DesignDatabase Design
Database Designlearnt
 
Data quality management tools
Data quality management toolsData quality management tools
Data quality management toolsselinasimpson1601
 
Electronic quality management system
Electronic quality management systemElectronic quality management system
Electronic quality management systemselinasimpson2401
 
Prepare and Interpret Technical Drawing.pptx
Prepare and Interpret Technical Drawing.pptxPrepare and Interpret Technical Drawing.pptx
Prepare and Interpret Technical Drawing.pptxRivenBarquilla
 
Week10 Analysing Client Requirements
Week10 Analysing Client RequirementsWeek10 Analysing Client Requirements
Week10 Analysing Client Requirementshapy
 
SSAD; TOOLS & TECHNIQUES
SSAD; TOOLS & TECHNIQUESSSAD; TOOLS & TECHNIQUES
SSAD; TOOLS & TECHNIQUESMalvika Bansal
 
Lecture 10 documentation techniques -transaction processing- james a. hall b...
Lecture 10  documentation techniques -transaction processing- james a. hall b...Lecture 10  documentation techniques -transaction processing- james a. hall b...
Lecture 10 documentation techniques -transaction processing- james a. hall b...Habib Ullah Qamar
 
Functions of quality management
Functions of quality managementFunctions of quality management
Functions of quality managementselinasimpson2901
 
An overview of popular analytics toolkits
An overview of popular analytics toolkitsAn overview of popular analytics toolkits
An overview of popular analytics toolkitsRamkumar Ravichandran
 

Semelhante a Experiment no 6 (20)

2 flow charts
2 flow charts2 flow charts
2 flow charts
 
Unit iv function and service oriented designs 9
Unit iv function and service oriented designs 9Unit iv function and service oriented designs 9
Unit iv function and service oriented designs 9
 
Df dtutorial
Df dtutorialDf dtutorial
Df dtutorial
 
ARIS_Basic_Cheat_Sheet.pdf
ARIS_Basic_Cheat_Sheet.pdfARIS_Basic_Cheat_Sheet.pdf
ARIS_Basic_Cheat_Sheet.pdf
 
Structured system analysis
Structured system analysisStructured system analysis
Structured system analysis
 
Elements_Cheat_Sheet.pdf
Elements_Cheat_Sheet.pdfElements_Cheat_Sheet.pdf
Elements_Cheat_Sheet.pdf
 
System Data Modelling Tools
System Data Modelling ToolsSystem Data Modelling Tools
System Data Modelling Tools
 
System flow charts @ doms
System flow charts @  domsSystem flow charts @  doms
System flow charts @ doms
 
It 302 computerized accounting (week 2) - sharifah
It 302   computerized accounting (week 2) - sharifahIt 302   computerized accounting (week 2) - sharifah
It 302 computerized accounting (week 2) - sharifah
 
Database Design
Database DesignDatabase Design
Database Design
 
Data quality management tools
Data quality management toolsData quality management tools
Data quality management tools
 
Electronic quality management system
Electronic quality management systemElectronic quality management system
Electronic quality management system
 
FLOW CHARTS
FLOW CHARTSFLOW CHARTS
FLOW CHARTS
 
Prepare and Interpret Technical Drawing.pptx
Prepare and Interpret Technical Drawing.pptxPrepare and Interpret Technical Drawing.pptx
Prepare and Interpret Technical Drawing.pptx
 
Chapter 3 AIS.pptx
Chapter 3 AIS.pptxChapter 3 AIS.pptx
Chapter 3 AIS.pptx
 
Week10 Analysing Client Requirements
Week10 Analysing Client RequirementsWeek10 Analysing Client Requirements
Week10 Analysing Client Requirements
 
SSAD; TOOLS & TECHNIQUES
SSAD; TOOLS & TECHNIQUESSSAD; TOOLS & TECHNIQUES
SSAD; TOOLS & TECHNIQUES
 
Lecture 10 documentation techniques -transaction processing- james a. hall b...
Lecture 10  documentation techniques -transaction processing- james a. hall b...Lecture 10  documentation techniques -transaction processing- james a. hall b...
Lecture 10 documentation techniques -transaction processing- james a. hall b...
 
Functions of quality management
Functions of quality managementFunctions of quality management
Functions of quality management
 
An overview of popular analytics toolkits
An overview of popular analytics toolkitsAn overview of popular analytics toolkits
An overview of popular analytics toolkits
 

Último

Powerful Google developer tools for immediate impact! (2023-24 C)
Powerful Google developer tools for immediate impact! (2023-24 C)Powerful Google developer tools for immediate impact! (2023-24 C)
Powerful Google developer tools for immediate impact! (2023-24 C)wesley chun
 
Handwritten Text Recognition for manuscripts and early printed texts
Handwritten Text Recognition for manuscripts and early printed textsHandwritten Text Recognition for manuscripts and early printed texts
Handwritten Text Recognition for manuscripts and early printed textsMaria Levchenko
 
🐬 The future of MySQL is Postgres 🐘
🐬  The future of MySQL is Postgres   🐘🐬  The future of MySQL is Postgres   🐘
🐬 The future of MySQL is Postgres 🐘RTylerCroy
 
Finology Group – Insurtech Innovation Award 2024
Finology Group – Insurtech Innovation Award 2024Finology Group – Insurtech Innovation Award 2024
Finology Group – Insurtech Innovation Award 2024The Digital Insurer
 
How to convert PDF to text with Nanonets
How to convert PDF to text with NanonetsHow to convert PDF to text with Nanonets
How to convert PDF to text with Nanonetsnaman860154
 
A Domino Admins Adventures (Engage 2024)
A Domino Admins Adventures (Engage 2024)A Domino Admins Adventures (Engage 2024)
A Domino Admins Adventures (Engage 2024)Gabriella Davis
 
08448380779 Call Girls In Diplomatic Enclave Women Seeking Men
08448380779 Call Girls In Diplomatic Enclave Women Seeking Men08448380779 Call Girls In Diplomatic Enclave Women Seeking Men
08448380779 Call Girls In Diplomatic Enclave Women Seeking MenDelhi Call girls
 
Scaling API-first – The story of a global engineering organization
Scaling API-first – The story of a global engineering organizationScaling API-first – The story of a global engineering organization
Scaling API-first – The story of a global engineering organizationRadu Cotescu
 
Real Time Object Detection Using Open CV
Real Time Object Detection Using Open CVReal Time Object Detection Using Open CV
Real Time Object Detection Using Open CVKhem
 
[2024]Digital Global Overview Report 2024 Meltwater.pdf
[2024]Digital Global Overview Report 2024 Meltwater.pdf[2024]Digital Global Overview Report 2024 Meltwater.pdf
[2024]Digital Global Overview Report 2024 Meltwater.pdfhans926745
 
Automating Google Workspace (GWS) & more with Apps Script
Automating Google Workspace (GWS) & more with Apps ScriptAutomating Google Workspace (GWS) & more with Apps Script
Automating Google Workspace (GWS) & more with Apps Scriptwesley chun
 
04-2024-HHUG-Sales-and-Marketing-Alignment.pptx
04-2024-HHUG-Sales-and-Marketing-Alignment.pptx04-2024-HHUG-Sales-and-Marketing-Alignment.pptx
04-2024-HHUG-Sales-and-Marketing-Alignment.pptxHampshireHUG
 
The 7 Things I Know About Cyber Security After 25 Years | April 2024
The 7 Things I Know About Cyber Security After 25 Years | April 2024The 7 Things I Know About Cyber Security After 25 Years | April 2024
The 7 Things I Know About Cyber Security After 25 Years | April 2024Rafal Los
 
Presentation on how to chat with PDF using ChatGPT code interpreter
Presentation on how to chat with PDF using ChatGPT code interpreterPresentation on how to chat with PDF using ChatGPT code interpreter
Presentation on how to chat with PDF using ChatGPT code interpreternaman860154
 
Driving Behavioral Change for Information Management through Data-Driven Gree...
Driving Behavioral Change for Information Management through Data-Driven Gree...Driving Behavioral Change for Information Management through Data-Driven Gree...
Driving Behavioral Change for Information Management through Data-Driven Gree...Enterprise Knowledge
 
Boost Fertility New Invention Ups Success Rates.pdf
Boost Fertility New Invention Ups Success Rates.pdfBoost Fertility New Invention Ups Success Rates.pdf
Boost Fertility New Invention Ups Success Rates.pdfsudhanshuwaghmare1
 
Advantages of Hiring UIUX Design Service Providers for Your Business
Advantages of Hiring UIUX Design Service Providers for Your BusinessAdvantages of Hiring UIUX Design Service Providers for Your Business
Advantages of Hiring UIUX Design Service Providers for Your BusinessPixlogix Infotech
 
A Year of the Servo Reboot: Where Are We Now?
A Year of the Servo Reboot: Where Are We Now?A Year of the Servo Reboot: Where Are We Now?
A Year of the Servo Reboot: Where Are We Now?Igalia
 
Raspberry Pi 5: Challenges and Solutions in Bringing up an OpenGL/Vulkan Driv...
Raspberry Pi 5: Challenges and Solutions in Bringing up an OpenGL/Vulkan Driv...Raspberry Pi 5: Challenges and Solutions in Bringing up an OpenGL/Vulkan Driv...
Raspberry Pi 5: Challenges and Solutions in Bringing up an OpenGL/Vulkan Driv...Igalia
 
Axa Assurance Maroc - Insurer Innovation Award 2024
Axa Assurance Maroc - Insurer Innovation Award 2024Axa Assurance Maroc - Insurer Innovation Award 2024
Axa Assurance Maroc - Insurer Innovation Award 2024The Digital Insurer
 

Último (20)

Powerful Google developer tools for immediate impact! (2023-24 C)
Powerful Google developer tools for immediate impact! (2023-24 C)Powerful Google developer tools for immediate impact! (2023-24 C)
Powerful Google developer tools for immediate impact! (2023-24 C)
 
Handwritten Text Recognition for manuscripts and early printed texts
Handwritten Text Recognition for manuscripts and early printed textsHandwritten Text Recognition for manuscripts and early printed texts
Handwritten Text Recognition for manuscripts and early printed texts
 
🐬 The future of MySQL is Postgres 🐘
🐬  The future of MySQL is Postgres   🐘🐬  The future of MySQL is Postgres   🐘
🐬 The future of MySQL is Postgres 🐘
 
Finology Group – Insurtech Innovation Award 2024
Finology Group – Insurtech Innovation Award 2024Finology Group – Insurtech Innovation Award 2024
Finology Group – Insurtech Innovation Award 2024
 
How to convert PDF to text with Nanonets
How to convert PDF to text with NanonetsHow to convert PDF to text with Nanonets
How to convert PDF to text with Nanonets
 
A Domino Admins Adventures (Engage 2024)
A Domino Admins Adventures (Engage 2024)A Domino Admins Adventures (Engage 2024)
A Domino Admins Adventures (Engage 2024)
 
08448380779 Call Girls In Diplomatic Enclave Women Seeking Men
08448380779 Call Girls In Diplomatic Enclave Women Seeking Men08448380779 Call Girls In Diplomatic Enclave Women Seeking Men
08448380779 Call Girls In Diplomatic Enclave Women Seeking Men
 
Scaling API-first – The story of a global engineering organization
Scaling API-first – The story of a global engineering organizationScaling API-first – The story of a global engineering organization
Scaling API-first – The story of a global engineering organization
 
Real Time Object Detection Using Open CV
Real Time Object Detection Using Open CVReal Time Object Detection Using Open CV
Real Time Object Detection Using Open CV
 
[2024]Digital Global Overview Report 2024 Meltwater.pdf
[2024]Digital Global Overview Report 2024 Meltwater.pdf[2024]Digital Global Overview Report 2024 Meltwater.pdf
[2024]Digital Global Overview Report 2024 Meltwater.pdf
 
Automating Google Workspace (GWS) & more with Apps Script
Automating Google Workspace (GWS) & more with Apps ScriptAutomating Google Workspace (GWS) & more with Apps Script
Automating Google Workspace (GWS) & more with Apps Script
 
04-2024-HHUG-Sales-and-Marketing-Alignment.pptx
04-2024-HHUG-Sales-and-Marketing-Alignment.pptx04-2024-HHUG-Sales-and-Marketing-Alignment.pptx
04-2024-HHUG-Sales-and-Marketing-Alignment.pptx
 
The 7 Things I Know About Cyber Security After 25 Years | April 2024
The 7 Things I Know About Cyber Security After 25 Years | April 2024The 7 Things I Know About Cyber Security After 25 Years | April 2024
The 7 Things I Know About Cyber Security After 25 Years | April 2024
 
Presentation on how to chat with PDF using ChatGPT code interpreter
Presentation on how to chat with PDF using ChatGPT code interpreterPresentation on how to chat with PDF using ChatGPT code interpreter
Presentation on how to chat with PDF using ChatGPT code interpreter
 
Driving Behavioral Change for Information Management through Data-Driven Gree...
Driving Behavioral Change for Information Management through Data-Driven Gree...Driving Behavioral Change for Information Management through Data-Driven Gree...
Driving Behavioral Change for Information Management through Data-Driven Gree...
 
Boost Fertility New Invention Ups Success Rates.pdf
Boost Fertility New Invention Ups Success Rates.pdfBoost Fertility New Invention Ups Success Rates.pdf
Boost Fertility New Invention Ups Success Rates.pdf
 
Advantages of Hiring UIUX Design Service Providers for Your Business
Advantages of Hiring UIUX Design Service Providers for Your BusinessAdvantages of Hiring UIUX Design Service Providers for Your Business
Advantages of Hiring UIUX Design Service Providers for Your Business
 
A Year of the Servo Reboot: Where Are We Now?
A Year of the Servo Reboot: Where Are We Now?A Year of the Servo Reboot: Where Are We Now?
A Year of the Servo Reboot: Where Are We Now?
 
Raspberry Pi 5: Challenges and Solutions in Bringing up an OpenGL/Vulkan Driv...
Raspberry Pi 5: Challenges and Solutions in Bringing up an OpenGL/Vulkan Driv...Raspberry Pi 5: Challenges and Solutions in Bringing up an OpenGL/Vulkan Driv...
Raspberry Pi 5: Challenges and Solutions in Bringing up an OpenGL/Vulkan Driv...
 
Axa Assurance Maroc - Insurer Innovation Award 2024
Axa Assurance Maroc - Insurer Innovation Award 2024Axa Assurance Maroc - Insurer Innovation Award 2024
Axa Assurance Maroc - Insurer Innovation Award 2024
 

Experiment no 6

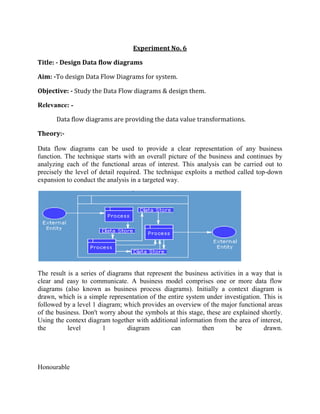
  • 1. Experiment No. 6<br />Title: - Design Data flow diagrams<br />Aim: -To design Data Flow Diagrams for system. <br />Objective: - Study the Data Flow diagrams & design them.<br />Relevance: -<br />Data flow diagrams are providing the data value transformations.<br />Theory:-<br />Data flow diagrams can be used to provide a clear representation of any business function. The technique starts with an overall picture of the business and continues by analyzing each of the functional areas of interest. This analysis can be carried out to precisely the level of detail required. The technique exploits a method called top-down expansion to conduct the analysis in a targeted way.<br />The result is a series of diagrams that represent the business activities in a way that is clear and easy to communicate. A business model comprises one or more data flow diagrams (also known as business process diagrams). Initially a context diagram is drawn, which is a simple representation of the entire system under investigation. This is followed by a level 1 diagram; which provides an overview of the major functional areas of the business. Don't worry about the symbols at this stage, these are explained shortly. Using the context diagram together with additional information from the area of interest, the level 1 diagram can then be drawn.<br />Honourable <br /> The level 1 diagram identifies the major business processes at a high level and any of these processes can then be analyzed further - giving rise to a corresponding level 2 business process diagram. This process of more detailed analysis can then continue – through level 3, 4 and so on. However, most investigations will stop at level 2 and it is very unusual to go beyond a level 3 diagram.Identifying the existing business processes, using a technique like data flow diagrams, is an essential precursor to business process re-engineering, migration to new technology, or refinement of an existing business process. However, the level of detail required will depend on the type of change being considered.<br />There are only five symbols that are used in the drawing of business process diagrams (data flow diagrams). These are now explained, together with the rules that apply to them.<br />    This diagram represents a banking process, which maintains customer accounts. In this example, customers can withdraw or deposit cash, request information about their account or update their account details. The five different symbols used in this example represent the full set of symbols required to draw any business process diagram. <br />External Entity                    An external entity is a source or destination of a data flow which is outside the area of study. Only those entities which originate or receive data are represented on a business process diagram. The symbol used is an oval containing a meaningful and unique identifier. <br />Process                            <br />A process shows a transformation or manipulation of data flows within the system. The symbol used is a rectangular box which contains 3 descriptive elements: Firstly an identification number appears in the upper left hand corner. This is allocated arbitrarily at the top level and serves as a unique reference.Secondly, a location appears to the right of the identifier and describes where in the system the process takes place. This may, for example, be a department or a piece of hardware. Finally, a descriptive title is placed in the centre of the box. This should be a simple imperative sentence with a specific verb, for example 'maintain customer records' or 'find driver'.<br />Data Flow                              A data flow shows the flow of information from its source to its destination. A data flow is represented by a line, with arrowheads showing the direction of flow. Information always flows to or from a process and may be written, verbal or electronic. Each data flow may be referenced by the processes or data stores at its head and tail, or by a description of its contents.Data Store                             A data store is a holding place for information within the system:It is represented by an open ended narrow rectangle. Data stores may be long-term files such as sales ledgers, or may be short-term accumulations: for example batches of documents that are waiting to be processed. Each data store should be given a reference followed by an arbitrary number. <br />Resource Flow                               A resource flow shows the flow of any physical material from its source to its destination. For this reason they are sometimes referred to as physical flows. The physical material in question should be given a meaningful name. Resource flows are usually restricted to early, high-level diagrams and are used when a description of the physical flow of materials is considered to be important to help the analysis.<br />External EntitiesIt is normal for all the information represented within a system to have been obtained from, and/or to be passed onto, an external source or recipient. These external entities may be duplicated on a diagram, to avoid crossing data flow lines. Where they are duplicated a stripe is drawn across the left hand corner, like this. The addition of a lowercase letter to each entity on the diagram is a good way to uniquely identify them. ProcessesWhen naming processes, avoid glossing over them, without really understanding their role. Indications that this has been done are the use of vague terms in the descriptive title area - like 'process' or 'update'.The most important thing to remember is that the description must be meaningful to whoever will be using the diagram. Data FlowsDouble headed arrows can be used (to show two-way flows) on all but bottom level diagrams. Furthermore, in common with most of the other symbols used, a data flow at a particular level of a diagram may be decomposed to multiple data flows at lower levels. Data StoresEach store should be given a reference letter, followed by an arbitrary number. These reference letters are allocated as follows:'D' - indicates a permanent computer file'M' - indicates a manual file 'T' - indicates a transient store, one that is deleted after processing.In order to avoid complex flows, the same data store may be drawn several times on a diagram. Multiple instances of the same data store are indicated by a double vertical bar on their left hand edge.<br />There are rules governing various aspects of the diagram components and how they can relate to one another.Data FlowsFor data flows the rules are as follows:Data flows and resource flows are allowed between external entities and processes. Data flows are also allowed between different external entities. However, data flows and resource flows are not allowed between external entities and data stores.ProcessesFor processes the data flow rules are as follows:Data flows and resource flows are allowed between processes and external entities and between processes and data stores. They are also allowed between different processes. In other words processes can communicate with all other areas of the business process diagram.<br />Data StoresFor data stores the data flow rules are as follows:Data flows and resource flows are allowed between data stores and processes. However, these flows are not allowed between data stores and external entities or between one data store and another. In practice this means that data stores cannot initiate a communication of information<br />The context diagram represents the entire system under investigation. This diagram should be drawn first, and used to clarify and agree the scope of the investigation.The components of a context diagram are clearly shown on this screen. The system under investigation is represented as a single process, connected to external entitiesby data flows and resource flows. The context diagram clearly shows the interfaces between the system under investigation and the external entities with which it communicates. Therefore, whilst it is often conceptually trivial, a context diagram serves to focus attention on the system boundary and can help in clarifying the precise scope of the analysis.The context diagram shown on this screen represents a book lending library. The library receives details of books, and orders books from one or more book suppliers. <br />Books may be reserved and borrowed by members of the public, who are required to give a borrower number. The library will notify borrowers when a reserved book becomes available or when a borrowed book becomes overdue.In addition to supplying books, a book supplier will furnish details of specific books in response to library enquiries.Note, that communications involving external entities are only included where they involve the 'system' process. Whilst a book supplier would communicate with various agencies, for example, publishers and other suppliers - these data flow are remote from the 'system' process and so this is not included on the context diagram.<br />Data Flow Diagrams – Context Diagram GuidelinesFirstly, draw and name a single process box that represents the entire system. Next, identify and add the external entities that communicate directly with the process box. Do this by considering origin and destination of the resource flows and data flows. Finally, add the resource flows and data flows to the diagram. In drawing the context diagram you should only be concerned with the most important information flows. These will be concerned with issues such as: how orders are received and checked, with providing good customer service and with the paying of invoices. Remember that no business process diagram is the definitive solution - there is no absolute right or wrong.<br />The level 1 diagram shows the main functional areas of the system under investigation. As with the context diagram, any system under investigation should be represented by only one level 1 diagram.There is no formula that can be applied in deciding what is, and what is not, a level 1 process. Level 1 processes should describe only the main functional areas of the system, and you should avoid the temptation of including lower level processes on this diagram. As a general rule no business process diagram should contain more than 12 process boxes.The level 1 diagram is surrounded by the outline of a process box that represents the boundaries of the system. Because the level 1 diagram depicts the whole of the system under investigation, it can be difficult to know where to start. There are three different methods, which provide a practical way to start the analysis. These are explained in the following section and any one of them, or a combination, may prove to be the most helpful in any given investigation.There are three different methods, which provide a practical way to start the analysis. These are introduced below and any one of them, or a combination, may prove to be the most helpful in any given investigation: <br />Data Flow Diagrams – Resource Flow AnalysisResource flow analysis may be a useful method for starting the analysis if the current system consists largely of the flow of goods, as this approach concentrates on following the flow of physical objects.Resource flow analysis may be a useful method for developing diagrams if the current system consists largely of the flow of goods. Physical resources are traced from when they arrive within the boundaries of the system, through the points at which some action occurs, to their exit from the system. The rationale behind this method is that information will normally flow around the same paths as the physical objects. Data Flow Diagrams – Organizational Structure AnalysisThe organizational structure approach starts from an analysis of the main roles that exist within the organization, rather than the goods or information that is flowing around the system.Identification of the key processes results from looking at the organizational structure and deciding which functional areas are relevant to the current investigation. By looking at these areas in more detail, and analyzing what staff actually do, discrete processes can be identified. Starting with these processes, the information flows between them and between these processes and external entities are then identified and added to the diagram.<br />Data Flow Diagrams – Document Flow AnalysisThe document flow analysis approach is appropriate if the part of the business under investigation consists principally of flows of information in the form of documents or computer input and output.Document flow analysis is particularly useful where information flows are of special interest. The first step is to list the major documents and their sources and recipients. This is followed by the identification of other major information flows such as telephone and computer transactions. <br />The section explains the process of top down expansion, or leveling. Furthermore, it illustrates that whilst there can only be one context and one level 1 diagram for a given system, these normally give rise to numerous lower level diagrams.Each process within a given business process diagram may be the subject of further analysis. This involves identifying the lower level processes that together constitute the process as it was originally identified. This procedure is known as top-down expansion or leveling.As a business process diagram is decomposed, each process box becomes a boundary for the next, lower level, diagram.<br />Data Flow Diagrams – Top Down Expansion Illustrated             <br />In order to illustrate the process of top-down expansion, consider the three processes shown within this business process diagram. No detail is shown, only the outline of the process boxes, which have been identified during the drawing of a level 1 diagram. Any area of a level 1 diagram is likely to require further analysis, as the level 1 diagram itself only provides a functional overview of the business system. Therefore, below the level 1 diagram there will be a series of lower level diagrams. These are referred to as level 2, level 3, etcetera. In practice, level 2 is usually sufficient and it is unusual to carry out an analysis beyond level 3.In this example the process numbered 3, at level 1, will be investigated further thereby giving rise to a level 2 diagram.In the level 2 diagram four processes of interest have been identified and the numbering of these processes must reflect the parent process. Therefore the level 2 processes are numbered 3.1, 3.2, 3.3 and 3.4Suppose that of these four level 2 processes, one was of sufficient interest and complexity to justify further analysis. This process, let's say 3.3, could then be further analyzed resulting in a corresponding level 3 diagram. Once again the numbering of these processes must reflect the parent process. Therefore these three level 3 processes are numbered 3.3.1, 3.3<br />      The process boxes on the level 1 diagram should be numbered arbitrarily, so that no priority is implied. Even where data from one process flows directly into another process, this does not necessarily mean that the first one has to finish before the second one can begin.Therefore the processes on a level 1 diagram could be re-numbered without affecting the meaning of the diagram. This is true within any business process diagram - as these diagrams do not imply time, sequence or repetition.However, as the analysis continues beyond level 1 it is important that a strict numbering convention is followed. The processes on level 2 diagrams must indicate their parent process within the level 1 diagram. This convention should continue through level 3 diagrams, and beyond, should that level of analysis ever be required. The diagram on this screen clearly illustrates how processes on lower level diagrams identify their ancestral path. <br />Data Flow Diagrams - When to StopIt is important to know when to stop the process of top-down expansion. Usually this will be at level 2 or level 3. There are 3 useful guidelines to help you to decide when to stop the analysis: Firstly, if a process has a single input data flow or a single output data flow then it should be apparent that there is little point in analyzing it any further.Secondly, when a process can be accurately described by a single active verb with a singular object, this also indicates that the analysis has been carried out to a sufficiently low level. For example, the process named validate enquiry contains a single discrete task.Finally, ask yourself if anything useful will be gained by further analysis of a process. Would any more detail influence your decisions? If the answer is no, then there is little point<br />In this section a variety of simple techniques are introduced to show how a business process diagram can be clarified. The examples used do not relate to any specific scenario but are hypothetical abstracts used for the purpose of illustration. Combining ProcessesFirstly, where a diagram is considered to contain too many processes, those that are related can often be combined. As a general rule no business process diagram should contain more than 12 process boxes. In some examples multiple process boxes can be identified as being related and can be combined into a single process box with a collective description.Exclude Minor Data FlowsWhere information is being retrieved from a data store, it is not necessary to show the selection criteria, or key, that is being used to retrieve it. In the banking example, the customer details are shown being retrieved from the data store but the key used to retrieve this information is not shown. Where a data store is being updated, only the data flow representing the update needs to be shown. The fact that the information must first be retrieved does not need to be shown.Only the most important reports, enquiries, etcetera should be shown on the diagram. Communications that are of less significance can, if necessary, be detailed in support documentation.Combining External EntitiesAnother way to reduce the complexity of a business process diagram is to combine any related external entities. For example, a business system will often be dealing with different units from within the same external organization, and these can be combined into a single external entity. Where these units are uniquely identified a number should follow the entity identification letter. However, when they are combined the numbers placed after the identifying alphabetic character are not shown.Combining Data StoresIn a similar way, data stores that are holding related information should be suffixed with a lower case letter. Related data stores can also be combined, and where this is the case the numbers placed after the identifying alphabetic<br />Conclusion:-<br />Here we studied the Data flow diagrams.<br /> <br />